Mean State
Download Data |
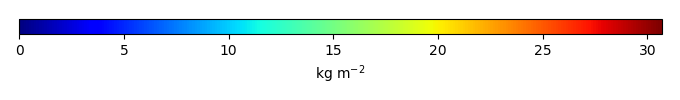
Period Mean (original grids) [Pg] |
Model Period Mean (intersection) [Pg] |
Model Period Mean (complement) [Pg] |
Benchmark Period Mean (intersection) [Pg] |
Benchmark Period Mean (complement) [Pg] |
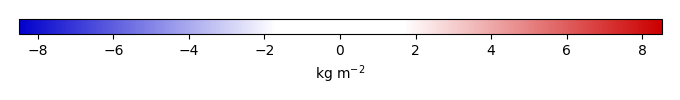
Bias [kg m-2] |
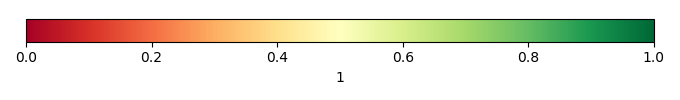
Bias Score [1] |
Spatial Distribution Score [1] |
Overall Score [1] |
|||
|---|---|---|---|---|---|---|---|---|---|---|---|---|
| Benchmark | [-] | 6.34 | ||||||||||
| CLM4 | [-] | 4.63 | 4.26 | 0.328 | 6.34 | 0.191 | -0.0691 | 0.56 | 0.79 | 0.68 | ||
| CLM4.5 | [-] | 4.94 | 4.44 | 0.449 | 6.34 | 0.191 | 0.0169 | 0.55 | 0.81 | 0.68 | ||
| CLM5 | [-] | 8.00 | 7.13 | 0.773 | 6.34 | 0.191 | 0.497 | 0.60 | 0.84 | 0.72 |
Download Data |
Period Mean (original grids) [Pg] |
Model Period Mean (intersection) [Pg] |
Model Period Mean (complement) [Pg] |
Benchmark Period Mean (intersection) [Pg] |
Benchmark Period Mean (complement) [Pg] |
Bias [kg m-2] |
Bias Score [1] |
Spatial Distribution Score [1] |
Overall Score [1] |
|||
|---|---|---|---|---|---|---|---|---|---|---|---|---|
| Benchmark | [-] | 36.8 | ||||||||||
| CLM4 | [-] | 18.4 | 18.4 | 0.0335 | 37.9 | 0.0273 | -1.63 | 0.55 | 0.79 | 0.67 | ||
| CLM4.5 | [-] | 27.4 | 27.3 | 0.0897 | 37.9 | 0.0273 | -0.860 | 0.60 | 0.86 | 0.73 | ||
| CLM5 | [-] | 48.6 | 48.3 | 0.231 | 37.9 | 0.0273 | 0.941 | 0.47 | 0.65 | 0.56 |
Download Data |
Period Mean (original grids) [Pg] |
Model Period Mean (intersection) [Pg] |
Model Period Mean (complement) [Pg] |
Benchmark Period Mean (intersection) [Pg] |
Benchmark Period Mean (complement) [Pg] |
Bias [kg m-2] |
Bias Score [1] |
Spatial Distribution Score [1] |
Overall Score [1] |
|||
|---|---|---|---|---|---|---|---|---|---|---|---|---|
| Benchmark | [-] | 19.1 | ||||||||||
| CLM4 | [-] | 12.7 | 12.7 | 0.0390 | 19.0 | 0.240 | -0.609 | 0.59 | 0.71 | 0.65 | ||
| CLM4.5 | [-] | 24.2 | 24.1 | 0.144 | 19.0 | 0.240 | 0.649 | 0.59 | 0.90 | 0.75 | ||
| CLM5 | [-] | 45.7 | 45.6 | 0.298 | 19.0 | 0.240 | 2.99 | 0.37 | 0.56 | 0.47 |
Download Data |
Period Mean (original grids) [Pg] |
Model Period Mean (intersection) [Pg] |
Model Period Mean (complement) [Pg] |
Benchmark Period Mean (intersection) [Pg] |
Benchmark Period Mean (complement) [Pg] |
Bias [kg m-2] |
Bias Score [1] |
Spatial Distribution Score [1] |
Overall Score [1] |
|||
|---|---|---|---|---|---|---|---|---|---|---|---|---|
| Benchmark | [-] | 7.57 | ||||||||||
| CLM4 | [-] | 3.41 | 2.97 | 0.188 | 7.28 | 0.0545 | -1.13 | 0.49 | 0.73 | 0.61 | ||
| CLM4.5 | [-] | 7.14 | 6.53 | 0.349 | 7.28 | 0.0545 | 0.406 | 0.50 | 0.59 | 0.55 | ||
| CLM5 | [-] | 8.57 | 7.92 | 0.448 | 7.28 | 0.0545 | 1.07 | 0.56 | 0.67 | 0.62 |
Download Data |
Period Mean (original grids) [Pg] |
Model Period Mean (intersection) [Pg] |
Model Period Mean (complement) [Pg] |
Benchmark Period Mean (intersection) [Pg] |
Benchmark Period Mean (complement) [Pg] |
Bias [kg m-2] |
Bias Score [1] |
Spatial Distribution Score [1] |
Overall Score [1] |
|||
|---|---|---|---|---|---|---|---|---|---|---|---|---|
| Benchmark | [-] | 34.1 | ||||||||||
| CLM4 | [-] | 32.3 | 31.3 | 0.783 | 33.6 | 0.103 | 0.101 | 0.58 | 0.83 | 0.70 | ||
| CLM4.5 | [-] | 32.4 | 31.3 | 0.831 | 33.6 | 0.103 | 0.120 | 0.54 | 0.80 | 0.67 | ||
| CLM5 | [-] | 32.2 | 30.9 | 0.916 | 33.6 | 0.103 | 0.0802 | 0.58 | 0.85 | 0.71 |
Download Data |
Period Mean (original grids) [Pg] |
Model Period Mean (intersection) [Pg] |
Model Period Mean (complement) [Pg] |
Benchmark Period Mean (intersection) [Pg] |
Benchmark Period Mean (complement) [Pg] |
Bias [kg m-2] |
Bias Score [1] |
Spatial Distribution Score [1] |
Overall Score [1] |
|||
|---|---|---|---|---|---|---|---|---|---|---|---|---|
| Benchmark | [-] | 28.1 | ||||||||||
| CLM4 | [-] | 62.7 | 59.8 | 2.24 | 26.7 | 1.53 | 14.7 | 0.31 | 0.62 | 0.46 | ||
| CLM4.5 | [-] | 54.6 | 51.9 | 2.19 | 26.7 | 1.53 | 12.8 | 0.39 | 0.81 | 0.60 | ||
| CLM5 | [-] | 40.3 | 38.0 | 1.80 | 26.7 | 1.53 | 7.81 | 0.60 | 0.92 | 0.76 |
Download Data |
Period Mean (original grids) [Pg] |
Model Period Mean (intersection) [Pg] |
Model Period Mean (complement) [Pg] |
Benchmark Period Mean (intersection) [Pg] |
Benchmark Period Mean (complement) [Pg] |
Bias [kg m-2] |
Bias Score [1] |
Spatial Distribution Score [1] |
Overall Score [1] |
|||
|---|---|---|---|---|---|---|---|---|---|---|---|---|
| Benchmark | [-] | 13.6 | ||||||||||
| CLM4 | [-] | 6.95 | 6.74 | 0.152 | 13.5 | 0.0773 | -0.807 | 0.55 | 0.73 | 0.64 | ||
| CLM4.5 | [-] | 13.6 | 13.1 | 0.328 | 13.5 | 0.0773 | 0.346 | 0.62 | 0.84 | 0.73 | ||
| CLM5 | [-] | 20.7 | 19.9 | 0.628 | 13.5 | 0.0773 | 1.72 | 0.47 | 0.35 | 0.41 |
Download Data |
Period Mean (original grids) [Pg] |
Model Period Mean (intersection) [Pg] |
Model Period Mean (complement) [Pg] |
Benchmark Period Mean (intersection) [Pg] |
Benchmark Period Mean (complement) [Pg] |
Bias [kg m-2] |
Bias Score [1] |
Spatial Distribution Score [1] |
Overall Score [1] |
|||
|---|---|---|---|---|---|---|---|---|---|---|---|---|
| Benchmark | [-] | 368. | ||||||||||
| CLM4 | [-] | 467. | 460. | 6.82 | 363. | 4.64 | 1.23 | 0.52 | 0.64 | 0.58 | ||
| CLM4.5 | [-] | 453. | 445. | 8.16 | 363. | 4.64 | 1.17 | 0.53 | 0.71 | 0.62 | ||
| CLM5 | [-] | 487. | 477. | 9.77 | 363. | 4.64 | 1.46 | 0.57 | 0.78 | 0.68 |
Download Data |
Period Mean (original grids) [Pg] |
Model Period Mean (intersection) [Pg] |
Model Period Mean (complement) [Pg] |
Benchmark Period Mean (intersection) [Pg] |
Benchmark Period Mean (complement) [Pg] |
Bias [kg m-2] |
Bias Score [1] |
Spatial Distribution Score [1] |
Overall Score [1] |
|||
|---|---|---|---|---|---|---|---|---|---|---|---|---|
| Benchmark | [-] | 1.17 | ||||||||||
| CLM4 | [-] | 1.49 | 1.37 | 0.112 | 1.14 | 0.0276 | 0.121 | 0.58 | 0.85 | 0.72 | ||
| CLM4.5 | [-] | 1.68 | 1.47 | 0.191 | 1.14 | 0.0276 | 0.196 | 0.55 | 0.76 | 0.65 | ||
| CLM5 | [-] | 1.56 | 1.27 | 0.276 | 1.14 | 0.0276 | 0.173 | 0.50 | 0.63 | 0.56 |
Download Data |
Period Mean (original grids) [Pg] |
Model Period Mean (intersection) [Pg] |
Model Period Mean (complement) [Pg] |
Benchmark Period Mean (intersection) [Pg] |
Benchmark Period Mean (complement) [Pg] |
Bias [kg m-2] |
Bias Score [1] |
Spatial Distribution Score [1] |
Overall Score [1] |
|||
|---|---|---|---|---|---|---|---|---|---|---|---|---|
| Benchmark | [-] | 26.7 | ||||||||||
| CLM4 | [-] | 37.8 | 34.4 | 0.297 | 26.6 | 0.0438 | 0.981 | 0.59 | 0.76 | 0.68 | ||
| CLM4.5 | [-] | 29.6 | 26.0 | 0.434 | 26.6 | 0.0438 | 0.0952 | 0.49 | 0.73 | 0.61 | ||
| CLM5 | [-] | 27.1 | 24.2 | 0.487 | 26.6 | 0.0438 | -0.137 | 0.64 | 0.89 | 0.76 |
Download Data |
Period Mean (original grids) [Pg] |
Model Period Mean (intersection) [Pg] |
Model Period Mean (complement) [Pg] |
Benchmark Period Mean (intersection) [Pg] |
Benchmark Period Mean (complement) [Pg] |
Bias [kg m-2] |
Bias Score [1] |
Spatial Distribution Score [1] |
Overall Score [1] |
|||
|---|---|---|---|---|---|---|---|---|---|---|---|---|
| Benchmark | [-] | 28.3 | ||||||||||
| CLM4 | [-] | 52.9 | 47.7 | 0.429 | 28.2 | 0.0700 | 7.56 | 0.47 | 0.62 | 0.55 | ||
| CLM4.5 | [-] | 48.5 | 43.6 | 0.527 | 28.2 | 0.0700 | 6.37 | 0.53 | 0.73 | 0.63 | ||
| CLM5 | [-] | 44.0 | 40.1 | 0.477 | 28.2 | 0.0700 | 5.08 | 0.64 | 0.93 | 0.79 |
Download Data |
Period Mean (original grids) [Pg] |
Model Period Mean (intersection) [Pg] |
Model Period Mean (complement) [Pg] |
Benchmark Period Mean (intersection) [Pg] |
Benchmark Period Mean (complement) [Pg] |
Bias [kg m-2] |
Bias Score [1] |
Spatial Distribution Score [1] |
Overall Score [1] |
|||
|---|---|---|---|---|---|---|---|---|---|---|---|---|
| Benchmark | [-] | 31.5 | ||||||||||
| CLM4 | [-] | 42.0 | 41.9 | 0.401 | 30.5 | 0.349 | 1.90 | 0.57 | 0.80 | 0.68 | ||
| CLM4.5 | [-] | 35.7 | 35.4 | 0.549 | 30.5 | 0.349 | 1.20 | 0.51 | 0.73 | 0.62 | ||
| CLM5 | [-] | 33.4 | 32.9 | 0.692 | 30.5 | 0.349 | 0.914 | 0.64 | 0.88 | 0.76 |
Download Data |
Period Mean (original grids) [Pg] |
Model Period Mean (intersection) [Pg] |
Model Period Mean (complement) [Pg] |
Benchmark Period Mean (intersection) [Pg] |
Benchmark Period Mean (complement) [Pg] |
Bias [kg m-2] |
Bias Score [1] |
Spatial Distribution Score [1] |
Overall Score [1] |
|||
|---|---|---|---|---|---|---|---|---|---|---|---|---|
| Benchmark | [-] | 23.7 | ||||||||||
| CLM4 | [-] | 28.0 | 30.9 | 0.0988 | 23.7 | 0.0475 | 0.762 | 0.56 | 0.76 | 0.66 | ||
| CLM4.5 | [-] | 21.3 | 24.2 | 0.133 | 23.7 | 0.0475 | 0.0578 | 0.51 | 0.76 | 0.64 | ||
| CLM5 | [-] | 24.7 | 26.8 | 0.291 | 23.7 | 0.0475 | 0.408 | 0.64 | 0.90 | 0.77 |
Download Data |
Period Mean (original grids) [Pg] |
Model Period Mean (intersection) [Pg] |
Model Period Mean (complement) [Pg] |
Benchmark Period Mean (intersection) [Pg] |
Benchmark Period Mean (complement) [Pg] |
Bias [kg m-2] |
Bias Score [1] |
Spatial Distribution Score [1] |
Overall Score [1] |
|||
|---|---|---|---|---|---|---|---|---|---|---|---|---|
| Benchmark | [-] | 72.3 | ||||||||||
| CLM4 | [-] | 130. | 134. | 0.282 | 72.2 | 0.0879 | 4.19 | 0.45 | 0.60 | 0.53 | ||
| CLM4.5 | [-] | 112. | 116. | 0.389 | 72.2 | 0.0879 | 3.06 | 0.54 | 0.74 | 0.64 | ||
| CLM5 | [-] | 113. | 116. | 0.571 | 72.2 | 0.0879 | 3.13 | 0.60 | 0.87 | 0.73 |
Download Data |
Period Mean (original grids) [Pg] |
Model Period Mean (intersection) [Pg] |
Model Period Mean (complement) [Pg] |
Benchmark Period Mean (intersection) [Pg] |
Benchmark Period Mean (complement) [Pg] |
Bias [kg m-2] |
Bias Score [1] |
Spatial Distribution Score [1] |
Overall Score [1] |
|||
|---|---|---|---|---|---|---|---|---|---|---|---|---|
| Benchmark | [-] | 27.3 | ||||||||||
| CLM4 | [-] | 22.3 | 22.0 | 0.178 | 27.4 | 0.0588 | -0.447 | 0.63 | 0.76 | 0.70 | ||
| CLM4.5 | [-] | 26.7 | 26.2 | 0.241 | 27.4 | 0.0588 | 0.0537 | 0.55 | 0.83 | 0.69 | ||
| CLM5 | [-] | 24.4 | 23.8 | 0.251 | 27.4 | 0.0588 | -0.212 | 0.58 | 0.85 | 0.71 |
Temporally integrated period mean