Mean State
Download Data |
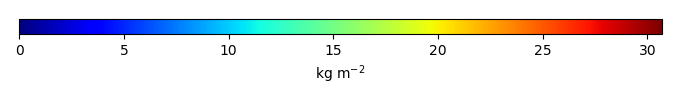
Period Mean (original grids) [Pg] |
Model Period Mean (intersection) [Pg] |
Model Period Mean (complement) [Pg] |
Benchmark Period Mean (intersection) [Pg] |
Benchmark Period Mean (complement) [Pg] |
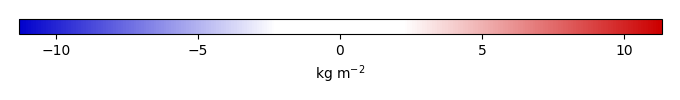
Bias [kg m-2] |
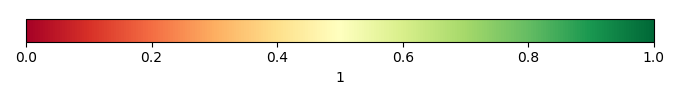
Bias Score [1] |
Spatial Distribution Score [1] |
Overall Score [1] |
|||
|---|---|---|---|---|---|---|---|---|---|---|---|---|
| Benchmark | [-] | 13.7 | ||||||||||
| CLM4 | [-] | 4.61 | 1.69 | 2.88 | 13.5 | 0.172 | -1.82 | 0.42 | 0.66 | 0.54 | ||
| CLM4.5 | [-] | 4.92 | 1.59 | 3.27 | 13.5 | 0.172 | -1.82 | 0.41 | 0.64 | 0.53 | ||
| CLM5 | [-] | 7.98 | 3.76 | 4.13 | 13.5 | 0.172 | -1.33 | 0.44 | 0.60 | 0.52 |
Download Data |
Period Mean (original grids) [Pg] |
Model Period Mean (intersection) [Pg] |
Model Period Mean (complement) [Pg] |
Benchmark Period Mean (intersection) [Pg] |
Benchmark Period Mean (complement) [Pg] |
Bias [kg m-2] |
Bias Score [1] |
Spatial Distribution Score [1] |
Overall Score [1] |
|||
|---|---|---|---|---|---|---|---|---|---|---|---|---|
| Benchmark | [-] | 10.3 | ||||||||||
| CLM4 | [-] | 3.41 | 2.94 | 0.213 | 9.93 | 0.106 | -2.04 | 0.48 | 0.68 | 0.58 | ||
| CLM4.5 | [-] | 7.12 | 6.50 | 0.375 | 9.93 | 0.106 | -0.509 | 0.55 | 0.77 | 0.66 | ||
| CLM5 | [-] | 8.56 | 7.89 | 0.477 | 9.93 | 0.106 | 0.150 | 0.62 | 0.83 | 0.73 |
Download Data |
Period Mean (original grids) [Pg] |
Model Period Mean (intersection) [Pg] |
Model Period Mean (complement) [Pg] |
Benchmark Period Mean (intersection) [Pg] |
Benchmark Period Mean (complement) [Pg] |
Bias [kg m-2] |
Bias Score [1] |
Spatial Distribution Score [1] |
Overall Score [1] |
|||
|---|---|---|---|---|---|---|---|---|---|---|---|---|
| Benchmark | [-] | 24.2 | ||||||||||
| CLM4 | [-] | 32.3 | 13.1 | 19.0 | 25.2 | 0.0842 | -1.41 | 0.47 | 0.45 | 0.46 | ||
| CLM4.5 | [-] | 32.4 | 14.1 | 18.0 | 25.2 | 0.0842 | -1.25 | 0.44 | 0.41 | 0.43 | ||
| CLM5 | [-] | 32.2 | 11.7 | 20.1 | 25.2 | 0.0842 | -1.68 | 0.49 | 0.58 | 0.54 |
Download Data |
Period Mean (original grids) [Pg] |
Model Period Mean (intersection) [Pg] |
Model Period Mean (complement) [Pg] |
Benchmark Period Mean (intersection) [Pg] |
Benchmark Period Mean (complement) [Pg] |
Bias [kg m-2] |
Bias Score [1] |
Spatial Distribution Score [1] |
Overall Score [1] |
|||
|---|---|---|---|---|---|---|---|---|---|---|---|---|
| Benchmark | [-] | 37.5 | ||||||||||
| CLM4 | [-] | 62.7 | 59.4 | 2.59 | 35.6 | 1.95 | 12.2 | 0.45 | 0.67 | 0.56 | ||
| CLM4.5 | [-] | 54.5 | 51.5 | 2.53 | 35.6 | 1.95 | 10.2 | 0.53 | 0.86 | 0.70 | ||
| CLM5 | [-] | 40.2 | 37.7 | 2.09 | 35.6 | 1.95 | 5.17 | 0.71 | 0.92 | 0.82 |
Download Data |
Period Mean (original grids) [Pg] |
Model Period Mean (intersection) [Pg] |
Model Period Mean (complement) [Pg] |
Benchmark Period Mean (intersection) [Pg] |
Benchmark Period Mean (complement) [Pg] |
Bias [kg m-2] |
Bias Score [1] |
Spatial Distribution Score [1] |
Overall Score [1] |
|||
|---|---|---|---|---|---|---|---|---|---|---|---|---|
| Benchmark | [-] | 352. | ||||||||||
| CLM4 | [-] | 467. | 376. | 90.9 | 348. | 3.81 | 0.986 | 0.54 | 0.63 | 0.58 | ||
| CLM4.5 | [-] | 452. | 327. | 125. | 348. | 3.81 | 0.359 | 0.54 | 0.70 | 0.62 | ||
| CLM5 | [-] | 486. | 309. | 178. | 348. | 3.81 | 0.0653 | 0.64 | 0.85 | 0.75 |
Download Data |
Period Mean (original grids) [Pg] |
Model Period Mean (intersection) [Pg] |
Model Period Mean (complement) [Pg] |
Benchmark Period Mean (intersection) [Pg] |
Benchmark Period Mean (complement) [Pg] |
Bias [kg m-2] |
Bias Score [1] |
Spatial Distribution Score [1] |
Overall Score [1] |
|||
|---|---|---|---|---|---|---|---|---|---|---|---|---|
| Benchmark | [-] | 0.216 | ||||||||||
| CLM4 | [-] | 1.48 | 0.00930 | 1.46 | 0.215 | 0.000273 | -0.435 | 0.38 | 0.0089 | 0.19 | ||
| CLM4.5 | [-] | 1.67 | 0.0248 | 1.63 | 0.215 | 0.000273 | -0.402 | 0.39 | 0.070 | 0.23 | ||
| CLM5 | [-] | 1.56 | 0.0205 | 1.52 | 0.215 | 0.000273 | -0.411 | 0.39 | 0.044 | 0.22 |
Download Data |
Period Mean (original grids) [Pg] |
Model Period Mean (intersection) [Pg] |
Model Period Mean (complement) [Pg] |
Benchmark Period Mean (intersection) [Pg] |
Benchmark Period Mean (complement) [Pg] |
Bias [kg m-2] |
Bias Score [1] |
Spatial Distribution Score [1] |
Overall Score [1] |
|||
|---|---|---|---|---|---|---|---|---|---|---|---|---|
| Benchmark | [-] | 34.3 | ||||||||||
| CLM4 | [-] | 37.8 | 34.5 | 0.218 | 34.3 | 0.0601 | 0.115 | 0.62 | 0.82 | 0.72 | ||
| CLM4.5 | [-] | 29.6 | 26.2 | 0.284 | 34.3 | 0.0601 | -0.634 | 0.53 | 0.80 | 0.67 | ||
| CLM5 | [-] | 27.1 | 24.4 | 0.292 | 34.3 | 0.0601 | -0.826 | 0.65 | 0.93 | 0.79 |
Download Data |
Period Mean (original grids) [Pg] |
Model Period Mean (intersection) [Pg] |
Model Period Mean (complement) [Pg] |
Benchmark Period Mean (intersection) [Pg] |
Benchmark Period Mean (complement) [Pg] |
Bias [kg m-2] |
Bias Score [1] |
Spatial Distribution Score [1] |
Overall Score [1] |
|||
|---|---|---|---|---|---|---|---|---|---|---|---|---|
| Benchmark | [-] | 30.6 | ||||||||||
| CLM4 | [-] | 52.9 | 47.7 | 0.440 | 30.5 | 0.0685 | 6.75 | 0.49 | 0.57 | 0.53 | ||
| CLM4.5 | [-] | 48.4 | 43.5 | 0.545 | 30.5 | 0.0685 | 5.54 | 0.53 | 0.68 | 0.60 | ||
| CLM5 | [-] | 44.0 | 40.0 | 0.500 | 30.5 | 0.0685 | 4.24 | 0.69 | 0.93 | 0.81 |
Download Data |
Period Mean (original grids) [Pg] |
Model Period Mean (intersection) [Pg] |
Model Period Mean (complement) [Pg] |
Benchmark Period Mean (intersection) [Pg] |
Benchmark Period Mean (complement) [Pg] |
Bias [kg m-2] |
Bias Score [1] |
Spatial Distribution Score [1] |
Overall Score [1] |
|||
|---|---|---|---|---|---|---|---|---|---|---|---|---|
| Benchmark | [-] | 57.3 | ||||||||||
| CLM4 | [-] | 42.0 | 41.8 | 0.466 | 55.7 | 0.502 | -1.21 | 0.65 | 0.87 | 0.76 | ||
| CLM4.5 | [-] | 35.7 | 35.3 | 0.618 | 55.7 | 0.502 | -1.90 | 0.56 | 0.81 | 0.69 | ||
| CLM5 | [-] | 33.4 | 32.8 | 0.777 | 55.7 | 0.502 | -2.18 | 0.63 | 0.91 | 0.77 |
Download Data |
Period Mean (original grids) [Pg] |
Model Period Mean (intersection) [Pg] |
Model Period Mean (complement) [Pg] |
Benchmark Period Mean (intersection) [Pg] |
Benchmark Period Mean (complement) [Pg] |
Bias [kg m-2] |
Bias Score [1] |
Spatial Distribution Score [1] |
Overall Score [1] |
|||
|---|---|---|---|---|---|---|---|---|---|---|---|---|
| Benchmark | [-] | 38.4 | ||||||||||
| CLM4 | [-] | 28.0 | 31.0 | 0.0750 | 38.3 | 0.0792 | -0.738 | 0.57 | 0.79 | 0.68 | ||
| CLM4.5 | [-] | 21.2 | 24.2 | 0.102 | 38.3 | 0.0792 | -1.43 | 0.52 | 0.78 | 0.65 | ||
| CLM5 | [-] | 24.7 | 26.8 | 0.255 | 38.3 | 0.0792 | -1.09 | 0.63 | 0.92 | 0.77 |
Download Data |
Period Mean (original grids) [Pg] |
Model Period Mean (intersection) [Pg] |
Model Period Mean (complement) [Pg] |
Benchmark Period Mean (intersection) [Pg] |
Benchmark Period Mean (complement) [Pg] |
Bias [kg m-2] |
Bias Score [1] |
Spatial Distribution Score [1] |
Overall Score [1] |
|||
|---|---|---|---|---|---|---|---|---|---|---|---|---|
| Benchmark | [-] | 95.5 | ||||||||||
| CLM4 | [-] | 130. | 134. | 0.313 | 95.3 | 0.198 | 2.68 | 0.52 | 0.61 | 0.57 | ||
| CLM4.5 | [-] | 112. | 116. | 0.437 | 95.3 | 0.198 | 1.53 | 0.58 | 0.75 | 0.67 | ||
| CLM5 | [-] | 113. | 116. | 0.647 | 95.3 | 0.198 | 1.60 | 0.67 | 0.88 | 0.77 |
Download Data |
Period Mean (original grids) [Pg] |
Model Period Mean (intersection) [Pg] |
Model Period Mean (complement) [Pg] |
Benchmark Period Mean (intersection) [Pg] |
Benchmark Period Mean (complement) [Pg] |
Bias [kg m-2] |
Bias Score [1] |
Spatial Distribution Score [1] |
Overall Score [1] |
|||
|---|---|---|---|---|---|---|---|---|---|---|---|---|
| Benchmark | [-] | 0.794 | ||||||||||
| CLM4 | [-] | 22.4 | 1.92 | 20.3 | 1.09 | 0.00 | 1.18 | 0.59 | 0.66 | 0.62 | ||
| CLM4.5 | [-] | 26.8 | 1.25 | 25.3 | 1.09 | 0.00 | 0.436 | 0.57 | 0.76 | 0.67 | ||
| CLM5 | [-] | 24.3 | 0.999 | 23.0 | 1.09 | 0.00 | 0.156 | 0.51 | 0.69 | 0.60 |
Temporally integrated period mean