Mean State
Download Data |
Period Mean (original grids) [Pg] |
Model Period Mean (intersection) [Pg] |
Model Period Mean (complement) [Pg] |
Benchmark Period Mean (intersection) [Pg] |
Benchmark Period Mean (complement) [Pg] |
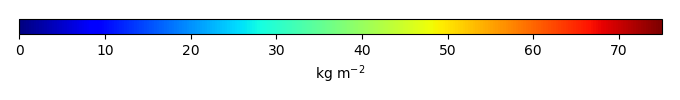
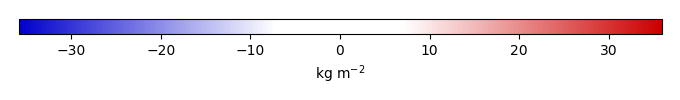
Bias [kg m-2] |
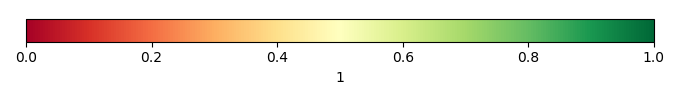
Bias Score [1] |
Spatial Distribution Score [1] |
Overall Score [1] |
|||
|---|---|---|---|---|---|---|---|---|---|---|---|---|
| Benchmark | [-] | 54.1 | ||||||||||
| CLM4 | [-] | 15.3 | 14.7 | 0.547 | 52.7 | 1.53 | -4.37 | 0.51 | 0.73 | 0.62 | ||
| CLM4.5 | [-] | 22.4 | 21.0 | 1.38 | 52.7 | 1.53 | -3.34 | 0.56 | 0.47 | 0.51 | ||
| CLM5 | [-] | 23.7 | 22.0 | 1.60 | 52.7 | 1.53 | -3.09 | 0.53 | 0.29 | 0.41 |
Download Data |
Period Mean (original grids) [Pg] |
Model Period Mean (intersection) [Pg] |
Model Period Mean (complement) [Pg] |
Benchmark Period Mean (intersection) [Pg] |
Benchmark Period Mean (complement) [Pg] |
Bias [kg m-2] |
Bias Score [1] |
Spatial Distribution Score [1] |
Overall Score [1] |
|||
|---|---|---|---|---|---|---|---|---|---|---|---|---|
| Benchmark | [-] | 182. | ||||||||||
| CLM4 | [-] | 51.6 | 51.4 | 0.158 | 184. | 1.33 | -11.1 | 0.50 | 0.43 | 0.46 | ||
| CLM4.5 | [-] | 172. | 169. | 0.766 | 184. | 1.33 | -1.09 | 0.60 | 0.75 | 0.67 | ||
| CLM5 | [-] | 253. | 248. | 0.981 | 184. | 1.33 | 5.60 | 0.58 | 0.35 | 0.46 |
Download Data |
Period Mean (original grids) [Pg] |
Model Period Mean (intersection) [Pg] |
Model Period Mean (complement) [Pg] |
Benchmark Period Mean (intersection) [Pg] |
Benchmark Period Mean (complement) [Pg] |
Bias [kg m-2] |
Bias Score [1] |
Spatial Distribution Score [1] |
Overall Score [1] |
|||
|---|---|---|---|---|---|---|---|---|---|---|---|---|
| Benchmark | [-] | 158. | ||||||||||
| CLM4 | [-] | 36.6 | 36.5 | 0.193 | 154. | 4.54 | -10.6 | 0.47 | 0.24 | 0.36 | ||
| CLM4.5 | [-] | 112. | 112. | 0.976 | 154. | 4.54 | -3.27 | 0.57 | 0.83 | 0.70 | ||
| CLM5 | [-] | 185. | 184. | 1.47 | 154. | 4.54 | 3.61 | 0.52 | 0.53 | 0.52 |
Download Data |
Period Mean (original grids) [Pg] |
Model Period Mean (intersection) [Pg] |
Model Period Mean (complement) [Pg] |
Benchmark Period Mean (intersection) [Pg] |
Benchmark Period Mean (complement) [Pg] |
Bias [kg m-2] |
Bias Score [1] |
Spatial Distribution Score [1] |
Overall Score [1] |
|||
|---|---|---|---|---|---|---|---|---|---|---|---|---|
| Benchmark | [-] | 42.0 | ||||||||||
| CLM4 | [-] | 7.07 | 6.72 | 0.292 | 37.8 | 2.79 | -9.78 | 0.47 | 0.19 | 0.33 | ||
| CLM4.5 | [-] | 15.8 | 14.7 | 1.01 | 37.8 | 2.79 | -6.10 | 0.58 | 0.62 | 0.60 | ||
| CLM5 | [-] | 15.3 | 14.2 | 0.997 | 37.8 | 2.79 | -6.25 | 0.57 | 0.66 | 0.62 |
Download Data |
Period Mean (original grids) [Pg] |
Model Period Mean (intersection) [Pg] |
Model Period Mean (complement) [Pg] |
Benchmark Period Mean (intersection) [Pg] |
Benchmark Period Mean (complement) [Pg] |
Bias [kg m-2] |
Bias Score [1] |
Spatial Distribution Score [1] |
Overall Score [1] |
|||
|---|---|---|---|---|---|---|---|---|---|---|---|---|
| Benchmark | [-] | 178. | ||||||||||
| CLM4 | [-] | 74.0 | 73.2 | 0.628 | 174. | 2.57 | -4.42 | 0.55 | 0.84 | 0.70 | ||
| CLM4.5 | [-] | 113. | 111. | 1.11 | 174. | 2.57 | -2.55 | 0.59 | 0.84 | 0.72 | ||
| CLM5 | [-] | 120. | 118. | 0.970 | 174. | 2.57 | -2.29 | 0.61 | 0.86 | 0.74 |
Download Data |
Period Mean (original grids) [Pg] |
Model Period Mean (intersection) [Pg] |
Model Period Mean (complement) [Pg] |
Benchmark Period Mean (intersection) [Pg] |
Benchmark Period Mean (complement) [Pg] |
Bias [kg m-2] |
Bias Score [1] |
Spatial Distribution Score [1] |
Overall Score [1] |
|||
|---|---|---|---|---|---|---|---|---|---|---|---|---|
| Benchmark | [-] | 61.4 | ||||||||||
| CLM4 | [-] | 21.5 | 20.0 | 1.20 | 52.4 | 9.26 | -6.41 | 0.65 | 0.18 | 0.42 | ||
| CLM4.5 | [-] | 25.0 | 22.9 | 1.77 | 52.4 | 9.26 | -4.34 | 0.67 | 0.38 | 0.53 | ||
| CLM5 | [-] | 21.6 | 19.5 | 1.70 | 52.4 | 9.26 | -5.64 | 0.66 | 0.28 | 0.47 |
Download Data |
Period Mean (original grids) [Pg] |
Model Period Mean (intersection) [Pg] |
Model Period Mean (complement) [Pg] |
Benchmark Period Mean (intersection) [Pg] |
Benchmark Period Mean (complement) [Pg] |
Bias [kg m-2] |
Bias Score [1] |
Spatial Distribution Score [1] |
Overall Score [1] |
|||
|---|---|---|---|---|---|---|---|---|---|---|---|---|
| Benchmark | [-] | 79.0 | ||||||||||
| CLM4 | [-] | 22.6 | 22.0 | 0.435 | 75.7 | 3.35 | -7.48 | 0.53 | 0.25 | 0.39 | ||
| CLM4.5 | [-] | 54.7 | 52.8 | 1.08 | 75.7 | 3.35 | -2.19 | 0.68 | 0.63 | 0.65 | ||
| CLM5 | [-] | 51.2 | 49.2 | 1.13 | 75.7 | 3.35 | -2.61 | 0.72 | 0.84 | 0.78 |
Download Data |
Period Mean (original grids) [Pg] |
Model Period Mean (intersection) [Pg] |
Model Period Mean (complement) [Pg] |
Benchmark Period Mean (intersection) [Pg] |
Benchmark Period Mean (complement) [Pg] |
Bias [kg m-2] |
Bias Score [1] |
Spatial Distribution Score [1] |
Overall Score [1] |
|||
|---|---|---|---|---|---|---|---|---|---|---|---|---|
| Benchmark | [-] | 1.38e+03 | ||||||||||
| CLM4 | [-] | 500. | 493. | 6.80 | 1.32e+03 | 56.4 | -5.57 | 0.55 | 0.46 | 0.51 | ||
| CLM4.5 | [-] | 984. | 866. | 117. | 1.32e+03 | 56.4 | -2.57 | 0.61 | 0.75 | 0.68 | ||
| CLM5 | [-] | 1.06e+03 | 1.04e+03 | 16.5 | 1.32e+03 | 56.4 | -1.32 | 0.60 | 0.43 | 0.51 |
Download Data |
Period Mean (original grids) [Pg] |
Model Period Mean (intersection) [Pg] |
Model Period Mean (complement) [Pg] |
Benchmark Period Mean (intersection) [Pg] |
Benchmark Period Mean (complement) [Pg] |
Bias [kg m-2] |
Bias Score [1] |
Spatial Distribution Score [1] |
Overall Score [1] |
|||
|---|---|---|---|---|---|---|---|---|---|---|---|---|
| Benchmark | [-] | 53.5 | ||||||||||
| CLM4 | [-] | 5.92 | 5.73 | 0.150 | 51.8 | 1.67 | -3.69 | 0.43 | 0.65 | 0.54 | ||
| CLM4.5 | [-] | 11.4 | 10.9 | 0.433 | 51.8 | 1.67 | -3.13 | 0.49 | 0.80 | 0.65 | ||
| CLM5 | [-] | 14.7 | 14.1 | 0.556 | 51.8 | 1.67 | -2.82 | 0.52 | 0.81 | 0.66 |
Download Data |
Period Mean (original grids) [Pg] |
Model Period Mean (intersection) [Pg] |
Model Period Mean (complement) [Pg] |
Benchmark Period Mean (intersection) [Pg] |
Benchmark Period Mean (complement) [Pg] |
Bias [kg m-2] |
Bias Score [1] |
Spatial Distribution Score [1] |
Overall Score [1] |
|||
|---|---|---|---|---|---|---|---|---|---|---|---|---|
| Benchmark | [-] | 76.8 | ||||||||||
| CLM4 | [-] | 40.2 | 38.5 | 0.157 | 75.9 | 0.930 | -2.84 | 0.62 | 0.91 | 0.76 | ||
| CLM4.5 | [-] | 38.5 | 36.5 | 0.362 | 75.9 | 0.930 | -2.90 | 0.55 | 0.85 | 0.70 | ||
| CLM5 | [-] | 37.5 | 35.6 | 0.322 | 75.9 | 0.930 | -3.00 | 0.56 | 0.85 | 0.71 |
Download Data |
Period Mean (original grids) [Pg] |
Model Period Mean (intersection) [Pg] |
Model Period Mean (complement) [Pg] |
Benchmark Period Mean (intersection) [Pg] |
Benchmark Period Mean (complement) [Pg] |
Bias [kg m-2] |
Bias Score [1] |
Spatial Distribution Score [1] |
Overall Score [1] |
|||
|---|---|---|---|---|---|---|---|---|---|---|---|---|
| Benchmark | [-] | 42.9 | ||||||||||
| CLM4 | [-] | 21.9 | 20.2 | 0.205 | 41.8 | 1.07 | -6.44 | 0.62 | 0.24 | 0.43 | ||
| CLM4.5 | [-] | 27.6 | 25.4 | 0.445 | 41.8 | 1.07 | -4.15 | 0.67 | 0.50 | 0.58 | ||
| CLM5 | [-] | 27.2 | 25.2 | 0.423 | 41.8 | 1.07 | -4.32 | 0.66 | 0.35 | 0.50 |
Download Data |
Period Mean (original grids) [Pg] |
Model Period Mean (intersection) [Pg] |
Model Period Mean (complement) [Pg] |
Benchmark Period Mean (intersection) [Pg] |
Benchmark Period Mean (complement) [Pg] |
Bias [kg m-2] |
Bias Score [1] |
Spatial Distribution Score [1] |
Overall Score [1] |
|||
|---|---|---|---|---|---|---|---|---|---|---|---|---|
| Benchmark | [-] | 76.0 | ||||||||||
| CLM4 | [-] | 45.3 | 44.8 | 0.532 | 71.7 | 2.73 | -2.77 | 0.68 | 0.92 | 0.80 | ||
| CLM4.5 | [-] | 53.6 | 52.3 | 1.32 | 71.7 | 2.73 | -1.46 | 0.70 | 0.81 | 0.76 | ||
| CLM5 | [-] | 41.8 | 40.7 | 1.14 | 71.7 | 2.73 | -2.98 | 0.64 | 0.83 | 0.74 |
Download Data |
Period Mean (original grids) [Pg] |
Model Period Mean (intersection) [Pg] |
Model Period Mean (complement) [Pg] |
Benchmark Period Mean (intersection) [Pg] |
Benchmark Period Mean (complement) [Pg] |
Bias [kg m-2] |
Bias Score [1] |
Spatial Distribution Score [1] |
Overall Score [1] |
|||
|---|---|---|---|---|---|---|---|---|---|---|---|---|
| Benchmark | [-] | 65.1 | ||||||||||
| CLM4 | [-] | 32.1 | 33.3 | 0.245 | 64.3 | 0.830 | -3.01 | 0.59 | 0.82 | 0.70 | ||
| CLM4.5 | [-] | 35.6 | 36.4 | 0.758 | 64.3 | 0.830 | -2.56 | 0.60 | 0.88 | 0.74 | ||
| CLM5 | [-] | 33.5 | 34.3 | 0.701 | 64.3 | 0.830 | -2.77 | 0.57 | 0.86 | 0.72 |
Download Data |
Period Mean (original grids) [Pg] |
Model Period Mean (intersection) [Pg] |
Model Period Mean (complement) [Pg] |
Benchmark Period Mean (intersection) [Pg] |
Benchmark Period Mean (complement) [Pg] |
Bias [kg m-2] |
Bias Score [1] |
Spatial Distribution Score [1] |
Overall Score [1] |
|||
|---|---|---|---|---|---|---|---|---|---|---|---|---|
| Benchmark | [-] | 151. | ||||||||||
| CLM4 | [-] | 76.8 | 77.7 | 0.414 | 148. | 3.09 | -4.32 | 0.63 | 0.50 | 0.57 | ||
| CLM4.5 | [-] | 90.4 | 91.2 | 0.807 | 148. | 3.09 | -3.24 | 0.65 | 0.70 | 0.68 | ||
| CLM5 | [-] | 105. | 105. | 0.973 | 148. | 3.09 | -2.32 | 0.67 | 0.68 | 0.68 |
Download Data |
Period Mean (original grids) [Pg] |
Model Period Mean (intersection) [Pg] |
Model Period Mean (complement) [Pg] |
Benchmark Period Mean (intersection) [Pg] |
Benchmark Period Mean (complement) [Pg] |
Bias [kg m-2] |
Bias Score [1] |
Spatial Distribution Score [1] |
Overall Score [1] |
|||
|---|---|---|---|---|---|---|---|---|---|---|---|---|
| Benchmark | [-] | 91.7 | ||||||||||
| CLM4 | [-] | 42.9 | 42.5 | 0.218 | 92.4 | 0.538 | -5.29 | 0.60 | 0.69 | 0.65 | ||
| CLM4.5 | [-] | 64.6 | 63.9 | 0.404 | 92.4 | 0.538 | -2.84 | 0.64 | 0.90 | 0.77 | ||
| CLM5 | [-] | 53.4 | 52.8 | 0.362 | 92.4 | 0.538 | -4.11 | 0.64 | 0.90 | 0.77 |
Temporally integrated period mean