Mean State
Download Data |
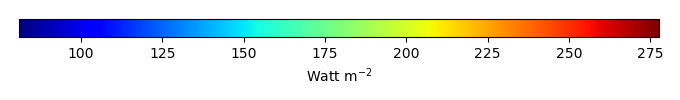
Period Mean (original grids) [Watt m-2] |
Model Period Mean (intersection) [Watt m-2] |
Model Period Mean (complement) [Watt m-2] |
Benchmark Period Mean (intersection) [Watt m-2] |
Benchmark Period Mean (complement) [Watt m-2] |
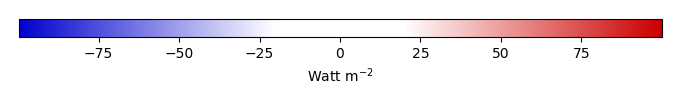
Bias [Watt m-2] |
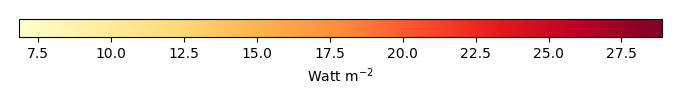
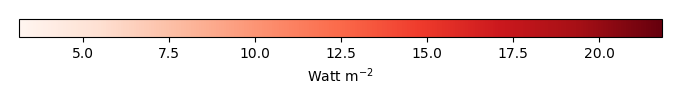
RMSE [Watt m-2] |
Phase Shift [months] |
Bias Score [1] |
RMSE Score [1] |
Seasonal Cycle Score [1] |
Spatial Distribution Score [1] |
Interannual Variability Score [1] |
Overall Score [1] |
|||
|---|---|---|---|---|---|---|---|---|---|---|---|---|---|---|---|---|---|
| Benchmark | [-] | 217. | |||||||||||||||
| CLM4 | [-] | 217. | 216. | 217. | 232. | 0.504 | 14.1 | 0.318 | 0.86 | 0.54 | 0.96 | 1.0 | 0.76 | 0.78 | |||
| CLM4.5 | [-] | 217. | 216. | 217. | 232. | 0.504 | 14.1 | 0.318 | 0.86 | 0.54 | 0.96 | 1.0 | 0.76 | 0.78 | |||
| CLM5 | [-] | 217. | 216. | 217. | 232. | 0.504 | 14.1 | 0.318 | 0.86 | 0.54 | 0.96 | 1.0 | 0.76 | 0.78 |
Download Data |
Period Mean (original grids) [Watt m-2] |
Model Period Mean (intersection) [Watt m-2] |
Model Period Mean (complement) [Watt m-2] |
Benchmark Period Mean (intersection) [Watt m-2] |
Benchmark Period Mean (complement) [Watt m-2] |
Bias [Watt m-2] |
RMSE [Watt m-2] |
Phase Shift [months] |
Bias Score [1] |
RMSE Score [1] |
Seasonal Cycle Score [1] |
Spatial Distribution Score [1] |
Interannual Variability Score [1] |
Overall Score [1] |
|||
|---|---|---|---|---|---|---|---|---|---|---|---|---|---|---|---|---|---|
| Benchmark | [-] | 241. | |||||||||||||||
| CLM4 | [-] | 240. | 241. | 241. | 238. | -0.171 | 13.3 | 0.143 | 0.90 | 0.61 | 0.99 | 1.0 | 0.82 | 0.82 | |||
| CLM4.5 | [-] | 240. | 241. | 241. | 238. | -0.171 | 13.3 | 0.143 | 0.90 | 0.61 | 0.99 | 1.0 | 0.82 | 0.82 | |||
| CLM5 | [-] | 240. | 241. | 241. | 238. | -0.171 | 13.3 | 0.143 | 0.90 | 0.61 | 0.99 | 1.0 | 0.82 | 0.82 |
Download Data |
Period Mean (original grids) [Watt m-2] |
Model Period Mean (intersection) [Watt m-2] |
Model Period Mean (complement) [Watt m-2] |
Benchmark Period Mean (intersection) [Watt m-2] |
Benchmark Period Mean (complement) [Watt m-2] |
Bias [Watt m-2] |
RMSE [Watt m-2] |
Phase Shift [months] |
Bias Score [1] |
RMSE Score [1] |
Seasonal Cycle Score [1] |
Spatial Distribution Score [1] |
Interannual Variability Score [1] |
Overall Score [1] |
|||
|---|---|---|---|---|---|---|---|---|---|---|---|---|---|---|---|---|---|
| Benchmark | [-] | 233. | |||||||||||||||
| CLM4 | [-] | 233. | 233. | 233. | 238. | 0.143 | 15.9 | 0.237 | 0.89 | 0.60 | 0.97 | 0.99 | 0.70 | 0.79 | |||
| CLM4.5 | [-] | 233. | 233. | 233. | 238. | 0.143 | 15.9 | 0.237 | 0.89 | 0.60 | 0.97 | 0.99 | 0.70 | 0.79 | |||
| CLM5 | [-] | 233. | 233. | 233. | 238. | 0.143 | 15.9 | 0.237 | 0.89 | 0.60 | 0.97 | 0.99 | 0.70 | 0.79 |
Download Data |
Period Mean (original grids) [Watt m-2] |
Model Period Mean (intersection) [Watt m-2] |
Model Period Mean (complement) [Watt m-2] |
Benchmark Period Mean (intersection) [Watt m-2] |
Benchmark Period Mean (complement) [Watt m-2] |
Bias [Watt m-2] |
RMSE [Watt m-2] |
Phase Shift [months] |
Bias Score [1] |
RMSE Score [1] |
Seasonal Cycle Score [1] |
Spatial Distribution Score [1] |
Interannual Variability Score [1] |
Overall Score [1] |
|||
|---|---|---|---|---|---|---|---|---|---|---|---|---|---|---|---|---|---|
| Benchmark | [-] | 111. | |||||||||||||||
| CLM4 | [-] | 107. | 107. | 111. | 117. | -3.90 | 12.6 | 0.0241 | 0.95 | 0.85 | 1.0 | 0.90 | 0.69 | 0.87 | |||
| CLM4.5 | [-] | 107. | 107. | 111. | 117. | -3.90 | 12.6 | 0.0241 | 0.95 | 0.85 | 1.0 | 0.90 | 0.69 | 0.87 | |||
| CLM5 | [-] | 107. | 107. | 111. | 117. | -3.90 | 12.6 | 0.0241 | 0.95 | 0.85 | 1.0 | 0.90 | 0.69 | 0.87 |
Download Data |
Period Mean (original grids) [Watt m-2] |
Model Period Mean (intersection) [Watt m-2] |
Model Period Mean (complement) [Watt m-2] |
Benchmark Period Mean (intersection) [Watt m-2] |
Benchmark Period Mean (complement) [Watt m-2] |
Bias [Watt m-2] |
RMSE [Watt m-2] |
Phase Shift [months] |
Bias Score [1] |
RMSE Score [1] |
Seasonal Cycle Score [1] |
Spatial Distribution Score [1] |
Interannual Variability Score [1] |
Overall Score [1] |
|||
|---|---|---|---|---|---|---|---|---|---|---|---|---|---|---|---|---|---|
| Benchmark | [-] | 213. | |||||||||||||||
| CLM4 | [-] | 205. | 205. | 209. | 225. | 0.417 | 17.6 | 0.524 | 0.79 | 0.46 | 0.92 | 0.99 | 0.77 | 0.73 | |||
| CLM4.5 | [-] | 205. | 205. | 209. | 225. | 0.417 | 17.6 | 0.524 | 0.79 | 0.46 | 0.92 | 0.99 | 0.77 | 0.73 | |||
| CLM5 | [-] | 205. | 205. | 209. | 225. | 0.417 | 17.6 | 0.524 | 0.79 | 0.46 | 0.92 | 0.99 | 0.77 | 0.73 |
Download Data |
Period Mean (original grids) [Watt m-2] |
Model Period Mean (intersection) [Watt m-2] |
Model Period Mean (complement) [Watt m-2] |
Benchmark Period Mean (intersection) [Watt m-2] |
Benchmark Period Mean (complement) [Watt m-2] |
Bias [Watt m-2] |
RMSE [Watt m-2] |
Phase Shift [months] |
Bias Score [1] |
RMSE Score [1] |
Seasonal Cycle Score [1] |
Spatial Distribution Score [1] |
Interannual Variability Score [1] |
Overall Score [1] |
|||
|---|---|---|---|---|---|---|---|---|---|---|---|---|---|---|---|---|---|
| Benchmark | [-] | 126. | |||||||||||||||
| CLM4 | [-] | 126. | 125. | 126. | 145. | 0.0721 | 11.8 | 0.0425 | 0.98 | 0.86 | 1.0 | 1.0 | 0.64 | 0.89 | |||
| CLM4.5 | [-] | 126. | 125. | 126. | 145. | 0.0721 | 11.8 | 0.0425 | 0.98 | 0.86 | 1.0 | 1.0 | 0.64 | 0.89 | |||
| CLM5 | [-] | 126. | 126. | 126. | 145. | 0.0721 | 11.8 | 0.0425 | 0.98 | 0.86 | 1.0 | 1.0 | 0.64 | 0.89 |
Download Data |
Period Mean (original grids) [Watt m-2] |
Model Period Mean (intersection) [Watt m-2] |
Model Period Mean (complement) [Watt m-2] |
Benchmark Period Mean (intersection) [Watt m-2] |
Benchmark Period Mean (complement) [Watt m-2] |
Bias [Watt m-2] |
RMSE [Watt m-2] |
Phase Shift [months] |
Bias Score [1] |
RMSE Score [1] |
Seasonal Cycle Score [1] |
Spatial Distribution Score [1] |
Interannual Variability Score [1] |
Overall Score [1] |
|||
|---|---|---|---|---|---|---|---|---|---|---|---|---|---|---|---|---|---|
| Benchmark | [-] | 170. | |||||||||||||||
| CLM4 | [-] | 171. | 171. | 170. | 169. | 0.441 | 14.1 | 0.129 | 0.95 | 0.79 | 0.99 | 1.0 | 0.62 | 0.85 | |||
| CLM4.5 | [-] | 171. | 171. | 170. | 169. | 0.441 | 14.1 | 0.129 | 0.95 | 0.79 | 0.99 | 1.0 | 0.62 | 0.85 | |||
| CLM5 | [-] | 171. | 171. | 170. | 169. | 0.441 | 14.1 | 0.129 | 0.95 | 0.79 | 0.99 | 1.0 | 0.62 | 0.85 |
Download Data |
Period Mean (original grids) [Watt m-2] |
Model Period Mean (intersection) [Watt m-2] |
Model Period Mean (complement) [Watt m-2] |
Benchmark Period Mean (intersection) [Watt m-2] |
Benchmark Period Mean (complement) [Watt m-2] |
Bias [Watt m-2] |
RMSE [Watt m-2] |
Phase Shift [months] |
Bias Score [1] |
RMSE Score [1] |
Seasonal Cycle Score [1] |
Spatial Distribution Score [1] |
Interannual Variability Score [1] |
Overall Score [1] |
|||
|---|---|---|---|---|---|---|---|---|---|---|---|---|---|---|---|---|---|
| Benchmark | [-] | 210. | |||||||||||||||
| CLM4 | [-] | 208. | 208. | 209. | 224. | 0.482 | 16.5 | 0.148 | 0.89 | 0.66 | 0.99 | 0.99 | 0.66 | 0.81 | |||
| CLM4.5 | [-] | 208. | 208. | 209. | 224. | 0.482 | 16.5 | 0.148 | 0.89 | 0.66 | 0.99 | 0.99 | 0.66 | 0.81 | |||
| CLM5 | [-] | 208. | 208. | 209. | 224. | 0.482 | 16.5 | 0.148 | 0.89 | 0.66 | 0.99 | 0.99 | 0.66 | 0.81 |
Download Data |
Period Mean (original grids) [Watt m-2] |
Model Period Mean (intersection) [Watt m-2] |
Model Period Mean (complement) [Watt m-2] |
Benchmark Period Mean (intersection) [Watt m-2] |
Benchmark Period Mean (complement) [Watt m-2] |
Bias [Watt m-2] |
RMSE [Watt m-2] |
Phase Shift [months] |
Bias Score [1] |
RMSE Score [1] |
Seasonal Cycle Score [1] |
Spatial Distribution Score [1] |
Interannual Variability Score [1] |
Overall Score [1] |
|||
|---|---|---|---|---|---|---|---|---|---|---|---|---|---|---|---|---|---|
| Benchmark | [-] | 105. | |||||||||||||||
| CLM4 | [-] | 96.3 | 96.5 | 105. | 108. | -8.76 | 12.5 | 0.0632 | 0.90 | 0.83 | 1.0 | 0.80 | 0.64 | 0.83 | |||
| CLM4.5 | [-] | 96.3 | 96.5 | 105. | 108. | -8.76 | 12.5 | 0.0632 | 0.90 | 0.83 | 1.0 | 0.80 | 0.64 | 0.83 | |||
| CLM5 | [-] | 96.3 | 96.5 | 105. | 108. | -8.76 | 12.5 | 0.0632 | 0.90 | 0.83 | 1.0 | 0.80 | 0.64 | 0.83 |
Download Data |
Period Mean (original grids) [Watt m-2] |
Model Period Mean (intersection) [Watt m-2] |
Model Period Mean (complement) [Watt m-2] |
Benchmark Period Mean (intersection) [Watt m-2] |
Benchmark Period Mean (complement) [Watt m-2] |
Bias [Watt m-2] |
RMSE [Watt m-2] |
Phase Shift [months] |
Bias Score [1] |
RMSE Score [1] |
Seasonal Cycle Score [1] |
Spatial Distribution Score [1] |
Interannual Variability Score [1] |
Overall Score [1] |
|||
|---|---|---|---|---|---|---|---|---|---|---|---|---|---|---|---|---|---|
| Benchmark | [-] | 228. | |||||||||||||||
| CLM4 | [-] | 232. | 232. | 229. | 216. | 0.0913 | 15.0 | 0.0879 | 0.95 | 0.76 | 0.99 | 1.0 | 0.68 | 0.86 | |||
| CLM4.5 | [-] | 232. | 232. | 229. | 216. | 0.0913 | 15.0 | 0.0879 | 0.95 | 0.76 | 0.99 | 1.0 | 0.68 | 0.86 | |||
| CLM5 | [-] | 232. | 232. | 229. | 216. | 0.0913 | 15.0 | 0.0879 | 0.95 | 0.76 | 0.99 | 1.0 | 0.68 | 0.86 |
Download Data |
Period Mean (original grids) [Watt m-2] |
Model Period Mean (intersection) [Watt m-2] |
Model Period Mean (complement) [Watt m-2] |
Benchmark Period Mean (intersection) [Watt m-2] |
Benchmark Period Mean (complement) [Watt m-2] |
Bias [Watt m-2] |
RMSE [Watt m-2] |
Phase Shift [months] |
Bias Score [1] |
RMSE Score [1] |
Seasonal Cycle Score [1] |
Spatial Distribution Score [1] |
Interannual Variability Score [1] |
Overall Score [1] |
|||
|---|---|---|---|---|---|---|---|---|---|---|---|---|---|---|---|---|---|
| Benchmark | [-] | 140. | |||||||||||||||
| CLM4 | [-] | 135. | 135. | 138. | 161. | 0.0454 | 13.3 | 0.0808 | 0.95 | 0.85 | 0.99 | 1.0 | 0.64 | 0.88 | |||
| CLM4.5 | [-] | 135. | 135. | 138. | 161. | 0.0454 | 13.3 | 0.0808 | 0.95 | 0.85 | 0.99 | 1.0 | 0.64 | 0.88 | |||
| CLM5 | [-] | 135. | 135. | 138. | 161. | 0.0454 | 13.3 | 0.0808 | 0.95 | 0.85 | 0.99 | 1.0 | 0.64 | 0.88 |
Download Data |
Period Mean (original grids) [Watt m-2] |
Model Period Mean (intersection) [Watt m-2] |
Model Period Mean (complement) [Watt m-2] |
Benchmark Period Mean (intersection) [Watt m-2] |
Benchmark Period Mean (complement) [Watt m-2] |
Bias [Watt m-2] |
RMSE [Watt m-2] |
Phase Shift [months] |
Bias Score [1] |
RMSE Score [1] |
Seasonal Cycle Score [1] |
Spatial Distribution Score [1] |
Interannual Variability Score [1] |
Overall Score [1] |
|||
|---|---|---|---|---|---|---|---|---|---|---|---|---|---|---|---|---|---|
| Benchmark | [-] | 191. | |||||||||||||||
| CLM4 | [-] | 182. | 182. | 186. | 193. | -4.43 | 14.4 | 0.132 | 0.91 | 0.73 | 0.99 | 0.99 | 0.66 | 0.83 | |||
| CLM4.5 | [-] | 182. | 182. | 186. | 193. | -4.43 | 14.4 | 0.132 | 0.91 | 0.73 | 0.99 | 0.99 | 0.66 | 0.83 | |||
| CLM5 | [-] | 182. | 182. | 186. | 193. | -4.43 | 14.4 | 0.132 | 0.91 | 0.73 | 0.99 | 0.99 | 0.66 | 0.83 |
Download Data |
Period Mean (original grids) [Watt m-2] |
Model Period Mean (intersection) [Watt m-2] |
Model Period Mean (complement) [Watt m-2] |
Benchmark Period Mean (intersection) [Watt m-2] |
Benchmark Period Mean (complement) [Watt m-2] |
Bias [Watt m-2] |
RMSE [Watt m-2] |
Phase Shift [months] |
Bias Score [1] |
RMSE Score [1] |
Seasonal Cycle Score [1] |
Spatial Distribution Score [1] |
Interannual Variability Score [1] |
Overall Score [1] |
|||
|---|---|---|---|---|---|---|---|---|---|---|---|---|---|---|---|---|---|
| Benchmark | [-] | 240. | |||||||||||||||
| CLM4 | [-] | 240. | 240. | 240. | 241. | -0.0717 | 13.2 | 0.119 | 0.94 | 0.79 | 0.99 | 1.0 | 0.62 | 0.86 | |||
| CLM4.5 | [-] | 240. | 240. | 240. | 241. | -0.0717 | 13.2 | 0.119 | 0.94 | 0.79 | 0.99 | 1.0 | 0.62 | 0.86 | |||
| CLM5 | [-] | 240. | 240. | 240. | 241. | -0.0717 | 13.2 | 0.119 | 0.94 | 0.79 | 0.99 | 1.0 | 0.62 | 0.86 |
Download Data |
Period Mean (original grids) [Watt m-2] |
Model Period Mean (intersection) [Watt m-2] |
Model Period Mean (complement) [Watt m-2] |
Benchmark Period Mean (intersection) [Watt m-2] |
Benchmark Period Mean (complement) [Watt m-2] |
Bias [Watt m-2] |
RMSE [Watt m-2] |
Phase Shift [months] |
Bias Score [1] |
RMSE Score [1] |
Seasonal Cycle Score [1] |
Spatial Distribution Score [1] |
Interannual Variability Score [1] |
Overall Score [1] |
|||
|---|---|---|---|---|---|---|---|---|---|---|---|---|---|---|---|---|---|
| Benchmark | [-] | 113. | |||||||||||||||
| CLM4 | [-] | 108. | 108. | 113. | 116. | -5.10 | 12.3 | 0.0429 | 0.94 | 0.85 | 1.0 | 0.85 | 0.72 | 0.86 | |||
| CLM4.5 | [-] | 108. | 108. | 113. | 116. | -5.10 | 12.3 | 0.0429 | 0.94 | 0.85 | 1.0 | 0.85 | 0.72 | 0.86 | |||
| CLM5 | [-] | 108. | 108. | 113. | 116. | -5.10 | 12.3 | 0.0429 | 0.94 | 0.85 | 1.0 | 0.85 | 0.72 | 0.86 |
Download Data |
Period Mean (original grids) [Watt m-2] |
Model Period Mean (intersection) [Watt m-2] |
Model Period Mean (complement) [Watt m-2] |
Benchmark Period Mean (intersection) [Watt m-2] |
Benchmark Period Mean (complement) [Watt m-2] |
Bias [Watt m-2] |
RMSE [Watt m-2] |
Phase Shift [months] |
Bias Score [1] |
RMSE Score [1] |
Seasonal Cycle Score [1] |
Spatial Distribution Score [1] |
Interannual Variability Score [1] |
Overall Score [1] |
|||
|---|---|---|---|---|---|---|---|---|---|---|---|---|---|---|---|---|---|
| Benchmark | [-] | 229. | |||||||||||||||
| CLM4 | [-] | 226. | 226. | 227. | 241. | 0.355 | 16.5 | 0.210 | 0.85 | 0.68 | 0.98 | 0.99 | 0.69 | 0.81 | |||
| CLM4.5 | [-] | 226. | 226. | 227. | 241. | 0.355 | 16.5 | 0.210 | 0.85 | 0.68 | 0.98 | 0.99 | 0.69 | 0.81 | |||
| CLM5 | [-] | 226. | 226. | 227. | 241. | 0.355 | 16.5 | 0.210 | 0.85 | 0.68 | 0.98 | 0.99 | 0.69 | 0.81 |
Download Data |
Period Mean (original grids) [Watt m-2] |
Model Period Mean (intersection) [Watt m-2] |
Model Period Mean (complement) [Watt m-2] |
Benchmark Period Mean (intersection) [Watt m-2] |
Benchmark Period Mean (complement) [Watt m-2] |
Bias [Watt m-2] |
RMSE [Watt m-2] |
Phase Shift [months] |
Bias Score [1] |
RMSE Score [1] |
Seasonal Cycle Score [1] |
Spatial Distribution Score [1] |
Interannual Variability Score [1] |
Overall Score [1] |
|||
|---|---|---|---|---|---|---|---|---|---|---|---|---|---|---|---|---|---|
| Benchmark | [-] | 173. | |||||||||||||||
| CLM4 | [-] | 171. | 171. | 172. | 207. | 0.686 | 13.8 | 0.0926 | 0.96 | 0.80 | 0.99 | 1.0 | 0.63 | 0.87 | |||
| CLM4.5 | [-] | 171. | 171. | 172. | 207. | 0.686 | 13.8 | 0.0926 | 0.96 | 0.80 | 0.99 | 1.0 | 0.63 | 0.87 | |||
| CLM5 | [-] | 171. | 171. | 172. | 207. | 0.686 | 13.8 | 0.0926 | 0.96 | 0.80 | 0.99 | 1.0 | 0.63 | 0.87 |
Download Data |
Period Mean (original grids) [Watt m-2] |
Model Period Mean (intersection) [Watt m-2] |
Model Period Mean (complement) [Watt m-2] |
Benchmark Period Mean (intersection) [Watt m-2] |
Benchmark Period Mean (complement) [Watt m-2] |
Bias [Watt m-2] |
RMSE [Watt m-2] |
Phase Shift [months] |
Bias Score [1] |
RMSE Score [1] |
Seasonal Cycle Score [1] |
Spatial Distribution Score [1] |
Interannual Variability Score [1] |
Overall Score [1] |
|||
|---|---|---|---|---|---|---|---|---|---|---|---|---|---|---|---|---|---|
| Benchmark | [-] | 135. | |||||||||||||||
| CLM4 | [-] | 135. | 135. | 135. | 133. | 0.0758 | 11.1 | 0.0540 | 0.98 | 0.86 | 1.0 | 1.0 | 0.65 | 0.89 | |||
| CLM4.5 | [-] | 135. | 135. | 135. | 133. | 0.0758 | 11.1 | 0.0540 | 0.98 | 0.86 | 1.0 | 1.0 | 0.65 | 0.89 | |||
| CLM5 | [-] | 135. | 135. | 135. | 133. | 0.0758 | 11.1 | 0.0540 | 0.98 | 0.86 | 1.0 | 1.0 | 0.65 | 0.89 |
Download Data |
Period Mean (original grids) [Watt m-2] |
Model Period Mean (intersection) [Watt m-2] |
Model Period Mean (complement) [Watt m-2] |
Benchmark Period Mean (intersection) [Watt m-2] |
Benchmark Period Mean (complement) [Watt m-2] |
Bias [Watt m-2] |
RMSE [Watt m-2] |
Phase Shift [months] |
Bias Score [1] |
RMSE Score [1] |
Seasonal Cycle Score [1] |
Spatial Distribution Score [1] |
Interannual Variability Score [1] |
Overall Score [1] |
|||
|---|---|---|---|---|---|---|---|---|---|---|---|---|---|---|---|---|---|
| Benchmark | [-] | 193. | |||||||||||||||
| CLM4 | [-] | 193. | 193. | 193. | 181. | -0.0247 | 13.4 | 0.0748 | 0.97 | 0.84 | 1.0 | 1.0 | 0.65 | 0.88 | |||
| CLM4.5 | [-] | 193. | 193. | 193. | 181. | -0.0247 | 13.4 | 0.0748 | 0.97 | 0.84 | 1.0 | 1.0 | 0.65 | 0.88 | |||
| CLM5 | [-] | 193. | 193. | 193. | 181. | -0.0247 | 13.4 | 0.0748 | 0.97 | 0.84 | 1.0 | 1.0 | 0.65 | 0.88 |
Download Data |
Period Mean (original grids) [Watt m-2] |
Model Period Mean (intersection) [Watt m-2] |
Model Period Mean (complement) [Watt m-2] |
Benchmark Period Mean (intersection) [Watt m-2] |
Benchmark Period Mean (complement) [Watt m-2] |
Bias [Watt m-2] |
RMSE [Watt m-2] |
Phase Shift [months] |
Bias Score [1] |
RMSE Score [1] |
Seasonal Cycle Score [1] |
Spatial Distribution Score [1] |
Interannual Variability Score [1] |
Overall Score [1] |
|||
|---|---|---|---|---|---|---|---|---|---|---|---|---|---|---|---|---|---|
| Benchmark | [-] | 202. | |||||||||||||||
| CLM4 | [-] | 201. | 201. | 201. | 241. | 0.303 | 15.0 | 0.334 | 0.86 | 0.50 | 0.96 | 0.99 | 0.75 | 0.76 | |||
| CLM4.5 | [-] | 201. | 201. | 201. | 241. | 0.303 | 15.0 | 0.334 | 0.86 | 0.50 | 0.96 | 0.99 | 0.75 | 0.76 | |||
| CLM5 | [-] | 201. | 201. | 201. | 241. | 0.303 | 15.0 | 0.334 | 0.86 | 0.50 | 0.96 | 0.99 | 0.75 | 0.76 |
Download Data |
Period Mean (original grids) [Watt m-2] |
Model Period Mean (intersection) [Watt m-2] |
Model Period Mean (complement) [Watt m-2] |
Benchmark Period Mean (intersection) [Watt m-2] |
Benchmark Period Mean (complement) [Watt m-2] |
Bias [Watt m-2] |
RMSE [Watt m-2] |
Phase Shift [months] |
Bias Score [1] |
RMSE Score [1] |
Seasonal Cycle Score [1] |
Spatial Distribution Score [1] |
Interannual Variability Score [1] |
Overall Score [1] |
|||
|---|---|---|---|---|---|---|---|---|---|---|---|---|---|---|---|---|---|
| Benchmark | [-] | 211. | |||||||||||||||
| CLM4 | [-] | 212. | 212. | 211. | 216. | 0.782 | 17.8 | 0.173 | 0.92 | 0.62 | 0.98 | 1.0 | 0.67 | 0.80 | |||
| CLM4.5 | [-] | 212. | 212. | 211. | 216. | 0.782 | 17.8 | 0.173 | 0.92 | 0.62 | 0.98 | 1.0 | 0.67 | 0.80 | |||
| CLM5 | [-] | 212. | 212. | 211. | 216. | 0.782 | 17.8 | 0.173 | 0.92 | 0.62 | 0.98 | 1.0 | 0.67 | 0.80 |
Download Data |
Period Mean (original grids) [Watt m-2] |
Model Period Mean (intersection) [Watt m-2] |
Model Period Mean (complement) [Watt m-2] |
Benchmark Period Mean (intersection) [Watt m-2] |
Benchmark Period Mean (complement) [Watt m-2] |
Bias [Watt m-2] |
RMSE [Watt m-2] |
Phase Shift [months] |
Bias Score [1] |
RMSE Score [1] |
Seasonal Cycle Score [1] |
Spatial Distribution Score [1] |
Interannual Variability Score [1] |
Overall Score [1] |
|||
|---|---|---|---|---|---|---|---|---|---|---|---|---|---|---|---|---|---|
| Benchmark | [-] | 204. | |||||||||||||||
| CLM4 | [-] | 210. | 208. | 205. | 190. | -0.797 | 19.6 | 0.252 | 0.88 | 0.73 | 0.97 | 1.0 | 0.64 | 0.82 | |||
| CLM4.5 | [-] | 210. | 208. | 205. | 190. | -0.797 | 19.6 | 0.252 | 0.88 | 0.73 | 0.97 | 1.0 | 0.64 | 0.82 | |||
| CLM5 | [-] | 210. | 208. | 205. | 190. | -0.797 | 19.6 | 0.252 | 0.88 | 0.73 | 0.97 | 1.0 | 0.64 | 0.82 |
Temporally integrated period mean