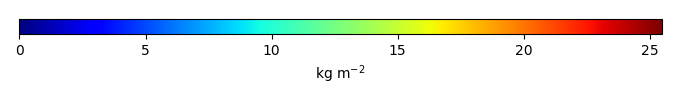
Mean State
Download Data |
Period Mean (original grids) [Pg] |
Model Period Mean (intersection) [Pg] |
Model Period Mean (complement) [Pg] |
Benchmark Period Mean (intersection) [Pg] |
Benchmark Period Mean (complement) [Pg] |
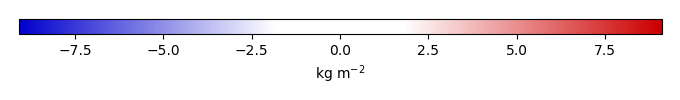
Bias [kg m-2] |
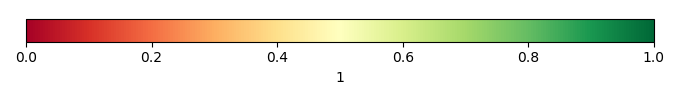
Bias Score [1] |
Spatial Distribution Score [1] |
Overall Score [1] |
|||
|---|---|---|---|---|---|---|---|---|---|---|---|---|
| Benchmark | [-] | 32.8 | ||||||||||
| CLM5PHSOFF | [-] | 47.2 | 46.4 | 0.899 | 32.8 | 0.0526 | 3.25 | 0.60 | 0.80 | 0.70 | ||
| CLM5PHSON | [-] | 38.5 | 38.7 | 0.241 | 32.8 | 0.0526 | 1.73 | 0.72 | 0.93 | 0.82 |
Download Data |
Period Mean (original grids) [Pg] |
Model Period Mean (intersection) [Pg] |
Model Period Mean (complement) [Pg] |
Benchmark Period Mean (intersection) [Pg] |
Benchmark Period Mean (complement) [Pg] |
Bias [kg m-2] |
Bias Score [1] |
Spatial Distribution Score [1] |
Overall Score [1] |
|||
|---|---|---|---|---|---|---|---|---|---|---|---|---|
| Benchmark | [-] | 8.35 | ||||||||||
| CLM5PHSOFF | [-] | 2.30 | 1.83 | 0.177 | 8.34 | 0.0114 | -1.14 | 0.43 | 0.54 | 0.49 | ||
| CLM5PHSON | [-] | 3.24 | 2.69 | 0.201 | 8.34 | 0.0114 | -0.977 | 0.48 | 0.62 | 0.55 |
Download Data |
Period Mean (original grids) [Pg] |
Model Period Mean (intersection) [Pg] |
Model Period Mean (complement) [Pg] |
Benchmark Period Mean (intersection) [Pg] |
Benchmark Period Mean (complement) [Pg] |
Bias [kg m-2] |
Bias Score [1] |
Spatial Distribution Score [1] |
Overall Score [1] |
|||
|---|---|---|---|---|---|---|---|---|---|---|---|---|
| Benchmark | [-] | 10.6 | ||||||||||
| CLM5PHSOFF | [-] | 10.4 | 8.62 | 1.31 | 10.6 | 0.0246 | -0.228 | 0.41 | 0.50 | 0.45 | ||
| CLM5PHSON | [-] | 12.3 | 11.7 | 0.363 | 10.6 | 0.0246 | 0.299 | 0.50 | 0.56 | 0.53 |
Download Data |
Period Mean (original grids) [Pg] |
Model Period Mean (intersection) [Pg] |
Model Period Mean (complement) [Pg] |
Benchmark Period Mean (intersection) [Pg] |
Benchmark Period Mean (complement) [Pg] |
Bias [kg m-2] |
Bias Score [1] |
Spatial Distribution Score [1] |
Overall Score [1] |
|||
|---|---|---|---|---|---|---|---|---|---|---|---|---|
| Benchmark | [-] | 4.69 | ||||||||||
| CLM5PHSOFF | [-] | 3.50 | 3.38 | 0.140 | 4.67 | 0.0241 | -0.393 | 0.55 | 0.66 | 0.60 | ||
| CLM5PHSON | [-] | 4.17 | 4.12 | 0.0636 | 4.67 | 0.0241 | -0.0436 | 0.58 | 0.80 | 0.69 |
Download Data |
Period Mean (original grids) [Pg] |
Model Period Mean (intersection) [Pg] |
Model Period Mean (complement) [Pg] |
Benchmark Period Mean (intersection) [Pg] |
Benchmark Period Mean (complement) [Pg] |
Bias [kg m-2] |
Bias Score [1] |
Spatial Distribution Score [1] |
Overall Score [1] |
|||
|---|---|---|---|---|---|---|---|---|---|---|---|---|
| Benchmark | [-] | 27.8 | ||||||||||
| CLM5PHSOFF | [-] | 78.2 | 68.2 | 7.85 | 26.8 | 0.921 | 11.6 | 0.46 | 0.89 | 0.67 | ||
| CLM5PHSON | [-] | 39.9 | 38.2 | 1.51 | 26.8 | 0.921 | 7.87 | 0.61 | 0.92 | 0.76 |
Download Data |
Period Mean (original grids) [Pg] |
Model Period Mean (intersection) [Pg] |
Model Period Mean (complement) [Pg] |
Benchmark Period Mean (intersection) [Pg] |
Benchmark Period Mean (complement) [Pg] |
Bias [kg m-2] |
Bias Score [1] |
Spatial Distribution Score [1] |
Overall Score [1] |
|||
|---|---|---|---|---|---|---|---|---|---|---|---|---|
| Benchmark | [-] | 43.5 | ||||||||||
| CLM5PHSOFF | [-] | 32.7 | 31.7 | 0.504 | 43.5 | 0.0288 | -1.30 | 0.45 | 0.61 | 0.53 | ||
| CLM5PHSON | [-] | 52.5 | 51.4 | 0.326 | 43.5 | 0.0288 | 1.03 | 0.49 | 0.63 | 0.56 |
Download Data |
Period Mean (original grids) [Pg] |
Model Period Mean (intersection) [Pg] |
Model Period Mean (complement) [Pg] |
Benchmark Period Mean (intersection) [Pg] |
Benchmark Period Mean (complement) [Pg] |
Bias [kg m-2] |
Bias Score [1] |
Spatial Distribution Score [1] |
Overall Score [1] |
|||
|---|---|---|---|---|---|---|---|---|---|---|---|---|
| Benchmark | [-] | 32.0 | ||||||||||
| CLM5PHSOFF | [-] | 27.8 | 25.6 | 2.06 | 31.9 | 0.0804 | -0.408 | 0.57 | 0.85 | 0.71 | ||
| CLM5PHSON | [-] | 31.6 | 31.8 | 0.632 | 31.9 | 0.0804 | 0.262 | 0.61 | 0.86 | 0.73 |
Download Data |
Period Mean (original grids) [Pg] |
Model Period Mean (intersection) [Pg] |
Model Period Mean (complement) [Pg] |
Benchmark Period Mean (intersection) [Pg] |
Benchmark Period Mean (complement) [Pg] |
Bias [kg m-2] |
Bias Score [1] |
Spatial Distribution Score [1] |
Overall Score [1] |
|||
|---|---|---|---|---|---|---|---|---|---|---|---|---|
| Benchmark | [-] | 21.1 | ||||||||||
| CLM5PHSOFF | [-] | 32.8 | 28.1 | 2.82 | 20.9 | 0.146 | 1.00 | 0.52 | 0.71 | 0.62 | ||
| CLM5PHSON | [-] | 24.8 | 23.3 | 0.610 | 20.9 | 0.146 | 1.28 | 0.60 | 0.82 | 0.71 |
Download Data |
Period Mean (original grids) [Pg] |
Model Period Mean (intersection) [Pg] |
Model Period Mean (complement) [Pg] |
Benchmark Period Mean (intersection) [Pg] |
Benchmark Period Mean (complement) [Pg] |
Bias [kg m-2] |
Bias Score [1] |
Spatial Distribution Score [1] |
Overall Score [1] |
|||
|---|---|---|---|---|---|---|---|---|---|---|---|---|
| Benchmark | [-] | 3.81 | ||||||||||
| CLM5PHSOFF | [-] | 5.61 | 5.80 | 0.158 | 3.81 | 0.000319 | 0.574 | 0.53 | 0.78 | 0.66 | ||
| CLM5PHSON | [-] | 6.88 | 7.17 | 0.0941 | 3.81 | 0.000319 | 1.03 | 0.51 | 0.75 | 0.63 |
Download Data |
Period Mean (original grids) [Pg] |
Model Period Mean (intersection) [Pg] |
Model Period Mean (complement) [Pg] |
Benchmark Period Mean (intersection) [Pg] |
Benchmark Period Mean (complement) [Pg] |
Bias [kg m-2] |
Bias Score [1] |
Spatial Distribution Score [1] |
Overall Score [1] |
|||
|---|---|---|---|---|---|---|---|---|---|---|---|---|
| Benchmark | [-] | 9.16 | ||||||||||
| CLM5PHSOFF | [-] | 18.3 | 14.3 | 3.29 | 8.87 | 0.289 | 0.648 | 0.59 | 0.78 | 0.68 | ||
| CLM5PHSON | [-] | 11.0 | 10.0 | 0.829 | 8.87 | 0.289 | 0.760 | 0.60 | 0.81 | 0.71 |
Download Data |
Period Mean (original grids) [Pg] |
Model Period Mean (intersection) [Pg] |
Model Period Mean (complement) [Pg] |
Benchmark Period Mean (intersection) [Pg] |
Benchmark Period Mean (complement) [Pg] |
Bias [kg m-2] |
Bias Score [1] |
Spatial Distribution Score [1] |
Overall Score [1] |
|||
|---|---|---|---|---|---|---|---|---|---|---|---|---|
| Benchmark | [-] | 12.0 | ||||||||||
| CLM5PHSOFF | [-] | 21.3 | 18.6 | 2.16 | 12.0 | 0.0529 | 1.14 | 0.42 | 0.35 | 0.39 | ||
| CLM5PHSON | [-] | 18.2 | 17.4 | 0.537 | 12.0 | 0.0529 | 1.77 | 0.47 | 0.35 | 0.41 |
Download Data |
Period Mean (original grids) [Pg] |
Model Period Mean (intersection) [Pg] |
Model Period Mean (complement) [Pg] |
Benchmark Period Mean (intersection) [Pg] |
Benchmark Period Mean (complement) [Pg] |
Bias [kg m-2] |
Bias Score [1] |
Spatial Distribution Score [1] |
Overall Score [1] |
|||
|---|---|---|---|---|---|---|---|---|---|---|---|---|
| Benchmark | [-] | 368. | ||||||||||
| CLM5PHSOFF | [-] | 542. | 500. | 43.1 | 363. | 4.64 | 1.09 | 0.50 | 0.70 | 0.60 | ||
| CLM5PHSON | [-] | 487. | 477. | 9.77 | 363. | 4.64 | 1.46 | 0.57 | 0.78 | 0.68 |
Download Data |
Period Mean (original grids) [Pg] |
Model Period Mean (intersection) [Pg] |
Model Period Mean (complement) [Pg] |
Benchmark Period Mean (intersection) [Pg] |
Benchmark Period Mean (complement) [Pg] |
Bias [kg m-2] |
Bias Score [1] |
Spatial Distribution Score [1] |
Overall Score [1] |
|||
|---|---|---|---|---|---|---|---|---|---|---|---|---|
| Benchmark | [-] | 1.24 | ||||||||||
| CLM5PHSOFF | [-] | 0.978 | 0.599 | 0.280 | 1.23 | 0.00783 | -0.137 | 0.42 | 0.66 | 0.54 | ||
| CLM5PHSON | [-] | 1.55 | 1.22 | 0.341 | 1.23 | 0.00783 | 0.0659 | 0.51 | 0.74 | 0.62 |
Download Data |
Period Mean (original grids) [Pg] |
Model Period Mean (intersection) [Pg] |
Model Period Mean (complement) [Pg] |
Benchmark Period Mean (intersection) [Pg] |
Benchmark Period Mean (complement) [Pg] |
Bias [kg m-2] |
Bias Score [1] |
Spatial Distribution Score [1] |
Overall Score [1] |
|||
|---|---|---|---|---|---|---|---|---|---|---|---|---|
| Benchmark | [-] | 5.62 | ||||||||||
| CLM5PHSOFF | [-] | 11.6 | 10.9 | 0.500 | 5.59 | 0.0265 | 0.893 | 0.45 | 0.48 | 0.46 | ||
| CLM5PHSON | [-] | 14.5 | 14.1 | 0.228 | 5.59 | 0.0265 | 1.60 | 0.34 | 0.40 | 0.37 |
Download Data |
Period Mean (original grids) [Pg] |
Model Period Mean (intersection) [Pg] |
Model Period Mean (complement) [Pg] |
Benchmark Period Mean (intersection) [Pg] |
Benchmark Period Mean (complement) [Pg] |
Bias [kg m-2] |
Bias Score [1] |
Spatial Distribution Score [1] |
Overall Score [1] |
|||
|---|---|---|---|---|---|---|---|---|---|---|---|---|
| Benchmark | [-] | 8.21 | ||||||||||
| CLM5PHSOFF | [-] | 16.3 | 13.8 | 1.71 | 8.09 | 0.122 | 1.71 | 0.46 | 0.48 | 0.47 | ||
| CLM5PHSON | [-] | 10.2 | 9.46 | 0.474 | 8.09 | 0.122 | 1.74 | 0.54 | 0.60 | 0.57 |
Download Data |
Period Mean (original grids) [Pg] |
Model Period Mean (intersection) [Pg] |
Model Period Mean (complement) [Pg] |
Benchmark Period Mean (intersection) [Pg] |
Benchmark Period Mean (complement) [Pg] |
Bias [kg m-2] |
Bias Score [1] |
Spatial Distribution Score [1] |
Overall Score [1] |
|||
|---|---|---|---|---|---|---|---|---|---|---|---|---|
| Benchmark | [-] | 14.8 | ||||||||||
| CLM5PHSOFF | [-] | 7.11 | 5.93 | 0.824 | 14.8 | 0.0147 | -2.14 | 0.50 | 0.77 | 0.63 | ||
| CLM5PHSON | [-] | 12.0 | 11.7 | 0.182 | 14.8 | 0.0147 | -0.425 | 0.65 | 0.87 | 0.76 |
Download Data |
Period Mean (original grids) [Pg] |
Model Period Mean (intersection) [Pg] |
Model Period Mean (complement) [Pg] |
Benchmark Period Mean (intersection) [Pg] |
Benchmark Period Mean (complement) [Pg] |
Bias [kg m-2] |
Bias Score [1] |
Spatial Distribution Score [1] |
Overall Score [1] |
|||
|---|---|---|---|---|---|---|---|---|---|---|---|---|
| Benchmark | [-] | 20.1 | ||||||||||
| CLM5PHSOFF | [-] | 32.6 | 31.8 | 0.793 | 19.8 | 0.219 | 2.14 | 0.45 | 0.65 | 0.55 | ||
| CLM5PHSON | [-] | 43.6 | 43.6 | 0.247 | 19.8 | 0.219 | 4.91 | 0.40 | 0.72 | 0.56 |
Download Data |
Period Mean (original grids) [Pg] |
Model Period Mean (intersection) [Pg] |
Model Period Mean (complement) [Pg] |
Benchmark Period Mean (intersection) [Pg] |
Benchmark Period Mean (complement) [Pg] |
Bias [kg m-2] |
Bias Score [1] |
Spatial Distribution Score [1] |
Overall Score [1] |
|||
|---|---|---|---|---|---|---|---|---|---|---|---|---|
| Benchmark | [-] | 8.04 | ||||||||||
| CLM5PHSOFF | [-] | 1.45 | 1.37 | 0.182 | 7.99 | 0.0515 | -1.66 | 0.41 | 0.25 | 0.33 | ||
| CLM5PHSON | [-] | 3.04 | 3.04 | 0.0352 | 7.99 | 0.0515 | -1.10 | 0.51 | 0.49 | 0.50 |
Download Data |
Period Mean (original grids) [Pg] |
Model Period Mean (intersection) [Pg] |
Model Period Mean (complement) [Pg] |
Benchmark Period Mean (intersection) [Pg] |
Benchmark Period Mean (complement) [Pg] |
Bias [kg m-2] |
Bias Score [1] |
Spatial Distribution Score [1] |
Overall Score [1] |
|||
|---|---|---|---|---|---|---|---|---|---|---|---|---|
| Benchmark | [-] | 88.9 | ||||||||||
| CLM5PHSOFF | [-] | 150. | 147. | 1.87 | 88.8 | 0.0655 | 6.82 | 0.53 | 0.78 | 0.66 | ||
| CLM5PHSON | [-] | 129. | 128. | 0.373 | 88.8 | 0.0655 | 5.00 | 0.65 | 0.94 | 0.80 |
Download Data |
Period Mean (original grids) [Pg] |
Model Period Mean (intersection) [Pg] |
Model Period Mean (complement) [Pg] |
Benchmark Period Mean (intersection) [Pg] |
Benchmark Period Mean (complement) [Pg] |
Bias [kg m-2] |
Bias Score [1] |
Spatial Distribution Score [1] |
Overall Score [1] |
|||
|---|---|---|---|---|---|---|---|---|---|---|---|---|
| Benchmark | [-] | 9.09 | ||||||||||
| CLM5PHSOFF | [-] | 20.5 | 19.6 | 1.02 | 9.08 | 0.0128 | 1.50 | 0.35 | 0.26 | 0.30 | ||
| CLM5PHSON | [-] | 21.8 | 21.8 | 0.283 | 9.08 | 0.0128 | 2.13 | 0.32 | 0.30 | 0.31 |
Download Data |
Period Mean (original grids) [Pg] |
Model Period Mean (intersection) [Pg] |
Model Period Mean (complement) [Pg] |
Benchmark Period Mean (intersection) [Pg] |
Benchmark Period Mean (complement) [Pg] |
Bias [kg m-2] |
Bias Score [1] |
Spatial Distribution Score [1] |
Overall Score [1] |
|||
|---|---|---|---|---|---|---|---|---|---|---|---|---|
| Benchmark | [-] | 2.45 | ||||||||||
| CLM5PHSOFF | [-] | 8.11 | 7.87 | 0.449 | 2.40 | 0.0496 | 1.82 | 0.37 | 0.27 | 0.32 | ||
| CLM5PHSON | [-] | 6.26 | 6.15 | 0.140 | 2.40 | 0.0496 | 1.92 | 0.35 | 0.32 | 0.34 |
Temporally integrated period mean