Mean State
Download Data |
Period Mean (original grids) [Pg] |
Model Period Mean (intersection) [Pg] |
Model Period Mean (complement) [Pg] |
Benchmark Period Mean (intersection) [Pg] |
Benchmark Period Mean (complement) [Pg] |
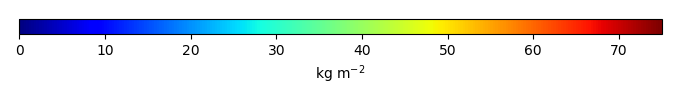
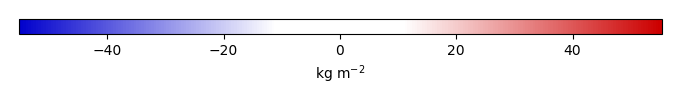
Bias [kg m-2] |
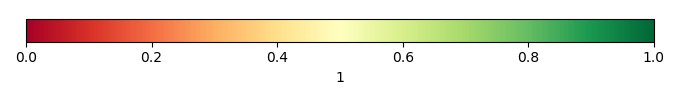
Bias Score [1] |
Spatial Distribution Score [1] |
Overall Score [1] |
|||
|---|---|---|---|---|---|---|---|---|---|---|---|---|
| Benchmark | [-] | 76.5 | ||||||||||
| CLM5PHSOFF | [-] | 66.9 | 55.6 | 11.8 | 76.1 | 0.362 | -7.37 | 0.57 | 0.58 | 0.58 | ||
| CLM5PHSON | [-] | 101. | 90.3 | 10.0 | 76.1 | 0.362 | 6.17 | 0.53 | 0.30 | 0.42 |
Download Data |
Period Mean (original grids) [Pg] |
Model Period Mean (intersection) [Pg] |
Model Period Mean (complement) [Pg] |
Benchmark Period Mean (intersection) [Pg] |
Benchmark Period Mean (complement) [Pg] |
Bias [kg m-2] |
Bias Score [1] |
Spatial Distribution Score [1] |
Overall Score [1] |
|||
|---|---|---|---|---|---|---|---|---|---|---|---|---|
| Benchmark | [-] | 113. | ||||||||||
| CLM5PHSOFF | [-] | 74.8 | 35.0 | 37.8 | 113. | 0.00185 | -16.4 | 0.50 | 0.53 | 0.52 | ||
| CLM5PHSON | [-] | 133. | 70.5 | 59.6 | 113. | 0.00185 | -9.00 | 0.56 | 0.83 | 0.69 |
Download Data |
Period Mean (original grids) [Pg] |
Model Period Mean (intersection) [Pg] |
Model Period Mean (complement) [Pg] |
Benchmark Period Mean (intersection) [Pg] |
Benchmark Period Mean (complement) [Pg] |
Bias [kg m-2] |
Bias Score [1] |
Spatial Distribution Score [1] |
Overall Score [1] |
|||
|---|---|---|---|---|---|---|---|---|---|---|---|---|
| Benchmark | [-] | 12.2 | ||||||||||
| CLM5PHSOFF | [-] | 63.0 | 2.73 | 61.5 | 12.2 | 0.00 | -9.64 | 0.47 | 0.63 | 0.55 | ||
| CLM5PHSON | [-] | 91.8 | 5.31 | 88.9 | 12.2 | 0.00 | -6.98 | 0.55 | 0.82 | 0.68 |
Download Data |
Period Mean (original grids) [Pg] |
Model Period Mean (intersection) [Pg] |
Model Period Mean (complement) [Pg] |
Benchmark Period Mean (intersection) [Pg] |
Benchmark Period Mean (complement) [Pg] |
Bias [kg m-2] |
Bias Score [1] |
Spatial Distribution Score [1] |
Overall Score [1] |
|||
|---|---|---|---|---|---|---|---|---|---|---|---|---|
| Benchmark | [-] | 97.3 | ||||||||||
| CLM5PHSOFF | [-] | 87.0 | 76.4 | 11.6 | 97.2 | 0.0996 | -6.59 | 0.61 | 0.73 | 0.67 | ||
| CLM5PHSON | [-] | 119. | 110. | 10.0 | 97.2 | 0.0996 | 4.55 | 0.54 | 0.39 | 0.47 |
Download Data |
Period Mean (original grids) [Pg] |
Model Period Mean (intersection) [Pg] |
Model Period Mean (complement) [Pg] |
Benchmark Period Mean (intersection) [Pg] |
Benchmark Period Mean (complement) [Pg] |
Bias [kg m-2] |
Bias Score [1] |
Spatial Distribution Score [1] |
Overall Score [1] |
|||
|---|---|---|---|---|---|---|---|---|---|---|---|---|
| Benchmark | [-] | 5.12 | ||||||||||
| CLM5PHSOFF | [-] | 39.5 | 3.01 | 35.6 | 5.12 | 0.00 | -7.97 | 0.61 | 0.64 | 0.63 | ||
| CLM5PHSON | [-] | 44.2 | 3.46 | 40.1 | 5.12 | 0.00 | -6.30 | 0.64 | 0.62 | 0.63 |
Download Data |
Period Mean (original grids) [Pg] |
Model Period Mean (intersection) [Pg] |
Model Period Mean (complement) [Pg] |
Benchmark Period Mean (intersection) [Pg] |
Benchmark Period Mean (complement) [Pg] |
Bias [kg m-2] |
Bias Score [1] |
Spatial Distribution Score [1] |
Overall Score [1] |
|||
|---|---|---|---|---|---|---|---|---|---|---|---|---|
| Benchmark | [-] | 475. | ||||||||||
| CLM5PHSOFF | [-] | 864. | 275. | 611. | 474. | 1.51 | -8.82 | 0.53 | 0.39 | 0.46 | ||
| CLM5PHSON | [-] | 1.06e+03 | 433. | 622. | 474. | 1.51 | -1.41 | 0.53 | 0.64 | 0.59 |
Download Data |
Period Mean (original grids) [Pg] |
Model Period Mean (intersection) [Pg] |
Model Period Mean (complement) [Pg] |
Benchmark Period Mean (intersection) [Pg] |
Benchmark Period Mean (complement) [Pg] |
Bias [kg m-2] |
Bias Score [1] |
Spatial Distribution Score [1] |
Overall Score [1] |
|||
|---|---|---|---|---|---|---|---|---|---|---|---|---|
| Benchmark | [-] | 116. | ||||||||||
| CLM5PHSOFF | [-] | 73.1 | 60.2 | 12.4 | 116. | 0.373 | -9.15 | 0.51 | 0.72 | 0.61 | ||
| CLM5PHSON | [-] | 123. | 115. | 7.60 | 116. | 0.373 | 0.749 | 0.49 | 0.62 | 0.56 |
Download Data |
Period Mean (original grids) [Pg] |
Model Period Mean (intersection) [Pg] |
Model Period Mean (complement) [Pg] |
Benchmark Period Mean (intersection) [Pg] |
Benchmark Period Mean (complement) [Pg] |
Bias [kg m-2] |
Bias Score [1] |
Spatial Distribution Score [1] |
Overall Score [1] |
|||
|---|---|---|---|---|---|---|---|---|---|---|---|---|
| Benchmark | [-] | 0.0131 | ||||||||||
| CLM5PHSOFF | [-] | 20.3 | 0.00162 | 19.6 | 0.0131 | 0.00 | -5.18 | 0.42 | 4.0e-22 | 0.21 | ||
| CLM5PHSON | [-] | 32.2 | 0.0178 | 31.5 | 0.0131 | 0.00 | 2.19 | 0.69 | 2.5e-23 | 0.35 |
Download Data |
Period Mean (original grids) [Pg] |
Model Period Mean (intersection) [Pg] |
Model Period Mean (complement) [Pg] |
Benchmark Period Mean (intersection) [Pg] |
Benchmark Period Mean (complement) [Pg] |
Bias [kg m-2] |
Bias Score [1] |
Spatial Distribution Score [1] |
Overall Score [1] |
|||
|---|---|---|---|---|---|---|---|---|---|---|---|---|
| Benchmark | [-] | 46.1 | ||||||||||
| CLM5PHSOFF | [-] | 45.7 | 21.6 | 24.5 | 46.1 | 0.00725 | -11.9 | 0.51 | 0.32 | 0.41 | ||
| CLM5PHSON | [-] | 75.2 | 36.0 | 39.5 | 46.1 | 0.00725 | -4.90 | 0.56 | 0.58 | 0.57 |
Download Data |
Period Mean (original grids) [Pg] |
Model Period Mean (intersection) [Pg] |
Model Period Mean (complement) [Pg] |
Benchmark Period Mean (intersection) [Pg] |
Benchmark Period Mean (complement) [Pg] |
Bias [kg m-2] |
Bias Score [1] |
Spatial Distribution Score [1] |
Overall Score [1] |
|||
|---|---|---|---|---|---|---|---|---|---|---|---|---|
| Benchmark | [-] | 0.232 | ||||||||||
| CLM5PHSOFF | [-] | 7.06 | 0.0855 | 7.54 | 0.232 | 0.00 | -3.26 | 0.44 | 0.48 | 0.46 | ||
| CLM5PHSON | [-] | 11.5 | 0.289 | 11.9 | 0.232 | 0.00 | 0.143 | 0.53 | 0.81 | 0.67 |
Temporally integrated period mean