Mean State
Download Data |
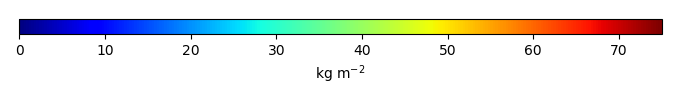
Period Mean (original grids) [Pg] |
Model Period Mean (intersection) [Pg] |
Model Period Mean (complement) [Pg] |
Benchmark Period Mean (intersection) [Pg] |
Benchmark Period Mean (complement) [Pg] |
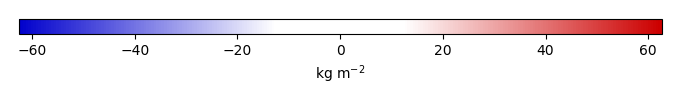
Bias [kg m-2] |
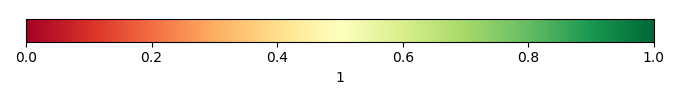
Bias Score [1] |
Spatial Distribution Score [1] |
Overall Score [1] |
|||
|---|---|---|---|---|---|---|---|---|---|---|---|---|
| Benchmark | [-] | 76.5 | ||||||||||
| CLM4 | [-] | 7.10 | 6.35 | 0.864 | 76.1 | 0.362 | -24.5 | 0.405 | 0.154 | 0.279 | ||
| CLM4.5 | [-] | 66.4 | 59.2 | 7.36 | 76.1 | 0.362 | -5.19 | 0.590 | 0.607 | 0.599 | ||
| CLM5 | [-] | 101. | 90.3 | 10.0 | 76.1 | 0.362 | 6.17 | 0.533 | 0.297 | 0.415 |
Download Data |
Period Mean (original grids) [Pg] |
Model Period Mean (intersection) [Pg] |
Model Period Mean (complement) [Pg] |
Benchmark Period Mean (intersection) [Pg] |
Benchmark Period Mean (complement) [Pg] |
Bias [kg m-2] |
Bias Score [1] |
Spatial Distribution Score [1] |
Overall Score [1] |
|||
|---|---|---|---|---|---|---|---|---|---|---|---|---|
| Benchmark | [-] | 113. | ||||||||||
| CLM4 | [-] | 62.4 | 38.4 | 22.5 | 113. | 0.00185 | -15.6 | 0.522 | 0.227 | 0.375 | ||
| CLM4.5 | [-] | 111. | 59.7 | 48.5 | 113. | 0.00185 | -11.2 | 0.574 | 0.673 | 0.624 | ||
| CLM5 | [-] | 133. | 70.5 | 59.6 | 113. | 0.00185 | -9.00 | 0.560 | 0.825 | 0.693 |
Download Data |
Period Mean (original grids) [Pg] |
Model Period Mean (intersection) [Pg] |
Model Period Mean (complement) [Pg] |
Benchmark Period Mean (intersection) [Pg] |
Benchmark Period Mean (complement) [Pg] |
Bias [kg m-2] |
Bias Score [1] |
Spatial Distribution Score [1] |
Overall Score [1] |
|||
|---|---|---|---|---|---|---|---|---|---|---|---|---|
| Benchmark | [-] | 12.2 | ||||||||||
| CLM4 | [-] | 67.8 | 3.17 | 66.2 | 12.2 | -9.21 | 0.485 | 0.710 | 0.597 | |||
| CLM4.5 | [-] | 96.4 | 4.96 | 93.3 | 12.2 | -7.28 | 0.563 | 0.833 | 0.698 | |||
| CLM5 | [-] | 91.8 | 5.31 | 88.9 | 12.2 | -6.98 | 0.546 | 0.822 | 0.684 |
Download Data |
Period Mean (original grids) [Pg] |
Model Period Mean (intersection) [Pg] |
Model Period Mean (complement) [Pg] |
Benchmark Period Mean (intersection) [Pg] |
Benchmark Period Mean (complement) [Pg] |
Bias [kg m-2] |
Bias Score [1] |
Spatial Distribution Score [1] |
Overall Score [1] |
|||
|---|---|---|---|---|---|---|---|---|---|---|---|---|
| Benchmark | [-] | 97.3 | ||||||||||
| CLM4 | [-] | 4.45 | 4.30 | 0.467 | 97.2 | 0.0996 | -29.4 | 0.386 | 0.0744 | 0.230 | ||
| CLM4.5 | [-] | 66.3 | 60.0 | 7.26 | 97.2 | 0.0996 | -11.7 | 0.590 | 0.776 | 0.683 | ||
| CLM5 | [-] | 119. | 110. | 10.0 | 97.2 | 0.0996 | 4.55 | 0.545 | 0.395 | 0.470 |
Download Data |
Period Mean (original grids) [Pg] |
Model Period Mean (intersection) [Pg] |
Model Period Mean (complement) [Pg] |
Benchmark Period Mean (intersection) [Pg] |
Benchmark Period Mean (complement) [Pg] |
Bias [kg m-2] |
Bias Score [1] |
Spatial Distribution Score [1] |
Overall Score [1] |
|||
|---|---|---|---|---|---|---|---|---|---|---|---|---|
| Benchmark | [-] | 5.12 | ||||||||||
| CLM4 | [-] | 19.0 | 0.446 | 18.4 | 5.12 | -17.3 | 0.401 | 0.0492 | 0.225 | |||
| CLM4.5 | [-] | 47.1 | 2.27 | 44.3 | 5.12 | -10.6 | 0.535 | 0.314 | 0.424 | |||
| CLM5 | [-] | 44.2 | 3.46 | 40.1 | 5.12 | -6.30 | 0.638 | 0.616 | 0.627 |
Download Data |
Period Mean (original grids) [Pg] |
Model Period Mean (intersection) [Pg] |
Model Period Mean (complement) [Pg] |
Benchmark Period Mean (intersection) [Pg] |
Benchmark Period Mean (complement) [Pg] |
Bias [kg m-2] |
Bias Score [1] |
Spatial Distribution Score [1] |
Overall Score [1] |
|||
|---|---|---|---|---|---|---|---|---|---|---|---|---|
| Benchmark | [-] | 475. | ||||||||||
| CLM4 | [-] | 500. | 79.0 | 421. | 474. | 1.51 | -17.4 | 0.441 | 0.149 | 0.295 | ||
| CLM4.5 | [-] | 984. | 277. | 706. | 474. | 1.51 | -8.45 | 0.558 | 0.822 | 0.690 | ||
| CLM5 | [-] | 1.06e+03 | 433. | 622. | 474. | 1.51 | -1.41 | 0.534 | 0.642 | 0.588 |
Download Data |
Period Mean (original grids) [Pg] |
Model Period Mean (intersection) [Pg] |
Model Period Mean (complement) [Pg] |
Benchmark Period Mean (intersection) [Pg] |
Benchmark Period Mean (complement) [Pg] |
Bias [kg m-2] |
Bias Score [1] |
Spatial Distribution Score [1] |
Overall Score [1] |
|||
|---|---|---|---|---|---|---|---|---|---|---|---|---|
| Benchmark | [-] | 116. | ||||||||||
| CLM4 | [-] | 15.0 | 14.1 | 0.859 | 116. | 0.373 | -16.7 | 0.418 | 0.0745 | 0.246 | ||
| CLM4.5 | [-] | 69.6 | 64.7 | 4.56 | 116. | 0.373 | -7.86 | 0.514 | 0.716 | 0.615 | ||
| CLM5 | [-] | 123. | 115. | 7.60 | 116. | 0.373 | 0.749 | 0.492 | 0.623 | 0.557 |
Download Data |
Period Mean (original grids) [Pg] |
Model Period Mean (intersection) [Pg] |
Model Period Mean (complement) [Pg] |
Benchmark Period Mean (intersection) [Pg] |
Benchmark Period Mean (complement) [Pg] |
Bias [kg m-2] |
Bias Score [1] |
Spatial Distribution Score [1] |
Overall Score [1] |
|||
|---|---|---|---|---|---|---|---|---|---|---|---|---|
| Benchmark | [-] | 0.0131 | ||||||||||
| CLM4 | [-] | 27.3 | 0.0156 | 26.9 | 0.0131 | 1.12 | 0.827 | 3.36e-22 | 0.414 | |||
| CLM4.5 | [-] | 40.5 | 0.0331 | 39.8 | 0.0131 | 9.10 | 0.214 | 9.22e-23 | 0.107 | |||
| CLM5 | [-] | 32.2 | 0.0178 | 31.5 | 0.0131 | 2.19 | 0.692 | 2.46e-23 | 0.346 |
Download Data |
Period Mean (original grids) [Pg] |
Model Period Mean (intersection) [Pg] |
Model Period Mean (complement) [Pg] |
Benchmark Period Mean (intersection) [Pg] |
Benchmark Period Mean (complement) [Pg] |
Bias [kg m-2] |
Bias Score [1] |
Spatial Distribution Score [1] |
Overall Score [1] |
|||
|---|---|---|---|---|---|---|---|---|---|---|---|---|
| Benchmark | [-] | 46.1 | ||||||||||
| CLM4 | [-] | 29.3 | 12.0 | 17.4 | 46.1 | 0.00725 | -16.5 | 0.475 | 0.0997 | 0.287 | ||
| CLM4.5 | [-] | 58.2 | 24.9 | 33.8 | 46.1 | 0.00725 | -10.3 | 0.541 | 0.260 | 0.400 | ||
| CLM5 | [-] | 75.2 | 36.0 | 39.5 | 46.1 | 0.00725 | -4.90 | 0.560 | 0.579 | 0.570 |
Download Data |
Period Mean (original grids) [Pg] |
Model Period Mean (intersection) [Pg] |
Model Period Mean (complement) [Pg] |
Benchmark Period Mean (intersection) [Pg] |
Benchmark Period Mean (complement) [Pg] |
Bias [kg m-2] |
Bias Score [1] |
Spatial Distribution Score [1] |
Overall Score [1] |
|||
|---|---|---|---|---|---|---|---|---|---|---|---|---|
| Benchmark | [-] | 0.232 | ||||||||||
| CLM4 | [-] | 10.4 | 0.246 | 10.5 | 0.232 | -0.0563 | 0.522 | 0.365 | 0.443 | |||
| CLM4.5 | [-] | 13.2 | 0.260 | 13.6 | 0.232 | 0.211 | 0.517 | 0.628 | 0.572 | |||
| CLM5 | [-] | 11.5 | 0.289 | 11.9 | 0.232 | 0.143 | 0.533 | 0.808 | 0.671 |
Temporally integrated period mean