Mean State
Download Data |
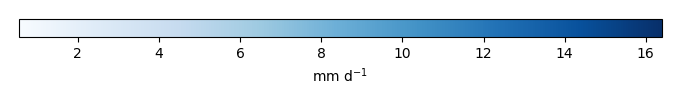
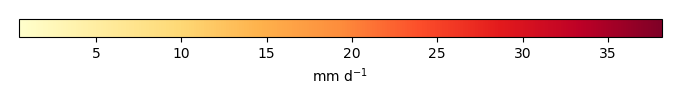
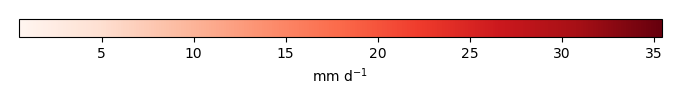
Period Mean (original grids) [mm d-1] |
Bias [mm d-1] |
RMSE [mm d-1] |
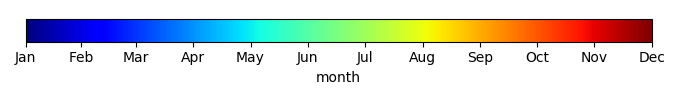
Phase Shift [months] |
Bias Score [1] |
RMSE Score [1] |
Seasonal Cycle Score [1] |
Interannual Variability Score [1] |
Overall Score [1] |
|||
|---|---|---|---|---|---|---|---|---|---|---|---|---|
| Benchmark | [-] | 0.000892 | ||||||||||
| CLM4 | [-] | 0.00178 | 0.000891 | 0.00107 | 0.983 | 0.494 | 0.380 | 0.937 | 0.446 | 0.527 | ||
| CLM4.5 | [-] | 0.00178 | 0.000891 | 0.00107 | 0.983 | 0.494 | 0.380 | 0.937 | 0.446 | 0.527 | ||
| CLM5 | [-] | 0.00178 | 0.000891 | 0.00107 | 0.983 | 0.494 | 0.380 | 0.937 | 0.446 | 0.527 |
Download Data |
Period Mean (original grids) [mm d-1] |
Bias [mm d-1] |
RMSE [mm d-1] |
Phase Shift [months] |
Bias Score [1] |
RMSE Score [1] |
Seasonal Cycle Score [1] |
Interannual Variability Score [1] |
Overall Score [1] |
|||
|---|---|---|---|---|---|---|---|---|---|---|---|---|
| Benchmark | [-] | 0.000513 | ||||||||||
| CLM4 | [-] | 0.000759 | 0.000247 | 0.000580 | 0.00 | 0.567 | 0.310 | 1.00 | 0.854 | 0.608 | ||
| CLM4.5 | [-] | 0.000759 | 0.000247 | 0.000580 | 0.00 | 0.567 | 0.310 | 1.00 | 0.854 | 0.608 | ||
| CLM5 | [-] | 0.000759 | 0.000247 | 0.000580 | 0.00 | 0.567 | 0.310 | 1.00 | 0.854 | 0.608 |
Download Data |
Period Mean (original grids) [mm d-1] |
Bias [mm d-1] |
RMSE [mm d-1] |
Phase Shift [months] |
Bias Score [1] |
RMSE Score [1] |
Seasonal Cycle Score [1] |
Interannual Variability Score [1] |
Overall Score [1] |
|||
|---|---|---|---|---|---|---|---|---|---|---|---|---|
| Benchmark | [-] | 0.00569 | ||||||||||
| CLM4 | [-] | 0.0109 | 0.00525 | 0.00712 | 1.03 | 0.275 | 0.358 | 0.930 | 0.903 | 0.565 | ||
| CLM4.5 | [-] | 0.0109 | 0.00525 | 0.00712 | 1.03 | 0.275 | 0.358 | 0.930 | 0.903 | 0.565 | ||
| CLM5 | [-] | 0.0109 | 0.00525 | 0.00712 | 1.03 | 0.275 | 0.358 | 0.930 | 0.903 | 0.565 |
Download Data |
Period Mean (original grids) [mm d-1] |
Bias [mm d-1] |
RMSE [mm d-1] |
Phase Shift [months] |
Bias Score [1] |
RMSE Score [1] |
Seasonal Cycle Score [1] |
Interannual Variability Score [1] |
Overall Score [1] |
|||
|---|---|---|---|---|---|---|---|---|---|---|---|---|
| Benchmark | [-] | 0.00102 | ||||||||||
| CLM4 | [-] | 0.00141 | 0.000382 | 0.00113 | 1.02 | 0.767 | 0.393 | 0.933 | 0.854 | 0.668 | ||
| CLM4.5 | [-] | 0.00141 | 0.000382 | 0.00113 | 1.02 | 0.767 | 0.393 | 0.933 | 0.854 | 0.668 | ||
| CLM5 | [-] | 0.00141 | 0.000382 | 0.00113 | 1.02 | 0.767 | 0.393 | 0.933 | 0.854 | 0.668 |
Download Data |
Period Mean (original grids) [mm d-1] |
Bias [mm d-1] |
RMSE [mm d-1] |
Phase Shift [months] |
Bias Score [1] |
RMSE Score [1] |
Seasonal Cycle Score [1] |
Interannual Variability Score [1] |
Overall Score [1] |
|||
|---|---|---|---|---|---|---|---|---|---|---|---|---|
| Benchmark | [-] | 0.00411 | ||||||||||
| CLM4 | [-] | 0.00344 | -0.000667 | 0.00227 | 1.53 | 0.824 | 0.622 | 0.781 | 0.755 | 0.721 | ||
| CLM4.5 | [-] | 0.00344 | -0.000667 | 0.00227 | 1.53 | 0.824 | 0.622 | 0.781 | 0.755 | 0.721 | ||
| CLM5 | [-] | 0.00344 | -0.000667 | 0.00227 | 1.53 | 0.824 | 0.622 | 0.781 | 0.755 | 0.721 |
Download Data |
Period Mean (original grids) [mm d-1] |
Bias [mm d-1] |
RMSE [mm d-1] |
Phase Shift [months] |
Bias Score [1] |
RMSE Score [1] |
Seasonal Cycle Score [1] |
Interannual Variability Score [1] |
Overall Score [1] |
|||
|---|---|---|---|---|---|---|---|---|---|---|---|---|
| Benchmark | [-] | 0.00424 | ||||||||||
| CLM4 | [-] | 0.00232 | -0.00191 | 0.00553 | 1.67 | 0.685 | 0.442 | 0.817 | 0.586 | 0.594 | ||
| CLM4.5 | [-] | 0.00232 | -0.00191 | 0.00553 | 1.67 | 0.685 | 0.442 | 0.817 | 0.586 | 0.594 | ||
| CLM5 | [-] | 0.00232 | -0.00191 | 0.00553 | 1.67 | 0.685 | 0.442 | 0.817 | 0.586 | 0.594 |
Download Data |
Period Mean (original grids) [mm d-1] |
Bias [mm d-1] |
RMSE [mm d-1] |
Phase Shift [months] |
Bias Score [1] |
RMSE Score [1] |
Seasonal Cycle Score [1] |
Interannual Variability Score [1] |
Overall Score [1] |
|||
|---|---|---|---|---|---|---|---|---|---|---|---|---|
| Benchmark | [-] | 0.00308 | ||||||||||
| CLM4 | [-] | 0.00242 | -0.000659 | 0.00354 | 1.43 | 0.692 | 0.455 | 0.826 | 0.646 | 0.615 | ||
| CLM4.5 | [-] | 0.00242 | -0.000659 | 0.00354 | 1.43 | 0.692 | 0.455 | 0.826 | 0.646 | 0.615 | ||
| CLM5 | [-] | 0.00242 | -0.000659 | 0.00354 | 1.43 | 0.692 | 0.455 | 0.826 | 0.646 | 0.615 |
Download Data |
Period Mean (original grids) [mm d-1] |
Bias [mm d-1] |
RMSE [mm d-1] |
Phase Shift [months] |
Bias Score [1] |
RMSE Score [1] |
Seasonal Cycle Score [1] |
Interannual Variability Score [1] |
Overall Score [1] |
|||
|---|---|---|---|---|---|---|---|---|---|---|---|---|
| Benchmark | [-] | 0.000883 | ||||||||||
| CLM4 | [-] | 0.00117 | 0.000289 | 0.000956 | 1.03 | 0.803 | 0.538 | 0.930 | 0.714 | 0.705 | ||
| CLM4.5 | [-] | 0.00117 | 0.000289 | 0.000956 | 1.03 | 0.803 | 0.538 | 0.930 | 0.714 | 0.705 | ||
| CLM5 | [-] | 0.00117 | 0.000289 | 0.000956 | 1.03 | 0.803 | 0.538 | 0.930 | 0.714 | 0.705 |
Download Data |
Period Mean (original grids) [mm d-1] |
Bias [mm d-1] |
RMSE [mm d-1] |
Phase Shift [months] |
Bias Score [1] |
RMSE Score [1] |
Seasonal Cycle Score [1] |
Interannual Variability Score [1] |
Overall Score [1] |
|||
|---|---|---|---|---|---|---|---|---|---|---|---|---|
| Benchmark | [-] | 0.00229 | ||||||||||
| CLM4 | [-] | 0.00295 | 0.000629 | 0.00160 | 1.22 | 0.738 | 0.491 | 0.858 | 0.840 | 0.683 | ||
| CLM4.5 | [-] | 0.00295 | 0.000629 | 0.00160 | 1.22 | 0.738 | 0.491 | 0.858 | 0.840 | 0.683 | ||
| CLM5 | [-] | 0.00295 | 0.000629 | 0.00160 | 1.22 | 0.738 | 0.491 | 0.858 | 0.840 | 0.683 |
Download Data |
Period Mean (original grids) [mm d-1] |
Bias [mm d-1] |
RMSE [mm d-1] |
Phase Shift [months] |
Bias Score [1] |
RMSE Score [1] |
Seasonal Cycle Score [1] |
Interannual Variability Score [1] |
Overall Score [1] |
|||
|---|---|---|---|---|---|---|---|---|---|---|---|---|
| Benchmark | [-] | 0.00124 | ||||||||||
| CLM4 | [-] | 0.00175 | 0.000515 | 0.00125 | 1.39 | 0.747 | 0.440 | 0.792 | 0.683 | 0.621 | ||
| CLM4.5 | [-] | 0.00175 | 0.000515 | 0.00125 | 1.39 | 0.747 | 0.440 | 0.792 | 0.683 | 0.621 | ||
| CLM5 | [-] | 0.00175 | 0.000515 | 0.00125 | 1.39 | 0.747 | 0.440 | 0.792 | 0.683 | 0.621 |
Download Data |
Period Mean (original grids) [mm d-1] |
Bias [mm d-1] |
RMSE [mm d-1] |
Phase Shift [months] |
Bias Score [1] |
RMSE Score [1] |
Seasonal Cycle Score [1] |
Interannual Variability Score [1] |
Overall Score [1] |
|||
|---|---|---|---|---|---|---|---|---|---|---|---|---|
| Benchmark | [-] | 0.00165 | ||||||||||
| CLM4 | [-] | 0.00146 | -0.000197 | 0.000987 | 0.172 | 0.905 | 0.626 | 0.993 | 0.879 | 0.806 | ||
| CLM4.5 | [-] | 0.00146 | -0.000197 | 0.000987 | 0.172 | 0.905 | 0.626 | 0.993 | 0.879 | 0.806 | ||
| CLM5 | [-] | 0.00146 | -0.000197 | 0.000987 | 0.172 | 0.905 | 0.626 | 0.993 | 0.879 | 0.806 |
Download Data |
Period Mean (original grids) [mm d-1] |
Bias [mm d-1] |
RMSE [mm d-1] |
Phase Shift [months] |
Bias Score [1] |
RMSE Score [1] |
Seasonal Cycle Score [1] |
Interannual Variability Score [1] |
Overall Score [1] |
|||
|---|---|---|---|---|---|---|---|---|---|---|---|---|
| Benchmark | [-] | 0.00319 | ||||||||||
| CLM4 | [-] | 0.00495 | 0.00176 | 0.00279 | 1.02 | 0.439 | 0.320 | 0.933 | 0.419 | 0.486 | ||
| CLM4.5 | [-] | 0.00495 | 0.00176 | 0.00279 | 1.02 | 0.439 | 0.320 | 0.933 | 0.419 | 0.486 | ||
| CLM5 | [-] | 0.00495 | 0.00176 | 0.00279 | 1.02 | 0.439 | 0.320 | 0.933 | 0.419 | 0.486 |
Temporally integrated period mean