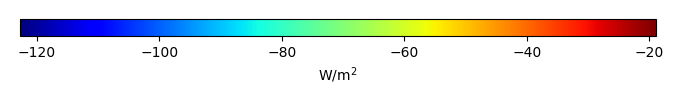
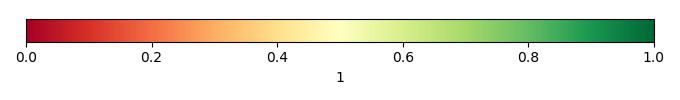
Mean State
Download Data |
Period Mean (original grids) [W/m2] |
Model Period Mean (intersection) [W/m2] |
Model Period Mean (complement) [W/m2] |
Benchmark Period Mean (intersection) [W/m2] |
Benchmark Period Mean (complement) [W/m2] |
Bias [W/m2] |
RMSE [W/m2] |
Phase Shift [months] |
Bias Score [1] |
RMSE Score [1] |
Seasonal Cycle Score [1] |
Spatial Distribution Score [1] |
Interannual Variability Score [1] |
Overall Score [1] |
|||
|---|---|---|---|---|---|---|---|---|---|---|---|---|---|---|---|---|---|
| Benchmark | [-] | -56.1 | |||||||||||||||
| CLM4 | [-] | -60.5 | -60.2 | -56.5 | -49.8 | -3.76 | 14.5 | 1.88 | 0.562 | 0.419 | 0.728 | 0.956 | 0.732 | 0.636 | |||
| CLM4.5 | [-] | -64.4 | -64.5 | -56.5 | -49.8 | -7.77 | 16.3 | 1.80 | 0.510 | 0.414 | 0.739 | 0.958 | 0.748 | 0.630 | |||
| CLM5 | [-] | -65.8 | -65.8 | -56.5 | -49.8 | -9.20 | 16.5 | 1.82 | 0.506 | 0.413 | 0.738 | 0.979 | 0.735 | 0.631 |
Download Data |
Period Mean (original grids) [W/m2] |
Model Period Mean (intersection) [W/m2] |
Model Period Mean (complement) [W/m2] |
Benchmark Period Mean (intersection) [W/m2] |
Benchmark Period Mean (complement) [W/m2] |
Bias [W/m2] |
RMSE [W/m2] |
Phase Shift [months] |
Bias Score [1] |
RMSE Score [1] |
Seasonal Cycle Score [1] |
Spatial Distribution Score [1] |
Interannual Variability Score [1] |
Overall Score [1] |
|||
|---|---|---|---|---|---|---|---|---|---|---|---|---|---|---|---|---|---|
| Benchmark | [-] | -75.5 | |||||||||||||||
| CLM4 | [-] | -90.3 | -91.1 | -75.8 | -54.3 | -15.0 | 22.2 | 0.346 | 0.584 | 0.567 | 0.968 | 0.997 | 0.719 | 0.733 | |||
| CLM4.5 | [-] | -95.7 | -96.4 | -75.8 | -54.3 | -20.2 | 25.7 | 0.368 | 0.488 | 0.572 | 0.965 | 0.914 | 0.731 | 0.707 | |||
| CLM5 | [-] | -97.5 | -98.2 | -75.8 | -54.3 | -22.0 | 27.2 | 0.353 | 0.457 | 0.567 | 0.965 | 0.952 | 0.702 | 0.702 |
Download Data |
Period Mean (original grids) [W/m2] |
Model Period Mean (intersection) [W/m2] |
Model Period Mean (complement) [W/m2] |
Benchmark Period Mean (intersection) [W/m2] |
Benchmark Period Mean (complement) [W/m2] |
Bias [W/m2] |
RMSE [W/m2] |
Phase Shift [months] |
Bias Score [1] |
RMSE Score [1] |
Seasonal Cycle Score [1] |
Spatial Distribution Score [1] |
Interannual Variability Score [1] |
Overall Score [1] |
|||
|---|---|---|---|---|---|---|---|---|---|---|---|---|---|---|---|---|---|
| Benchmark | [-] | -76.3 | |||||||||||||||
| CLM4 | [-] | -85.6 | -85.7 | -77.0 | -61.8 | -7.14 | 17.9 | 1.04 | 0.624 | 0.514 | 0.873 | 0.989 | 0.778 | 0.715 | |||
| CLM4.5 | [-] | -91.8 | -91.9 | -77.0 | -61.8 | -12.7 | 21.0 | 1.06 | 0.518 | 0.511 | 0.868 | 0.995 | 0.788 | 0.698 | |||
| CLM5 | [-] | -91.0 | -91.1 | -77.0 | -61.8 | -12.1 | 20.7 | 1.11 | 0.531 | 0.501 | 0.862 | 0.995 | 0.760 | 0.692 |
Download Data |
Period Mean (original grids) [W/m2] |
Model Period Mean (intersection) [W/m2] |
Model Period Mean (complement) [W/m2] |
Benchmark Period Mean (intersection) [W/m2] |
Benchmark Period Mean (complement) [W/m2] |
Bias [W/m2] |
RMSE [W/m2] |
Phase Shift [months] |
Bias Score [1] |
RMSE Score [1] |
Seasonal Cycle Score [1] |
Spatial Distribution Score [1] |
Interannual Variability Score [1] |
Overall Score [1] |
|||
|---|---|---|---|---|---|---|---|---|---|---|---|---|---|---|---|---|---|
| Benchmark | [-] | -36.2 | |||||||||||||||
| CLM4 | [-] | -38.2 | -38.3 | -35.9 | -39.8 | -2.86 | 18.8 | 1.63 | 0.695 | 0.349 | 0.787 | 0.856 | 0.854 | 0.648 | |||
| CLM4.5 | [-] | -38.2 | -38.3 | -35.9 | -39.8 | -2.78 | 18.1 | 1.61 | 0.687 | 0.362 | 0.793 | 0.890 | 0.860 | 0.659 | |||
| CLM5 | [-] | -40.2 | -40.3 | -35.9 | -39.8 | -4.97 | 18.6 | 1.64 | 0.655 | 0.365 | 0.788 | 0.945 | 0.879 | 0.666 |
Download Data |
Period Mean (original grids) [W/m2] |
Model Period Mean (intersection) [W/m2] |
Model Period Mean (complement) [W/m2] |
Benchmark Period Mean (intersection) [W/m2] |
Benchmark Period Mean (complement) [W/m2] |
Bias [W/m2] |
RMSE [W/m2] |
Phase Shift [months] |
Bias Score [1] |
RMSE Score [1] |
Seasonal Cycle Score [1] |
Spatial Distribution Score [1] |
Interannual Variability Score [1] |
Overall Score [1] |
|||
|---|---|---|---|---|---|---|---|---|---|---|---|---|---|---|---|---|---|
| Benchmark | [-] | -46.4 | |||||||||||||||
| CLM4 | [-] | -40.6 | -40.5 | -45.1 | -51.0 | 4.41 | 12.4 | 2.11 | 0.398 | 0.367 | 0.682 | 0.942 | 0.725 | 0.580 | |||
| CLM4.5 | [-] | -42.8 | -42.8 | -45.1 | -51.0 | 2.76 | 12.6 | 2.10 | 0.387 | 0.365 | 0.682 | 0.957 | 0.729 | 0.581 | |||
| CLM5 | [-] | -47.5 | -47.5 | -45.1 | -51.0 | -1.79 | 12.4 | 1.98 | 0.386 | 0.358 | 0.707 | 0.940 | 0.732 | 0.580 |
Download Data |
Period Mean (original grids) [W/m2] |
Model Period Mean (intersection) [W/m2] |
Model Period Mean (complement) [W/m2] |
Benchmark Period Mean (intersection) [W/m2] |
Benchmark Period Mean (complement) [W/m2] |
Bias [W/m2] |
RMSE [W/m2] |
Phase Shift [months] |
Bias Score [1] |
RMSE Score [1] |
Seasonal Cycle Score [1] |
Spatial Distribution Score [1] |
Interannual Variability Score [1] |
Overall Score [1] |
|||
|---|---|---|---|---|---|---|---|---|---|---|---|---|---|---|---|---|---|
| Benchmark | [-] | -44.2 | |||||||||||||||
| CLM4 | [-] | -48.8 | -48.8 | -44.1 | -53.1 | -4.68 | 13.7 | 0.881 | 0.651 | 0.472 | 0.900 | 0.773 | 0.896 | 0.694 | |||
| CLM4.5 | [-] | -49.1 | -49.1 | -44.1 | -53.1 | -4.98 | 13.9 | 0.971 | 0.647 | 0.464 | 0.890 | 0.853 | 0.899 | 0.703 | |||
| CLM5 | [-] | -52.2 | -52.2 | -44.1 | -53.1 | -8.12 | 15.1 | 1.02 | 0.577 | 0.464 | 0.883 | 0.849 | 0.886 | 0.687 |
Download Data |
Period Mean (original grids) [W/m2] |
Model Period Mean (intersection) [W/m2] |
Model Period Mean (complement) [W/m2] |
Benchmark Period Mean (intersection) [W/m2] |
Benchmark Period Mean (complement) [W/m2] |
Bias [W/m2] |
RMSE [W/m2] |
Phase Shift [months] |
Bias Score [1] |
RMSE Score [1] |
Seasonal Cycle Score [1] |
Spatial Distribution Score [1] |
Interannual Variability Score [1] |
Overall Score [1] |
|||
|---|---|---|---|---|---|---|---|---|---|---|---|---|---|---|---|---|---|
| Benchmark | [-] | -66.8 | |||||||||||||||
| CLM4 | [-] | -69.3 | -69.0 | -67.0 | -58.2 | -1.08 | 15.1 | 1.01 | 0.713 | 0.518 | 0.870 | 0.994 | 0.824 | 0.739 | |||
| CLM4.5 | [-] | -69.8 | -69.5 | -67.0 | -58.2 | -1.55 | 15.2 | 1.05 | 0.708 | 0.518 | 0.864 | 0.994 | 0.827 | 0.738 | |||
| CLM5 | [-] | -72.9 | -72.6 | -67.0 | -58.2 | -4.65 | 16.5 | 1.10 | 0.665 | 0.507 | 0.857 | 0.989 | 0.826 | 0.725 |
Download Data |
Period Mean (original grids) [W/m2] |
Model Period Mean (intersection) [W/m2] |
Model Period Mean (complement) [W/m2] |
Benchmark Period Mean (intersection) [W/m2] |
Benchmark Period Mean (complement) [W/m2] |
Bias [W/m2] |
RMSE [W/m2] |
Phase Shift [months] |
Bias Score [1] |
RMSE Score [1] |
Seasonal Cycle Score [1] |
Spatial Distribution Score [1] |
Interannual Variability Score [1] |
Overall Score [1] |
|||
|---|---|---|---|---|---|---|---|---|---|---|---|---|---|---|---|---|---|
| Benchmark | [-] | -60.6 | |||||||||||||||
| CLM4 | [-] | -73.0 | -73.2 | -61.3 | -51.8 | -9.35 | 19.3 | 1.08 | 0.605 | 0.532 | 0.856 | 0.990 | 0.756 | 0.712 | |||
| CLM4.5 | [-] | -77.4 | -77.6 | -61.3 | -51.8 | -13.2 | 21.6 | 1.03 | 0.538 | 0.534 | 0.862 | 0.989 | 0.762 | 0.703 | |||
| CLM5 | [-] | -79.0 | -79.2 | -61.3 | -51.8 | -15.1 | 22.5 | 1.07 | 0.519 | 0.525 | 0.856 | 0.988 | 0.738 | 0.692 |
Download Data |
Period Mean (original grids) [W/m2] |
Model Period Mean (intersection) [W/m2] |
Model Period Mean (complement) [W/m2] |
Benchmark Period Mean (intersection) [W/m2] |
Benchmark Period Mean (complement) [W/m2] |
Bias [W/m2] |
RMSE [W/m2] |
Phase Shift [months] |
Bias Score [1] |
RMSE Score [1] |
Seasonal Cycle Score [1] |
Spatial Distribution Score [1] |
Interannual Variability Score [1] |
Overall Score [1] |
|||
|---|---|---|---|---|---|---|---|---|---|---|---|---|---|---|---|---|---|
| Benchmark | [-] | -32.3 | |||||||||||||||
| CLM4 | [-] | -38.5 | -38.6 | -32.2 | -34.9 | -6.37 | 19.1 | 2.10 | 0.632 | 0.335 | 0.714 | 0.934 | 0.855 | 0.634 | |||
| CLM4.5 | [-] | -38.1 | -38.1 | -32.2 | -34.9 | -5.86 | 17.6 | 2.11 | 0.653 | 0.363 | 0.713 | 0.970 | 0.861 | 0.654 | |||
| CLM5 | [-] | -40.5 | -40.5 | -32.2 | -34.9 | -8.31 | 18.5 | 2.10 | 0.572 | 0.366 | 0.715 | 0.938 | 0.901 | 0.643 |
Download Data |
Period Mean (original grids) [W/m2] |
Model Period Mean (intersection) [W/m2] |
Model Period Mean (complement) [W/m2] |
Benchmark Period Mean (intersection) [W/m2] |
Benchmark Period Mean (complement) [W/m2] |
Bias [W/m2] |
RMSE [W/m2] |
Phase Shift [months] |
Bias Score [1] |
RMSE Score [1] |
Seasonal Cycle Score [1] |
Spatial Distribution Score [1] |
Interannual Variability Score [1] |
Overall Score [1] |
|||
|---|---|---|---|---|---|---|---|---|---|---|---|---|---|---|---|---|---|
| Benchmark | [-] | -88.6 | |||||||||||||||
| CLM4 | [-] | -95.8 | -95.9 | -90.4 | -66.1 | -2.37 | 14.1 | 0.808 | 0.693 | 0.541 | 0.895 | 0.988 | 0.872 | 0.755 | |||
| CLM4.5 | [-] | -96.4 | -96.5 | -90.4 | -66.1 | -2.90 | 14.5 | 0.818 | 0.684 | 0.537 | 0.893 | 0.989 | 0.874 | 0.752 | |||
| CLM5 | [-] | -98.3 | -98.4 | -90.4 | -66.1 | -4.59 | 15.0 | 0.857 | 0.668 | 0.527 | 0.886 | 0.985 | 0.836 | 0.738 |
Download Data |
Period Mean (original grids) [W/m2] |
Model Period Mean (intersection) [W/m2] |
Model Period Mean (complement) [W/m2] |
Benchmark Period Mean (intersection) [W/m2] |
Benchmark Period Mean (complement) [W/m2] |
Bias [W/m2] |
RMSE [W/m2] |
Phase Shift [months] |
Bias Score [1] |
RMSE Score [1] |
Seasonal Cycle Score [1] |
Spatial Distribution Score [1] |
Interannual Variability Score [1] |
Overall Score [1] |
|||
|---|---|---|---|---|---|---|---|---|---|---|---|---|---|---|---|---|---|
| Benchmark | [-] | -54.5 | |||||||||||||||
| CLM4 | [-] | -55.2 | -55.2 | -54.0 | -59.9 | -1.97 | 13.5 | 1.52 | 0.700 | 0.445 | 0.778 | 0.980 | 0.881 | 0.705 | |||
| CLM4.5 | [-] | -54.8 | -54.8 | -54.0 | -59.9 | -1.45 | 13.0 | 1.55 | 0.706 | 0.455 | 0.773 | 0.980 | 0.878 | 0.708 | |||
| CLM5 | [-] | -58.1 | -58.1 | -54.0 | -59.9 | -4.66 | 13.9 | 1.59 | 0.660 | 0.446 | 0.770 | 0.976 | 0.885 | 0.697 |
Download Data |
Period Mean (original grids) [W/m2] |
Model Period Mean (intersection) [W/m2] |
Model Period Mean (complement) [W/m2] |
Benchmark Period Mean (intersection) [W/m2] |
Benchmark Period Mean (complement) [W/m2] |
Bias [W/m2] |
RMSE [W/m2] |
Phase Shift [months] |
Bias Score [1] |
RMSE Score [1] |
Seasonal Cycle Score [1] |
Spatial Distribution Score [1] |
Interannual Variability Score [1] |
Overall Score [1] |
|||
|---|---|---|---|---|---|---|---|---|---|---|---|---|---|---|---|---|---|
| Benchmark | [-] | -53.4 | |||||||||||||||
| CLM4 | [-] | -67.5 | -67.5 | -61.2 | -49.6 | -5.14 | 16.7 | 1.28 | 0.630 | 0.475 | 0.822 | 0.984 | 0.778 | 0.694 | |||
| CLM4.5 | [-] | -69.1 | -69.1 | -61.2 | -49.6 | -6.50 | 17.3 | 1.29 | 0.606 | 0.478 | 0.821 | 0.984 | 0.784 | 0.692 | |||
| CLM5 | [-] | -71.7 | -71.7 | -61.2 | -49.6 | -9.06 | 18.5 | 1.31 | 0.563 | 0.469 | 0.818 | 0.976 | 0.773 | 0.678 |
Download Data |
Period Mean (original grids) [W/m2] |
Model Period Mean (intersection) [W/m2] |
Model Period Mean (complement) [W/m2] |
Benchmark Period Mean (intersection) [W/m2] |
Benchmark Period Mean (complement) [W/m2] |
Bias [W/m2] |
RMSE [W/m2] |
Phase Shift [months] |
Bias Score [1] |
RMSE Score [1] |
Seasonal Cycle Score [1] |
Spatial Distribution Score [1] |
Interannual Variability Score [1] |
Overall Score [1] |
|||
|---|---|---|---|---|---|---|---|---|---|---|---|---|---|---|---|---|---|
| Benchmark | [-] | -100. | |||||||||||||||
| CLM4 | [-] | -107. | -107. | -101. | -73.0 | -4.31 | 16.2 | 0.862 | 0.658 | 0.517 | 0.878 | 0.987 | 0.796 | 0.726 | |||
| CLM4.5 | [-] | -107. | -107. | -101. | -73.0 | -4.66 | 16.4 | 0.858 | 0.651 | 0.516 | 0.880 | 0.989 | 0.804 | 0.726 | |||
| CLM5 | [-] | -108. | -108. | -101. | -73.0 | -6.02 | 16.9 | 0.860 | 0.631 | 0.511 | 0.879 | 0.984 | 0.802 | 0.720 |
Download Data |
Period Mean (original grids) [W/m2] |
Model Period Mean (intersection) [W/m2] |
Model Period Mean (complement) [W/m2] |
Benchmark Period Mean (intersection) [W/m2] |
Benchmark Period Mean (complement) [W/m2] |
Bias [W/m2] |
RMSE [W/m2] |
Phase Shift [months] |
Bias Score [1] |
RMSE Score [1] |
Seasonal Cycle Score [1] |
Spatial Distribution Score [1] |
Interannual Variability Score [1] |
Overall Score [1] |
|||
|---|---|---|---|---|---|---|---|---|---|---|---|---|---|---|---|---|---|
| Benchmark | [-] | -33.5 | |||||||||||||||
| CLM4 | [-] | -40.7 | -40.7 | -33.5 | -34.8 | -7.49 | 17.2 | 1.98 | 0.633 | 0.412 | 0.708 | 0.987 | 0.821 | 0.662 | |||
| CLM4.5 | [-] | -40.4 | -40.4 | -33.5 | -34.8 | -7.21 | 17.0 | 1.97 | 0.648 | 0.411 | 0.710 | 0.974 | 0.819 | 0.662 | |||
| CLM5 | [-] | -43.3 | -43.3 | -33.5 | -34.8 | -10.2 | 19.1 | 2.13 | 0.557 | 0.390 | 0.678 | 0.990 | 0.836 | 0.640 |
Download Data |
Period Mean (original grids) [W/m2] |
Model Period Mean (intersection) [W/m2] |
Model Period Mean (complement) [W/m2] |
Benchmark Period Mean (intersection) [W/m2] |
Benchmark Period Mean (complement) [W/m2] |
Bias [W/m2] |
RMSE [W/m2] |
Phase Shift [months] |
Bias Score [1] |
RMSE Score [1] |
Seasonal Cycle Score [1] |
Spatial Distribution Score [1] |
Interannual Variability Score [1] |
Overall Score [1] |
|||
|---|---|---|---|---|---|---|---|---|---|---|---|---|---|---|---|---|---|
| Benchmark | [-] | -66.0 | |||||||||||||||
| CLM4 | [-] | -83.1 | -83.1 | -67.8 | -57.2 | -12.3 | 20.6 | 2.06 | 0.450 | 0.439 | 0.654 | 0.983 | 0.820 | 0.631 | |||
| CLM4.5 | [-] | -83.1 | -83.1 | -67.8 | -57.2 | -11.7 | 20.5 | 2.01 | 0.459 | 0.437 | 0.666 | 0.957 | 0.820 | 0.629 | |||
| CLM5 | [-] | -84.7 | -84.6 | -67.8 | -57.2 | -13.3 | 20.9 | 2.06 | 0.435 | 0.442 | 0.654 | 0.967 | 0.805 | 0.624 |
Download Data |
Period Mean (original grids) [W/m2] |
Model Period Mean (intersection) [W/m2] |
Model Period Mean (complement) [W/m2] |
Benchmark Period Mean (intersection) [W/m2] |
Benchmark Period Mean (complement) [W/m2] |
Bias [W/m2] |
RMSE [W/m2] |
Phase Shift [months] |
Bias Score [1] |
RMSE Score [1] |
Seasonal Cycle Score [1] |
Spatial Distribution Score [1] |
Interannual Variability Score [1] |
Overall Score [1] |
|||
|---|---|---|---|---|---|---|---|---|---|---|---|---|---|---|---|---|---|
| Benchmark | [-] | -51.6 | |||||||||||||||
| CLM4 | [-] | -57.0 | -56.8 | -51.4 | -56.8 | -5.40 | 11.7 | 1.59 | 0.638 | 0.440 | 0.752 | 0.892 | 0.900 | 0.677 | |||
| CLM4.5 | [-] | -58.8 | -58.6 | -51.4 | -56.8 | -7.06 | 13.2 | 1.69 | 0.570 | 0.423 | 0.727 | 0.846 | 0.904 | 0.649 | |||
| CLM5 | [-] | -62.9 | -62.7 | -51.4 | -56.8 | -11.3 | 15.7 | 1.88 | 0.416 | 0.424 | 0.697 | 0.825 | 0.901 | 0.614 |
Download Data |
Period Mean (original grids) [W/m2] |
Model Period Mean (intersection) [W/m2] |
Model Period Mean (complement) [W/m2] |
Benchmark Period Mean (intersection) [W/m2] |
Benchmark Period Mean (complement) [W/m2] |
Bias [W/m2] |
RMSE [W/m2] |
Phase Shift [months] |
Bias Score [1] |
RMSE Score [1] |
Seasonal Cycle Score [1] |
Spatial Distribution Score [1] |
Interannual Variability Score [1] |
Overall Score [1] |
|||
|---|---|---|---|---|---|---|---|---|---|---|---|---|---|---|---|---|---|
| Benchmark | [-] | -46.1 | |||||||||||||||
| CLM4 | [-] | -49.8 | -49.8 | -46.1 | -44.3 | -3.57 | 11.6 | 0.821 | 0.760 | 0.525 | 0.910 | 0.863 | 0.844 | 0.738 | |||
| CLM4.5 | [-] | -49.9 | -49.9 | -46.1 | -44.3 | -3.56 | 11.9 | 0.813 | 0.760 | 0.513 | 0.909 | 0.889 | 0.842 | 0.738 | |||
| CLM5 | [-] | -53.2 | -53.2 | -46.1 | -44.3 | -6.84 | 13.5 | 0.817 | 0.652 | 0.503 | 0.907 | 0.890 | 0.862 | 0.720 |
Download Data |
Period Mean (original grids) [W/m2] |
Model Period Mean (intersection) [W/m2] |
Model Period Mean (complement) [W/m2] |
Benchmark Period Mean (intersection) [W/m2] |
Benchmark Period Mean (complement) [W/m2] |
Bias [W/m2] |
RMSE [W/m2] |
Phase Shift [months] |
Bias Score [1] |
RMSE Score [1] |
Seasonal Cycle Score [1] |
Spatial Distribution Score [1] |
Interannual Variability Score [1] |
Overall Score [1] |
|||
|---|---|---|---|---|---|---|---|---|---|---|---|---|---|---|---|---|---|
| Benchmark | [-] | -78.8 | |||||||||||||||
| CLM4 | [-] | -84.8 | -84.7 | -79.2 | -53.1 | -5.19 | 15.7 | 1.16 | 0.696 | 0.550 | 0.834 | 0.995 | 0.873 | 0.750 | |||
| CLM4.5 | [-] | -85.2 | -85.1 | -79.2 | -53.1 | -5.51 | 15.8 | 1.20 | 0.689 | 0.554 | 0.833 | 0.996 | 0.880 | 0.751 | |||
| CLM5 | [-] | -88.1 | -87.9 | -79.2 | -53.1 | -8.35 | 17.1 | 1.20 | 0.650 | 0.545 | 0.832 | 0.994 | 0.865 | 0.739 |
Download Data |
Period Mean (original grids) [W/m2] |
Model Period Mean (intersection) [W/m2] |
Model Period Mean (complement) [W/m2] |
Benchmark Period Mean (intersection) [W/m2] |
Benchmark Period Mean (complement) [W/m2] |
Bias [W/m2] |
RMSE [W/m2] |
Phase Shift [months] |
Bias Score [1] |
RMSE Score [1] |
Seasonal Cycle Score [1] |
Spatial Distribution Score [1] |
Interannual Variability Score [1] |
Overall Score [1] |
|||
|---|---|---|---|---|---|---|---|---|---|---|---|---|---|---|---|---|---|
| Benchmark | [-] | -39.8 | |||||||||||||||
| CLM4 | [-] | -47.2 | -47.1 | -39.6 | -48.2 | -7.79 | 14.4 | 1.76 | 0.436 | 0.429 | 0.749 | 0.940 | 0.670 | 0.609 | |||
| CLM4.5 | [-] | -50.1 | -50.0 | -39.6 | -48.2 | -10.4 | 16.2 | 1.78 | 0.370 | 0.428 | 0.745 | 0.898 | 0.680 | 0.591 | |||
| CLM5 | [-] | -51.8 | -51.6 | -39.6 | -48.2 | -12.1 | 17.0 | 1.70 | 0.326 | 0.430 | 0.760 | 0.965 | 0.682 | 0.599 |
Download Data |
Period Mean (original grids) [W/m2] |
Model Period Mean (intersection) [W/m2] |
Model Period Mean (complement) [W/m2] |
Benchmark Period Mean (intersection) [W/m2] |
Benchmark Period Mean (complement) [W/m2] |
Bias [W/m2] |
RMSE [W/m2] |
Phase Shift [months] |
Bias Score [1] |
RMSE Score [1] |
Seasonal Cycle Score [1] |
Spatial Distribution Score [1] |
Interannual Variability Score [1] |
Overall Score [1] |
|||
|---|---|---|---|---|---|---|---|---|---|---|---|---|---|---|---|---|---|
| Benchmark | [-] | -63.6 | |||||||||||||||
| CLM4 | [-] | -67.5 | -67.9 | -63.7 | -59.9 | -3.67 | 15.0 | 1.37 | 0.659 | 0.484 | 0.813 | 0.965 | 0.768 | 0.695 | |||
| CLM4.5 | [-] | -70.0 | -70.5 | -63.7 | -59.9 | -6.02 | 16.0 | 1.37 | 0.639 | 0.481 | 0.814 | 0.952 | 0.790 | 0.693 | |||
| CLM5 | [-] | -72.4 | -72.8 | -63.7 | -59.9 | -8.42 | 16.1 | 1.27 | 0.619 | 0.485 | 0.833 | 0.982 | 0.768 | 0.695 |
Download Data |
Period Mean (original grids) [W/m2] |
Model Period Mean (intersection) [W/m2] |
Model Period Mean (complement) [W/m2] |
Benchmark Period Mean (intersection) [W/m2] |
Benchmark Period Mean (complement) [W/m2] |
Bias [W/m2] |
RMSE [W/m2] |
Phase Shift [months] |
Bias Score [1] |
RMSE Score [1] |
Seasonal Cycle Score [1] |
Spatial Distribution Score [1] |
Interannual Variability Score [1] |
Overall Score [1] |
|||
|---|---|---|---|---|---|---|---|---|---|---|---|---|---|---|---|---|---|
| Benchmark | [-] | -80.2 | |||||||||||||||
| CLM4 | [-] | -83.0 | -82.5 | -83.6 | -50.6 | 3.74 | 21.7 | 1.23 | 0.553 | 0.459 | 0.839 | 0.928 | 0.773 | 0.668 | |||
| CLM4.5 | [-] | -84.8 | -84.4 | -83.6 | -50.6 | 2.11 | 21.6 | 1.23 | 0.553 | 0.459 | 0.838 | 0.936 | 0.776 | 0.670 | |||
| CLM5 | [-] | -85.8 | -85.5 | -83.6 | -50.6 | 1.06 | 21.5 | 1.21 | 0.556 | 0.455 | 0.841 | 0.917 | 0.776 | 0.667 |
Temporally integrated period mean