Mean State
Download Data |
Period Mean (original grids) [Pg yr-1] |
Model Period Mean (intersection) [Pg yr-1] |
Model Period Mean (complement) [Pg yr-1] |
Benchmark Period Mean (intersection) [Pg yr-1] |
Benchmark Period Mean (complement) [Pg yr-1] |
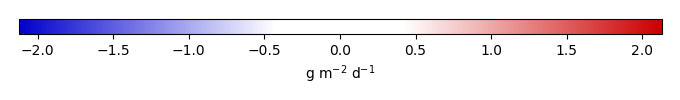
Bias [g m-2 d-1] |
RMSE [g m-2 d-1] |
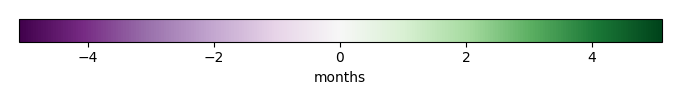
Phase Shift [months] |
Bias Score [1] |
RMSE Score [1] |
Seasonal Cycle Score [1] |
Spatial Distribution Score [1] |
Overall Score [1] |
|||
|---|---|---|---|---|---|---|---|---|---|---|---|---|---|---|---|---|
| Benchmark | [-] | 8.19 | ||||||||||||||
| CLM4.5SP | [-] | 9.32 | 9.54 | 0.279 | 8.18 | 0.00755 | 1.02 | 1.80 | 2.26 | 0.27 | 0.23 | 0.59 | 0.97 | 0.46 | ||
| CLM4SP | [-] | 10.7 | 10.9 | 0.237 | 8.18 | 0.00755 | 1.86 | 2.56 | 2.23 | 0.14 | 0.17 | 0.61 | 0.87 | 0.39 | ||
| CLM5SP | [-] | 8.09 | 8.27 | 0.255 | 8.18 | 0.00755 | 0.208 | 1.54 | 2.16 | 0.35 | 0.28 | 0.60 | 0.98 | 0.50 |
Download Data |
Period Mean (original grids) [Pg yr-1] |
Model Period Mean (intersection) [Pg yr-1] |
Model Period Mean (complement) [Pg yr-1] |
Benchmark Period Mean (intersection) [Pg yr-1] |
Benchmark Period Mean (complement) [Pg yr-1] |
Bias [g m-2 d-1] |
RMSE [g m-2 d-1] |
Phase Shift [months] |
Bias Score [1] |
RMSE Score [1] |
Seasonal Cycle Score [1] |
Spatial Distribution Score [1] |
Overall Score [1] |
|||
|---|---|---|---|---|---|---|---|---|---|---|---|---|---|---|---|---|
| Benchmark | [-] | 5.55 | ||||||||||||||
| CLM4.5SP | [-] | 10.6 | 10.1 | 0.0332 | 5.55 | 0.00508 | 1.87 | 2.68 | 0.815 | 0.30 | 0.33 | 0.87 | 0.83 | 0.53 | ||
| CLM4SP | [-] | 8.93 | 8.49 | 0.0248 | 5.55 | 0.00508 | 1.20 | 1.80 | 1.09 | 0.45 | 0.42 | 0.79 | 0.87 | 0.59 | ||
| CLM5SP | [-] | 9.34 | 8.89 | 0.0339 | 5.55 | 0.00508 | 1.37 | 2.10 | 0.781 | 0.42 | 0.40 | 0.89 | 0.92 | 0.61 |
Download Data |
Period Mean (original grids) [Pg yr-1] |
Model Period Mean (intersection) [Pg yr-1] |
Model Period Mean (complement) [Pg yr-1] |
Benchmark Period Mean (intersection) [Pg yr-1] |
Benchmark Period Mean (complement) [Pg yr-1] |
Bias [g m-2 d-1] |
RMSE [g m-2 d-1] |
Phase Shift [months] |
Bias Score [1] |
RMSE Score [1] |
Seasonal Cycle Score [1] |
Spatial Distribution Score [1] |
Overall Score [1] |
|||
|---|---|---|---|---|---|---|---|---|---|---|---|---|---|---|---|---|
| Benchmark | [-] | 9.94 | ||||||||||||||
| CLM4.5SP | [-] | 14.0 | 13.5 | 0.453 | 9.92 | 0.0215 | 1.26 | 2.21 | 0.809 | 0.44 | 0.33 | 0.90 | 0.90 | 0.58 | ||
| CLM4SP | [-] | 12.2 | 11.8 | 0.394 | 9.92 | 0.0215 | 0.717 | 1.63 | 1.65 | 0.56 | 0.40 | 0.67 | 0.91 | 0.59 | ||
| CLM5SP | [-] | 12.2 | 11.7 | 0.395 | 9.92 | 0.0215 | 0.704 | 1.67 | 0.853 | 0.53 | 0.44 | 0.89 | 0.93 | 0.65 |
Download Data |
Period Mean (original grids) [Pg yr-1] |
Model Period Mean (intersection) [Pg yr-1] |
Model Period Mean (complement) [Pg yr-1] |
Benchmark Period Mean (intersection) [Pg yr-1] |
Benchmark Period Mean (complement) [Pg yr-1] |
Bias [g m-2 d-1] |
RMSE [g m-2 d-1] |
Phase Shift [months] |
Bias Score [1] |
RMSE Score [1] |
Seasonal Cycle Score [1] |
Spatial Distribution Score [1] |
Overall Score [1] |
|||
|---|---|---|---|---|---|---|---|---|---|---|---|---|---|---|---|---|
| Benchmark | [-] | 1.03 | ||||||||||||||
| CLM4.5SP | [-] | 1.10 | 1.06 | 0.0420 | 1.03 | 0.00296 | 0.109 | 0.681 | 0.0207 | 0.87 | 0.64 | 1.0 | 0.98 | 0.82 | ||
| CLM4SP | [-] | 1.22 | 1.18 | 0.0464 | 1.03 | 0.00296 | 0.218 | 0.787 | 0.0190 | 0.81 | 0.61 | 1.0 | 0.94 | 0.79 | ||
| CLM5SP | [-] | 1.16 | 1.12 | 0.0373 | 1.03 | 0.00296 | 0.156 | 0.799 | 0.130 | 0.85 | 0.58 | 0.99 | 0.96 | 0.79 |
Download Data |
Period Mean (original grids) [Pg yr-1] |
Model Period Mean (intersection) [Pg yr-1] |
Model Period Mean (complement) [Pg yr-1] |
Benchmark Period Mean (intersection) [Pg yr-1] |
Benchmark Period Mean (complement) [Pg yr-1] |
Bias [g m-2 d-1] |
RMSE [g m-2 d-1] |
Phase Shift [months] |
Bias Score [1] |
RMSE Score [1] |
Seasonal Cycle Score [1] |
Spatial Distribution Score [1] |
Overall Score [1] |
|||
|---|---|---|---|---|---|---|---|---|---|---|---|---|---|---|---|---|
| Benchmark | [-] | 7.13 | ||||||||||||||
| CLM4.5SP | [-] | 8.09 | 6.82 | 1.23 | 6.94 | 0.197 | 2.06 | 2.39 | 2.11 | 0.26 | 0.20 | 0.70 | 0.42 | 0.36 | ||
| CLM4SP | [-] | 10.0 | 8.61 | 1.37 | 6.94 | 0.197 | 4.07 | 4.29 | 2.55 | 0.029 | 0.14 | 0.59 | 0.85 | 0.35 | ||
| CLM5SP | [-] | 7.22 | 6.06 | 1.12 | 6.94 | 0.197 | 1.11 | 2.09 | 2.40 | 0.18 | 0.26 | 0.64 | 0.46 | 0.36 |
Download Data |
Period Mean (original grids) [Pg yr-1] |
Model Period Mean (intersection) [Pg yr-1] |
Model Period Mean (complement) [Pg yr-1] |
Benchmark Period Mean (intersection) [Pg yr-1] |
Benchmark Period Mean (complement) [Pg yr-1] |
Bias [g m-2 d-1] |
RMSE [g m-2 d-1] |
Phase Shift [months] |
Bias Score [1] |
RMSE Score [1] |
Seasonal Cycle Score [1] |
Spatial Distribution Score [1] |
Overall Score [1] |
|||
|---|---|---|---|---|---|---|---|---|---|---|---|---|---|---|---|---|
| Benchmark | [-] | 6.86 | ||||||||||||||
| CLM4.5SP | [-] | 7.76 | 7.49 | 0.0699 | 6.85 | 0.00296 | 0.223 | 0.965 | 0.299 | 0.89 | 0.71 | 0.98 | 0.99 | 0.85 | ||
| CLM4SP | [-] | 9.26 | 8.99 | 0.0704 | 6.85 | 0.00296 | 0.685 | 1.42 | 0.460 | 0.76 | 0.65 | 0.97 | 0.98 | 0.80 | ||
| CLM5SP | [-] | 7.14 | 6.91 | 0.0652 | 6.85 | 0.00296 | 0.0432 | 1.10 | 0.607 | 0.87 | 0.69 | 0.96 | 0.96 | 0.83 |
Download Data |
Period Mean (original grids) [Pg yr-1] |
Model Period Mean (intersection) [Pg yr-1] |
Model Period Mean (complement) [Pg yr-1] |
Benchmark Period Mean (intersection) [Pg yr-1] |
Benchmark Period Mean (complement) [Pg yr-1] |
Bias [g m-2 d-1] |
RMSE [g m-2 d-1] |
Phase Shift [months] |
Bias Score [1] |
RMSE Score [1] |
Seasonal Cycle Score [1] |
Spatial Distribution Score [1] |
Overall Score [1] |
|||
|---|---|---|---|---|---|---|---|---|---|---|---|---|---|---|---|---|
| Benchmark | [-] | 10.1 | ||||||||||||||
| CLM4.5SP | [-] | 11.1 | 10.9 | 0.354 | 10.0 | 0.0375 | 0.227 | 0.778 | 0.731 | 0.79 | 0.66 | 0.97 | 0.97 | 0.81 | ||
| CLM4SP | [-] | 10.1 | 9.93 | 0.333 | 10.0 | 0.0375 | 0.0708 | 0.702 | 0.726 | 0.76 | 0.70 | 0.96 | 0.97 | 0.82 | ||
| CLM5SP | [-] | 8.54 | 8.35 | 0.290 | 10.0 | 0.0375 | -0.186 | 0.743 | 0.725 | 0.73 | 0.69 | 0.97 | 0.95 | 0.80 |
Download Data |
Period Mean (original grids) [Pg yr-1] |
Model Period Mean (intersection) [Pg yr-1] |
Model Period Mean (complement) [Pg yr-1] |
Benchmark Period Mean (intersection) [Pg yr-1] |
Benchmark Period Mean (complement) [Pg yr-1] |
Bias [g m-2 d-1] |
RMSE [g m-2 d-1] |
Phase Shift [months] |
Bias Score [1] |
RMSE Score [1] |
Seasonal Cycle Score [1] |
Spatial Distribution Score [1] |
Overall Score [1] |
|||
|---|---|---|---|---|---|---|---|---|---|---|---|---|---|---|---|---|
| Benchmark | [-] | 8.37 | ||||||||||||||
| CLM4.5SP | [-] | 9.87 | 9.18 | 0.562 | 8.32 | 0.0454 | 0.867 | 1.58 | 1.17 | 0.55 | 0.47 | 0.84 | 0.95 | 0.66 | ||
| CLM4SP | [-] | 9.28 | 8.62 | 0.517 | 8.32 | 0.0454 | 0.629 | 1.60 | 1.37 | 0.49 | 0.45 | 0.83 | 0.91 | 0.63 | ||
| CLM5SP | [-] | 9.14 | 8.49 | 0.535 | 8.32 | 0.0454 | 0.561 | 1.48 | 1.19 | 0.55 | 0.49 | 0.85 | 0.96 | 0.67 |
Download Data |
Period Mean (original grids) [Pg yr-1] |
Model Period Mean (intersection) [Pg yr-1] |
Model Period Mean (complement) [Pg yr-1] |
Benchmark Period Mean (intersection) [Pg yr-1] |
Benchmark Period Mean (complement) [Pg yr-1] |
Bias [g m-2 d-1] |
RMSE [g m-2 d-1] |
Phase Shift [months] |
Bias Score [1] |
RMSE Score [1] |
Seasonal Cycle Score [1] |
Spatial Distribution Score [1] |
Overall Score [1] |
|||
|---|---|---|---|---|---|---|---|---|---|---|---|---|---|---|---|---|
| Benchmark | [-] | 1.28 | ||||||||||||||
| CLM4.5SP | [-] | 1.21 | 1.23 | 0.0230 | 1.28 | 0.00137 | -0.00735 | 0.701 | 0.0358 | 0.89 | 0.66 | 1.0 | 0.96 | 0.83 | ||
| CLM4SP | [-] | 1.43 | 1.45 | 0.0291 | 1.28 | 0.00137 | 0.175 | 0.918 | 0.0380 | 0.82 | 0.59 | 1.0 | 0.95 | 0.79 | ||
| CLM5SP | [-] | 1.28 | 1.30 | 0.0214 | 1.28 | 0.00137 | 0.0458 | 0.789 | 0.0908 | 0.87 | 0.62 | 1.0 | 0.97 | 0.82 |
Download Data |
Period Mean (original grids) [Pg yr-1] |
Model Period Mean (intersection) [Pg yr-1] |
Model Period Mean (complement) [Pg yr-1] |
Benchmark Period Mean (intersection) [Pg yr-1] |
Benchmark Period Mean (complement) [Pg yr-1] |
Bias [g m-2 d-1] |
RMSE [g m-2 d-1] |
Phase Shift [months] |
Bias Score [1] |
RMSE Score [1] |
Seasonal Cycle Score [1] |
Spatial Distribution Score [1] |
Overall Score [1] |
|||
|---|---|---|---|---|---|---|---|---|---|---|---|---|---|---|---|---|
| Benchmark | [-] | 3.53 | ||||||||||||||
| CLM4.5SP | [-] | 5.10 | 4.53 | 0.529 | 3.49 | 0.0402 | 0.613 | 1.03 | 1.31 | 0.48 | 0.33 | 0.90 | 0.74 | 0.55 | ||
| CLM4SP | [-] | 4.55 | 4.02 | 0.501 | 3.49 | 0.0402 | 0.418 | 0.881 | 1.53 | 0.49 | 0.37 | 0.87 | 0.76 | 0.57 | ||
| CLM5SP | [-] | 4.85 | 4.34 | 0.469 | 3.49 | 0.0402 | 0.534 | 0.929 | 1.42 | 0.47 | 0.39 | 0.89 | 0.80 | 0.59 |
Download Data |
Period Mean (original grids) [Pg yr-1] |
Model Period Mean (intersection) [Pg yr-1] |
Model Period Mean (complement) [Pg yr-1] |
Benchmark Period Mean (intersection) [Pg yr-1] |
Benchmark Period Mean (complement) [Pg yr-1] |
Bias [g m-2 d-1] |
RMSE [g m-2 d-1] |
Phase Shift [months] |
Bias Score [1] |
RMSE Score [1] |
Seasonal Cycle Score [1] |
Spatial Distribution Score [1] |
Overall Score [1] |
|||
|---|---|---|---|---|---|---|---|---|---|---|---|---|---|---|---|---|
| Benchmark | [-] | 5.29 | ||||||||||||||
| CLM4.5SP | [-] | 5.66 | 5.35 | 0.242 | 5.26 | 0.0312 | 0.444 | 1.46 | 0.265 | 0.81 | 0.61 | 0.98 | 0.97 | 0.80 | ||
| CLM4SP | [-] | 5.23 | 4.94 | 0.219 | 5.26 | 0.0312 | 0.208 | 1.28 | 0.297 | 0.77 | 0.68 | 0.98 | 0.91 | 0.81 | ||
| CLM5SP | [-] | 4.58 | 4.33 | 0.199 | 5.26 | 0.0312 | -0.138 | 1.20 | 0.250 | 0.76 | 0.69 | 0.98 | 0.84 | 0.79 |
Download Data |
Period Mean (original grids) [Pg yr-1] |
Model Period Mean (intersection) [Pg yr-1] |
Model Period Mean (complement) [Pg yr-1] |
Benchmark Period Mean (intersection) [Pg yr-1] |
Benchmark Period Mean (complement) [Pg yr-1] |
Bias [g m-2 d-1] |
RMSE [g m-2 d-1] |
Phase Shift [months] |
Bias Score [1] |
RMSE Score [1] |
Seasonal Cycle Score [1] |
Spatial Distribution Score [1] |
Overall Score [1] |
|||
|---|---|---|---|---|---|---|---|---|---|---|---|---|---|---|---|---|
| Benchmark | [-] | 119. | ||||||||||||||
| CLM4.5SP | [-] | 143. | 137. | 6.07 | 118. | 0.802 | 0.636 | 1.35 | 0.970 | 0.50 | 0.40 | 0.82 | 0.95 | 0.62 | ||
| CLM4SP | [-] | 148. | 142. | 5.89 | 118. | 0.802 | 0.745 | 1.43 | 1.14 | 0.44 | 0.40 | 0.77 | 0.91 | 0.58 | ||
| CLM5SP | [-] | 125. | 120. | 5.44 | 118. | 0.802 | 0.234 | 1.18 | 1.01 | 0.49 | 0.46 | 0.81 | 0.97 | 0.64 |
Download Data |
Period Mean (original grids) [Pg yr-1] |
Model Period Mean (intersection) [Pg yr-1] |
Model Period Mean (complement) [Pg yr-1] |
Benchmark Period Mean (intersection) [Pg yr-1] |
Benchmark Period Mean (complement) [Pg yr-1] |
Bias [g m-2 d-1] |
RMSE [g m-2 d-1] |
Phase Shift [months] |
Bias Score [1] |
RMSE Score [1] |
Seasonal Cycle Score [1] |
Spatial Distribution Score [1] |
Overall Score [1] |
|||
|---|---|---|---|---|---|---|---|---|---|---|---|---|---|---|---|---|
| Benchmark | [-] | 0.864 | ||||||||||||||
| CLM4.5SP | [-] | 0.999 | 0.954 | 0.0574 | 0.859 | 0.00579 | 0.0860 | 0.316 | 2.17 | 0.54 | 0.40 | 0.89 | 0.89 | 0.62 | ||
| CLM4SP | [-] | 0.890 | 0.850 | 0.0499 | 0.859 | 0.00579 | 0.0500 | 0.258 | 2.10 | 0.57 | 0.48 | 0.88 | 0.90 | 0.66 | ||
| CLM5SP | [-] | 0.865 | 0.827 | 0.0515 | 0.859 | 0.00579 | 0.0346 | 0.260 | 2.14 | 0.57 | 0.49 | 0.90 | 0.91 | 0.67 |
Download Data |
Period Mean (original grids) [Pg yr-1] |
Model Period Mean (intersection) [Pg yr-1] |
Model Period Mean (complement) [Pg yr-1] |
Benchmark Period Mean (intersection) [Pg yr-1] |
Benchmark Period Mean (complement) [Pg yr-1] |
Bias [g m-2 d-1] |
RMSE [g m-2 d-1] |
Phase Shift [months] |
Bias Score [1] |
RMSE Score [1] |
Seasonal Cycle Score [1] |
Spatial Distribution Score [1] |
Overall Score [1] |
|||
|---|---|---|---|---|---|---|---|---|---|---|---|---|---|---|---|---|
| Benchmark | [-] | 1.56 | ||||||||||||||
| CLM4.5SP | [-] | 1.81 | 1.74 | 0.0530 | 1.55 | 0.00323 | 0.133 | 0.604 | 0.224 | 0.82 | 0.54 | 0.99 | 0.93 | 0.77 | ||
| CLM4SP | [-] | 2.47 | 2.38 | 0.0609 | 1.55 | 0.00323 | 0.408 | 0.941 | 0.253 | 0.62 | 0.42 | 0.99 | 0.80 | 0.65 | ||
| CLM5SP | [-] | 1.65 | 1.59 | 0.0446 | 1.55 | 0.00323 | 0.0591 | 0.531 | 0.266 | 0.83 | 0.59 | 0.99 | 0.96 | 0.79 |
Download Data |
Period Mean (original grids) [Pg yr-1] |
Model Period Mean (intersection) [Pg yr-1] |
Model Period Mean (complement) [Pg yr-1] |
Benchmark Period Mean (intersection) [Pg yr-1] |
Benchmark Period Mean (complement) [Pg yr-1] |
Bias [g m-2 d-1] |
RMSE [g m-2 d-1] |
Phase Shift [months] |
Bias Score [1] |
RMSE Score [1] |
Seasonal Cycle Score [1] |
Spatial Distribution Score [1] |
Overall Score [1] |
|||
|---|---|---|---|---|---|---|---|---|---|---|---|---|---|---|---|---|
| Benchmark | [-] | 3.62 | ||||||||||||||
| CLM4.5SP | [-] | 4.55 | 3.94 | 0.526 | 3.60 | 0.0267 | 1.33 | 2.12 | 1.00 | 0.35 | 0.30 | 0.87 | 0.91 | 0.55 | ||
| CLM4SP | [-] | 4.36 | 3.82 | 0.462 | 3.60 | 0.0267 | 1.09 | 1.96 | 1.06 | 0.35 | 0.31 | 0.88 | 0.89 | 0.55 | ||
| CLM5SP | [-] | 4.02 | 3.45 | 0.494 | 3.60 | 0.0267 | 0.786 | 1.76 | 0.951 | 0.41 | 0.41 | 0.87 | 0.92 | 0.60 |
Download Data |
Period Mean (original grids) [Pg yr-1] |
Model Period Mean (intersection) [Pg yr-1] |
Model Period Mean (complement) [Pg yr-1] |
Benchmark Period Mean (intersection) [Pg yr-1] |
Benchmark Period Mean (complement) [Pg yr-1] |
Bias [g m-2 d-1] |
RMSE [g m-2 d-1] |
Phase Shift [months] |
Bias Score [1] |
RMSE Score [1] |
Seasonal Cycle Score [1] |
Spatial Distribution Score [1] |
Overall Score [1] |
|||
|---|---|---|---|---|---|---|---|---|---|---|---|---|---|---|---|---|
| Benchmark | [-] | 5.09 | ||||||||||||||
| CLM4.5SP | [-] | 6.15 | 5.87 | 0.166 | 5.09 | 0.00487 | 0.734 | 1.55 | 0.341 | 0.74 | 0.64 | 0.98 | 0.94 | 0.79 | ||
| CLM4SP | [-] | 6.18 | 5.93 | 0.159 | 5.09 | 0.00487 | 0.759 | 1.42 | 0.513 | 0.73 | 0.69 | 0.95 | 0.93 | 0.80 | ||
| CLM5SP | [-] | 4.74 | 4.53 | 0.129 | 5.09 | 0.00487 | -0.229 | 1.15 | 0.337 | 0.82 | 0.73 | 0.97 | 0.98 | 0.85 |
Download Data |
Period Mean (original grids) [Pg yr-1] |
Model Period Mean (intersection) [Pg yr-1] |
Model Period Mean (complement) [Pg yr-1] |
Benchmark Period Mean (intersection) [Pg yr-1] |
Benchmark Period Mean (complement) [Pg yr-1] |
Bias [g m-2 d-1] |
RMSE [g m-2 d-1] |
Phase Shift [months] |
Bias Score [1] |
RMSE Score [1] |
Seasonal Cycle Score [1] |
Spatial Distribution Score [1] |
Overall Score [1] |
|||
|---|---|---|---|---|---|---|---|---|---|---|---|---|---|---|---|---|
| Benchmark | [-] | 3.36 | ||||||||||||||
| CLM4.5SP | [-] | 4.31 | 4.27 | 0.0646 | 3.34 | 0.0222 | 0.596 | 1.37 | 0.110 | 0.71 | 0.55 | 0.99 | 0.96 | 0.75 | ||
| CLM4SP | [-] | 5.28 | 5.25 | 0.0845 | 3.34 | 0.0222 | 1.12 | 1.87 | 0.343 | 0.57 | 0.50 | 0.98 | 0.90 | 0.69 | ||
| CLM5SP | [-] | 3.71 | 3.68 | 0.0555 | 3.34 | 0.0222 | 0.273 | 0.991 | 0.115 | 0.78 | 0.66 | 0.99 | 0.96 | 0.81 |
Download Data |
Period Mean (original grids) [Pg yr-1] |
Model Period Mean (intersection) [Pg yr-1] |
Model Period Mean (complement) [Pg yr-1] |
Benchmark Period Mean (intersection) [Pg yr-1] |
Benchmark Period Mean (complement) [Pg yr-1] |
Bias [g m-2 d-1] |
RMSE [g m-2 d-1] |
Phase Shift [months] |
Bias Score [1] |
RMSE Score [1] |
Seasonal Cycle Score [1] |
Spatial Distribution Score [1] |
Overall Score [1] |
|||
|---|---|---|---|---|---|---|---|---|---|---|---|---|---|---|---|---|
| Benchmark | [-] | 1.79 | ||||||||||||||
| CLM4.5SP | [-] | 1.93 | 2.03 | 0.0143 | 1.79 | 0.00506 | 0.223 | 0.884 | 0.666 | 0.63 | 0.49 | 0.94 | 0.96 | 0.70 | ||
| CLM4SP | [-] | 1.87 | 1.93 | 0.0161 | 1.79 | 0.00506 | 0.163 | 0.723 | 0.712 | 0.68 | 0.55 | 0.94 | 0.93 | 0.73 | ||
| CLM5SP | [-] | 1.47 | 1.55 | 0.0115 | 1.79 | 0.00506 | -0.114 | 0.690 | 0.663 | 0.65 | 0.58 | 0.94 | 0.94 | 0.74 |
Download Data |
Period Mean (original grids) [Pg yr-1] |
Model Period Mean (intersection) [Pg yr-1] |
Model Period Mean (complement) [Pg yr-1] |
Benchmark Period Mean (intersection) [Pg yr-1] |
Benchmark Period Mean (complement) [Pg yr-1] |
Bias [g m-2 d-1] |
RMSE [g m-2 d-1] |
Phase Shift [months] |
Bias Score [1] |
RMSE Score [1] |
Seasonal Cycle Score [1] |
Spatial Distribution Score [1] |
Overall Score [1] |
|||
|---|---|---|---|---|---|---|---|---|---|---|---|---|---|---|---|---|
| Benchmark | [-] | 23.2 | ||||||||||||||
| CLM4.5SP | [-] | 23.9 | 23.6 | 0.195 | 23.2 | 0.0226 | 0.367 | 1.78 | 2.56 | 0.30 | 0.19 | 0.58 | 0.81 | 0.41 | ||
| CLM4SP | [-] | 29.9 | 29.6 | 0.200 | 23.2 | 0.0226 | 2.30 | 3.05 | 2.75 | 0.13 | 0.12 | 0.54 | 0.96 | 0.37 | ||
| CLM5SP | [-] | 21.8 | 21.5 | 0.185 | 23.2 | 0.0226 | -0.346 | 1.82 | 2.72 | 0.16 | 0.26 | 0.54 | 0.88 | 0.42 |
Download Data |
Period Mean (original grids) [Pg yr-1] |
Model Period Mean (intersection) [Pg yr-1] |
Model Period Mean (complement) [Pg yr-1] |
Benchmark Period Mean (intersection) [Pg yr-1] |
Benchmark Period Mean (complement) [Pg yr-1] |
Bias [g m-2 d-1] |
RMSE [g m-2 d-1] |
Phase Shift [months] |
Bias Score [1] |
RMSE Score [1] |
Seasonal Cycle Score [1] |
Spatial Distribution Score [1] |
Overall Score [1] |
|||
|---|---|---|---|---|---|---|---|---|---|---|---|---|---|---|---|---|
| Benchmark | [-] | 10.4 | ||||||||||||||
| CLM4.5SP | [-] | 13.6 | 13.4 | 0.364 | 10.4 | 0.00314 | 1.42 | 2.42 | 0.780 | 0.44 | 0.45 | 0.91 | 0.78 | 0.61 | ||
| CLM4SP | [-] | 12.0 | 11.9 | 0.330 | 10.4 | 0.00314 | 0.738 | 1.92 | 1.33 | 0.52 | 0.48 | 0.80 | 0.82 | 0.62 | ||
| CLM5SP | [-] | 11.6 | 11.5 | 0.317 | 10.4 | 0.00314 | 0.582 | 1.93 | 0.741 | 0.52 | 0.52 | 0.92 | 0.81 | 0.66 |
Download Data |
Period Mean (original grids) [Pg yr-1] |
Model Period Mean (intersection) [Pg yr-1] |
Model Period Mean (complement) [Pg yr-1] |
Benchmark Period Mean (intersection) [Pg yr-1] |
Benchmark Period Mean (complement) [Pg yr-1] |
Bias [g m-2 d-1] |
RMSE [g m-2 d-1] |
Phase Shift [months] |
Bias Score [1] |
RMSE Score [1] |
Seasonal Cycle Score [1] |
Spatial Distribution Score [1] |
Overall Score [1] |
|||
|---|---|---|---|---|---|---|---|---|---|---|---|---|---|---|---|---|
| Benchmark | [-] | 1.16 | ||||||||||||||
| CLM4.5SP | [-] | 1.32 | 1.23 | 0.0482 | 1.14 | 0.0148 | 0.248 | 0.751 | 1.29 | 0.49 | 0.45 | 0.88 | 0.92 | 0.64 | ||
| CLM4SP | [-] | 1.53 | 1.44 | 0.0566 | 1.14 | 0.0148 | 0.502 | 0.845 | 1.22 | 0.41 | 0.46 | 0.90 | 0.84 | 0.61 | ||
| CLM5SP | [-] | 1.08 | 0.998 | 0.0459 | 1.14 | 0.0148 | 0.0351 | 0.660 | 1.29 | 0.48 | 0.46 | 0.87 | 0.93 | 0.64 |
Temporally integrated period mean