Mean State
Download Data |
Period Mean (original grids) [Pg yr-1] |
Model Period Mean (intersection) [Pg yr-1] |
Model Period Mean (complement) [Pg yr-1] |
Benchmark Period Mean (intersection) [Pg yr-1] |
Benchmark Period Mean (complement) [Pg yr-1] |
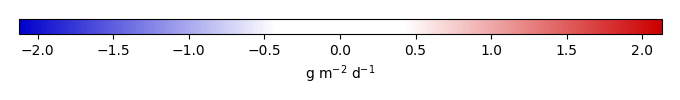
Bias [g m-2 d-1] |
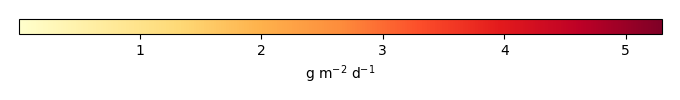
RMSE [g m-2 d-1] |
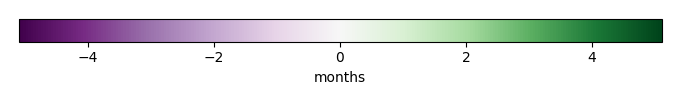
Phase Shift [months] |
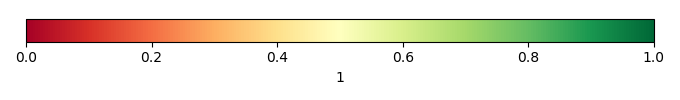
Bias Score [1] |
RMSE Score [1] |
Seasonal Cycle Score [1] |
Spatial Distribution Score [1] |
Overall Score [1] |
|||
|---|---|---|---|---|---|---|---|---|---|---|---|---|---|---|---|---|
| Benchmark | [-] | 8.19 | ||||||||||||||
| CLM4.5SP | [-] | 9.32 | 9.54 | 0.279 | 8.18 | 0.00755 | 1.02 | 1.80 | 2.26 | 0.271 | 0.226 | 0.589 | 0.968 | 0.456 | ||
| CLM4SP | [-] | 10.7 | 10.9 | 0.237 | 8.18 | 0.00755 | 1.86 | 2.56 | 2.23 | 0.141 | 0.171 | 0.611 | 0.867 | 0.392 | ||
| CLM5SP | [-] | 8.09 | 8.27 | 0.255 | 8.18 | 0.00755 | 0.208 | 1.54 | 2.16 | 0.353 | 0.275 | 0.598 | 0.985 | 0.497 |
Download Data |
Period Mean (original grids) [Pg yr-1] |
Model Period Mean (intersection) [Pg yr-1] |
Model Period Mean (complement) [Pg yr-1] |
Benchmark Period Mean (intersection) [Pg yr-1] |
Benchmark Period Mean (complement) [Pg yr-1] |
Bias [g m-2 d-1] |
RMSE [g m-2 d-1] |
Phase Shift [months] |
Bias Score [1] |
RMSE Score [1] |
Seasonal Cycle Score [1] |
Spatial Distribution Score [1] |
Overall Score [1] |
|||
|---|---|---|---|---|---|---|---|---|---|---|---|---|---|---|---|---|
| Benchmark | [-] | 5.55 | ||||||||||||||
| CLM4.5SP | [-] | 10.6 | 10.1 | 0.0332 | 5.55 | 0.00508 | 1.87 | 2.68 | 0.815 | 0.300 | 0.327 | 0.874 | 0.833 | 0.532 | ||
| CLM4SP | [-] | 8.93 | 8.49 | 0.0248 | 5.55 | 0.00508 | 1.20 | 1.80 | 1.09 | 0.445 | 0.423 | 0.788 | 0.866 | 0.589 | ||
| CLM5SP | [-] | 9.34 | 8.89 | 0.0339 | 5.55 | 0.00508 | 1.37 | 2.10 | 0.781 | 0.419 | 0.400 | 0.889 | 0.920 | 0.606 |
Download Data |
Period Mean (original grids) [Pg yr-1] |
Model Period Mean (intersection) [Pg yr-1] |
Model Period Mean (complement) [Pg yr-1] |
Benchmark Period Mean (intersection) [Pg yr-1] |
Benchmark Period Mean (complement) [Pg yr-1] |
Bias [g m-2 d-1] |
RMSE [g m-2 d-1] |
Phase Shift [months] |
Bias Score [1] |
RMSE Score [1] |
Seasonal Cycle Score [1] |
Spatial Distribution Score [1] |
Overall Score [1] |
|||
|---|---|---|---|---|---|---|---|---|---|---|---|---|---|---|---|---|
| Benchmark | [-] | 9.94 | ||||||||||||||
| CLM4.5SP | [-] | 14.0 | 13.5 | 0.453 | 9.92 | 0.0215 | 1.26 | 2.21 | 0.809 | 0.437 | 0.328 | 0.902 | 0.901 | 0.579 | ||
| CLM4SP | [-] | 12.2 | 11.8 | 0.394 | 9.92 | 0.0215 | 0.717 | 1.63 | 1.65 | 0.556 | 0.404 | 0.674 | 0.909 | 0.589 | ||
| CLM5SP | [-] | 12.2 | 11.7 | 0.395 | 9.92 | 0.0215 | 0.704 | 1.67 | 0.853 | 0.534 | 0.439 | 0.888 | 0.933 | 0.647 |
Download Data |
Period Mean (original grids) [Pg yr-1] |
Model Period Mean (intersection) [Pg yr-1] |
Model Period Mean (complement) [Pg yr-1] |
Benchmark Period Mean (intersection) [Pg yr-1] |
Benchmark Period Mean (complement) [Pg yr-1] |
Bias [g m-2 d-1] |
RMSE [g m-2 d-1] |
Phase Shift [months] |
Bias Score [1] |
RMSE Score [1] |
Seasonal Cycle Score [1] |
Spatial Distribution Score [1] |
Overall Score [1] |
|||
|---|---|---|---|---|---|---|---|---|---|---|---|---|---|---|---|---|
| Benchmark | [-] | 1.03 | ||||||||||||||
| CLM4.5SP | [-] | 1.10 | 1.06 | 0.0420 | 1.03 | 0.00296 | 0.109 | 0.681 | 0.0207 | 0.866 | 0.636 | 1.00 | 0.976 | 0.823 | ||
| CLM4SP | [-] | 1.22 | 1.18 | 0.0464 | 1.03 | 0.00296 | 0.218 | 0.787 | 0.0190 | 0.806 | 0.612 | 1.00 | 0.944 | 0.795 | ||
| CLM5SP | [-] | 1.16 | 1.12 | 0.0373 | 1.03 | 0.00296 | 0.156 | 0.799 | 0.130 | 0.849 | 0.582 | 0.991 | 0.964 | 0.794 |
Download Data |
Period Mean (original grids) [Pg yr-1] |
Model Period Mean (intersection) [Pg yr-1] |
Model Period Mean (complement) [Pg yr-1] |
Benchmark Period Mean (intersection) [Pg yr-1] |
Benchmark Period Mean (complement) [Pg yr-1] |
Bias [g m-2 d-1] |
RMSE [g m-2 d-1] |
Phase Shift [months] |
Bias Score [1] |
RMSE Score [1] |
Seasonal Cycle Score [1] |
Spatial Distribution Score [1] |
Overall Score [1] |
|||
|---|---|---|---|---|---|---|---|---|---|---|---|---|---|---|---|---|
| Benchmark | [-] | 7.13 | ||||||||||||||
| CLM4.5SP | [-] | 8.09 | 6.82 | 1.23 | 6.94 | 0.197 | 2.06 | 2.39 | 2.11 | 0.258 | 0.202 | 0.700 | 0.416 | 0.356 | ||
| CLM4SP | [-] | 10.0 | 8.61 | 1.37 | 6.94 | 0.197 | 4.07 | 4.29 | 2.55 | 0.0294 | 0.139 | 0.592 | 0.847 | 0.349 | ||
| CLM5SP | [-] | 7.22 | 6.06 | 1.12 | 6.94 | 0.197 | 1.11 | 2.09 | 2.40 | 0.184 | 0.263 | 0.637 | 0.458 | 0.361 |
Download Data |
Period Mean (original grids) [Pg yr-1] |
Model Period Mean (intersection) [Pg yr-1] |
Model Period Mean (complement) [Pg yr-1] |
Benchmark Period Mean (intersection) [Pg yr-1] |
Benchmark Period Mean (complement) [Pg yr-1] |
Bias [g m-2 d-1] |
RMSE [g m-2 d-1] |
Phase Shift [months] |
Bias Score [1] |
RMSE Score [1] |
Seasonal Cycle Score [1] |
Spatial Distribution Score [1] |
Overall Score [1] |
|||
|---|---|---|---|---|---|---|---|---|---|---|---|---|---|---|---|---|
| Benchmark | [-] | 6.86 | ||||||||||||||
| CLM4.5SP | [-] | 7.76 | 7.49 | 0.0699 | 6.85 | 0.00296 | 0.223 | 0.965 | 0.299 | 0.888 | 0.709 | 0.976 | 0.992 | 0.855 | ||
| CLM4SP | [-] | 9.26 | 8.99 | 0.0704 | 6.85 | 0.00296 | 0.685 | 1.42 | 0.460 | 0.764 | 0.653 | 0.966 | 0.979 | 0.803 | ||
| CLM5SP | [-] | 7.14 | 6.91 | 0.0652 | 6.85 | 0.00296 | 0.0432 | 1.10 | 0.607 | 0.873 | 0.685 | 0.958 | 0.962 | 0.833 |
Download Data |
Period Mean (original grids) [Pg yr-1] |
Model Period Mean (intersection) [Pg yr-1] |
Model Period Mean (complement) [Pg yr-1] |
Benchmark Period Mean (intersection) [Pg yr-1] |
Benchmark Period Mean (complement) [Pg yr-1] |
Bias [g m-2 d-1] |
RMSE [g m-2 d-1] |
Phase Shift [months] |
Bias Score [1] |
RMSE Score [1] |
Seasonal Cycle Score [1] |
Spatial Distribution Score [1] |
Overall Score [1] |
|||
|---|---|---|---|---|---|---|---|---|---|---|---|---|---|---|---|---|
| Benchmark | [-] | 10.1 | ||||||||||||||
| CLM4.5SP | [-] | 11.1 | 10.9 | 0.354 | 10.0 | 0.0375 | 0.227 | 0.778 | 0.731 | 0.786 | 0.664 | 0.971 | 0.975 | 0.812 | ||
| CLM4SP | [-] | 10.1 | 9.93 | 0.333 | 10.0 | 0.0375 | 0.0708 | 0.702 | 0.726 | 0.763 | 0.696 | 0.963 | 0.972 | 0.818 | ||
| CLM5SP | [-] | 8.54 | 8.35 | 0.290 | 10.0 | 0.0375 | -0.186 | 0.743 | 0.725 | 0.726 | 0.688 | 0.973 | 0.946 | 0.804 |
Download Data |
Period Mean (original grids) [Pg yr-1] |
Model Period Mean (intersection) [Pg yr-1] |
Model Period Mean (complement) [Pg yr-1] |
Benchmark Period Mean (intersection) [Pg yr-1] |
Benchmark Period Mean (complement) [Pg yr-1] |
Bias [g m-2 d-1] |
RMSE [g m-2 d-1] |
Phase Shift [months] |
Bias Score [1] |
RMSE Score [1] |
Seasonal Cycle Score [1] |
Spatial Distribution Score [1] |
Overall Score [1] |
|||
|---|---|---|---|---|---|---|---|---|---|---|---|---|---|---|---|---|
| Benchmark | [-] | 8.37 | ||||||||||||||
| CLM4.5SP | [-] | 9.87 | 9.18 | 0.562 | 8.32 | 0.0454 | 0.867 | 1.58 | 1.17 | 0.554 | 0.475 | 0.837 | 0.952 | 0.658 | ||
| CLM4SP | [-] | 9.28 | 8.62 | 0.517 | 8.32 | 0.0454 | 0.629 | 1.60 | 1.37 | 0.493 | 0.451 | 0.827 | 0.905 | 0.625 | ||
| CLM5SP | [-] | 9.14 | 8.49 | 0.535 | 8.32 | 0.0454 | 0.561 | 1.48 | 1.19 | 0.549 | 0.493 | 0.847 | 0.955 | 0.667 |
Download Data |
Period Mean (original grids) [Pg yr-1] |
Model Period Mean (intersection) [Pg yr-1] |
Model Period Mean (complement) [Pg yr-1] |
Benchmark Period Mean (intersection) [Pg yr-1] |
Benchmark Period Mean (complement) [Pg yr-1] |
Bias [g m-2 d-1] |
RMSE [g m-2 d-1] |
Phase Shift [months] |
Bias Score [1] |
RMSE Score [1] |
Seasonal Cycle Score [1] |
Spatial Distribution Score [1] |
Overall Score [1] |
|||
|---|---|---|---|---|---|---|---|---|---|---|---|---|---|---|---|---|
| Benchmark | [-] | 1.28 | ||||||||||||||
| CLM4.5SP | [-] | 1.21 | 1.23 | 0.0230 | 1.28 | 0.00137 | -0.00735 | 0.701 | 0.0358 | 0.890 | 0.655 | 0.999 | 0.959 | 0.832 | ||
| CLM4SP | [-] | 1.43 | 1.45 | 0.0291 | 1.28 | 0.00137 | 0.175 | 0.918 | 0.0380 | 0.819 | 0.592 | 0.999 | 0.954 | 0.791 | ||
| CLM5SP | [-] | 1.28 | 1.30 | 0.0214 | 1.28 | 0.00137 | 0.0458 | 0.789 | 0.0908 | 0.873 | 0.620 | 0.996 | 0.968 | 0.816 |
Download Data |
Period Mean (original grids) [Pg yr-1] |
Model Period Mean (intersection) [Pg yr-1] |
Model Period Mean (complement) [Pg yr-1] |
Benchmark Period Mean (intersection) [Pg yr-1] |
Benchmark Period Mean (complement) [Pg yr-1] |
Bias [g m-2 d-1] |
RMSE [g m-2 d-1] |
Phase Shift [months] |
Bias Score [1] |
RMSE Score [1] |
Seasonal Cycle Score [1] |
Spatial Distribution Score [1] |
Overall Score [1] |
|||
|---|---|---|---|---|---|---|---|---|---|---|---|---|---|---|---|---|
| Benchmark | [-] | 3.53 | ||||||||||||||
| CLM4.5SP | [-] | 5.10 | 4.53 | 0.529 | 3.49 | 0.0402 | 0.613 | 1.03 | 1.31 | 0.479 | 0.331 | 0.895 | 0.736 | 0.554 | ||
| CLM4SP | [-] | 4.55 | 4.02 | 0.501 | 3.49 | 0.0402 | 0.418 | 0.881 | 1.53 | 0.491 | 0.373 | 0.871 | 0.761 | 0.574 | ||
| CLM5SP | [-] | 4.85 | 4.34 | 0.469 | 3.49 | 0.0402 | 0.534 | 0.929 | 1.42 | 0.475 | 0.386 | 0.886 | 0.803 | 0.587 |
Download Data |
Period Mean (original grids) [Pg yr-1] |
Model Period Mean (intersection) [Pg yr-1] |
Model Period Mean (complement) [Pg yr-1] |
Benchmark Period Mean (intersection) [Pg yr-1] |
Benchmark Period Mean (complement) [Pg yr-1] |
Bias [g m-2 d-1] |
RMSE [g m-2 d-1] |
Phase Shift [months] |
Bias Score [1] |
RMSE Score [1] |
Seasonal Cycle Score [1] |
Spatial Distribution Score [1] |
Overall Score [1] |
|||
|---|---|---|---|---|---|---|---|---|---|---|---|---|---|---|---|---|
| Benchmark | [-] | 5.29 | ||||||||||||||
| CLM4.5SP | [-] | 5.66 | 5.35 | 0.242 | 5.26 | 0.0312 | 0.444 | 1.46 | 0.265 | 0.812 | 0.608 | 0.982 | 0.970 | 0.796 | ||
| CLM4SP | [-] | 5.23 | 4.94 | 0.219 | 5.26 | 0.0312 | 0.208 | 1.28 | 0.297 | 0.769 | 0.684 | 0.982 | 0.914 | 0.807 | ||
| CLM5SP | [-] | 4.58 | 4.33 | 0.199 | 5.26 | 0.0312 | -0.138 | 1.20 | 0.250 | 0.762 | 0.693 | 0.984 | 0.836 | 0.794 |
Download Data |
Period Mean (original grids) [Pg yr-1] |
Model Period Mean (intersection) [Pg yr-1] |
Model Period Mean (complement) [Pg yr-1] |
Benchmark Period Mean (intersection) [Pg yr-1] |
Benchmark Period Mean (complement) [Pg yr-1] |
Bias [g m-2 d-1] |
RMSE [g m-2 d-1] |
Phase Shift [months] |
Bias Score [1] |
RMSE Score [1] |
Seasonal Cycle Score [1] |
Spatial Distribution Score [1] |
Overall Score [1] |
|||
|---|---|---|---|---|---|---|---|---|---|---|---|---|---|---|---|---|
| Benchmark | [-] | 119. | ||||||||||||||
| CLM4.5SP | [-] | 143. | 137. | 6.07 | 118. | 0.802 | 0.636 | 1.35 | 0.970 | 0.500 | 0.403 | 0.822 | 0.947 | 0.615 | ||
| CLM4SP | [-] | 148. | 142. | 5.89 | 118. | 0.802 | 0.745 | 1.43 | 1.14 | 0.444 | 0.397 | 0.773 | 0.906 | 0.583 | ||
| CLM5SP | [-] | 125. | 120. | 5.44 | 118. | 0.802 | 0.234 | 1.18 | 1.01 | 0.494 | 0.462 | 0.811 | 0.966 | 0.639 |
Download Data |
Period Mean (original grids) [Pg yr-1] |
Model Period Mean (intersection) [Pg yr-1] |
Model Period Mean (complement) [Pg yr-1] |
Benchmark Period Mean (intersection) [Pg yr-1] |
Benchmark Period Mean (complement) [Pg yr-1] |
Bias [g m-2 d-1] |
RMSE [g m-2 d-1] |
Phase Shift [months] |
Bias Score [1] |
RMSE Score [1] |
Seasonal Cycle Score [1] |
Spatial Distribution Score [1] |
Overall Score [1] |
|||
|---|---|---|---|---|---|---|---|---|---|---|---|---|---|---|---|---|
| Benchmark | [-] | 0.864 | ||||||||||||||
| CLM4.5SP | [-] | 0.999 | 0.954 | 0.0574 | 0.859 | 0.00579 | 0.0860 | 0.316 | 2.17 | 0.536 | 0.400 | 0.894 | 0.886 | 0.623 | ||
| CLM4SP | [-] | 0.890 | 0.850 | 0.0499 | 0.859 | 0.00579 | 0.0500 | 0.258 | 2.10 | 0.570 | 0.479 | 0.882 | 0.901 | 0.662 | ||
| CLM5SP | [-] | 0.865 | 0.827 | 0.0515 | 0.859 | 0.00579 | 0.0346 | 0.260 | 2.14 | 0.570 | 0.486 | 0.898 | 0.907 | 0.669 |
Download Data |
Period Mean (original grids) [Pg yr-1] |
Model Period Mean (intersection) [Pg yr-1] |
Model Period Mean (complement) [Pg yr-1] |
Benchmark Period Mean (intersection) [Pg yr-1] |
Benchmark Period Mean (complement) [Pg yr-1] |
Bias [g m-2 d-1] |
RMSE [g m-2 d-1] |
Phase Shift [months] |
Bias Score [1] |
RMSE Score [1] |
Seasonal Cycle Score [1] |
Spatial Distribution Score [1] |
Overall Score [1] |
|||
|---|---|---|---|---|---|---|---|---|---|---|---|---|---|---|---|---|
| Benchmark | [-] | 1.56 | ||||||||||||||
| CLM4.5SP | [-] | 1.81 | 1.74 | 0.0530 | 1.55 | 0.00323 | 0.133 | 0.604 | 0.224 | 0.822 | 0.544 | 0.993 | 0.934 | 0.767 | ||
| CLM4SP | [-] | 2.47 | 2.38 | 0.0609 | 1.55 | 0.00323 | 0.408 | 0.941 | 0.253 | 0.625 | 0.422 | 0.991 | 0.800 | 0.652 | ||
| CLM5SP | [-] | 1.65 | 1.59 | 0.0446 | 1.55 | 0.00323 | 0.0591 | 0.531 | 0.266 | 0.829 | 0.590 | 0.988 | 0.964 | 0.792 |
Download Data |
Period Mean (original grids) [Pg yr-1] |
Model Period Mean (intersection) [Pg yr-1] |
Model Period Mean (complement) [Pg yr-1] |
Benchmark Period Mean (intersection) [Pg yr-1] |
Benchmark Period Mean (complement) [Pg yr-1] |
Bias [g m-2 d-1] |
RMSE [g m-2 d-1] |
Phase Shift [months] |
Bias Score [1] |
RMSE Score [1] |
Seasonal Cycle Score [1] |
Spatial Distribution Score [1] |
Overall Score [1] |
|||
|---|---|---|---|---|---|---|---|---|---|---|---|---|---|---|---|---|
| Benchmark | [-] | 3.62 | ||||||||||||||
| CLM4.5SP | [-] | 4.55 | 3.94 | 0.526 | 3.60 | 0.0267 | 1.33 | 2.12 | 1.00 | 0.353 | 0.299 | 0.870 | 0.907 | 0.546 | ||
| CLM4SP | [-] | 4.36 | 3.82 | 0.462 | 3.60 | 0.0267 | 1.09 | 1.96 | 1.06 | 0.348 | 0.307 | 0.881 | 0.891 | 0.547 | ||
| CLM5SP | [-] | 4.02 | 3.45 | 0.494 | 3.60 | 0.0267 | 0.786 | 1.76 | 0.951 | 0.414 | 0.408 | 0.870 | 0.923 | 0.605 |
Download Data |
Period Mean (original grids) [Pg yr-1] |
Model Period Mean (intersection) [Pg yr-1] |
Model Period Mean (complement) [Pg yr-1] |
Benchmark Period Mean (intersection) [Pg yr-1] |
Benchmark Period Mean (complement) [Pg yr-1] |
Bias [g m-2 d-1] |
RMSE [g m-2 d-1] |
Phase Shift [months] |
Bias Score [1] |
RMSE Score [1] |
Seasonal Cycle Score [1] |
Spatial Distribution Score [1] |
Overall Score [1] |
|||
|---|---|---|---|---|---|---|---|---|---|---|---|---|---|---|---|---|
| Benchmark | [-] | 5.09 | ||||||||||||||
| CLM4.5SP | [-] | 6.15 | 5.87 | 0.166 | 5.09 | 0.00487 | 0.734 | 1.55 | 0.341 | 0.743 | 0.639 | 0.976 | 0.942 | 0.788 | ||
| CLM4SP | [-] | 6.18 | 5.93 | 0.159 | 5.09 | 0.00487 | 0.759 | 1.42 | 0.513 | 0.730 | 0.691 | 0.955 | 0.927 | 0.799 | ||
| CLM5SP | [-] | 4.74 | 4.53 | 0.129 | 5.09 | 0.00487 | -0.229 | 1.15 | 0.337 | 0.823 | 0.729 | 0.974 | 0.985 | 0.848 |
Download Data |
Period Mean (original grids) [Pg yr-1] |
Model Period Mean (intersection) [Pg yr-1] |
Model Period Mean (complement) [Pg yr-1] |
Benchmark Period Mean (intersection) [Pg yr-1] |
Benchmark Period Mean (complement) [Pg yr-1] |
Bias [g m-2 d-1] |
RMSE [g m-2 d-1] |
Phase Shift [months] |
Bias Score [1] |
RMSE Score [1] |
Seasonal Cycle Score [1] |
Spatial Distribution Score [1] |
Overall Score [1] |
|||
|---|---|---|---|---|---|---|---|---|---|---|---|---|---|---|---|---|
| Benchmark | [-] | 3.36 | ||||||||||||||
| CLM4.5SP | [-] | 4.31 | 4.27 | 0.0646 | 3.34 | 0.0222 | 0.596 | 1.37 | 0.110 | 0.715 | 0.553 | 0.992 | 0.961 | 0.755 | ||
| CLM4SP | [-] | 5.28 | 5.25 | 0.0845 | 3.34 | 0.0222 | 1.12 | 1.87 | 0.343 | 0.569 | 0.496 | 0.975 | 0.902 | 0.688 | ||
| CLM5SP | [-] | 3.71 | 3.68 | 0.0555 | 3.34 | 0.0222 | 0.273 | 0.991 | 0.115 | 0.777 | 0.657 | 0.992 | 0.960 | 0.809 |
Download Data |
Period Mean (original grids) [Pg yr-1] |
Model Period Mean (intersection) [Pg yr-1] |
Model Period Mean (complement) [Pg yr-1] |
Benchmark Period Mean (intersection) [Pg yr-1] |
Benchmark Period Mean (complement) [Pg yr-1] |
Bias [g m-2 d-1] |
RMSE [g m-2 d-1] |
Phase Shift [months] |
Bias Score [1] |
RMSE Score [1] |
Seasonal Cycle Score [1] |
Spatial Distribution Score [1] |
Overall Score [1] |
|||
|---|---|---|---|---|---|---|---|---|---|---|---|---|---|---|---|---|
| Benchmark | [-] | 1.79 | ||||||||||||||
| CLM4.5SP | [-] | 1.93 | 2.03 | 0.0143 | 1.79 | 0.00506 | 0.223 | 0.884 | 0.666 | 0.632 | 0.485 | 0.940 | 0.958 | 0.700 | ||
| CLM4SP | [-] | 1.87 | 1.93 | 0.0161 | 1.79 | 0.00506 | 0.163 | 0.723 | 0.712 | 0.683 | 0.554 | 0.941 | 0.934 | 0.733 | ||
| CLM5SP | [-] | 1.47 | 1.55 | 0.0115 | 1.79 | 0.00506 | -0.114 | 0.690 | 0.663 | 0.645 | 0.584 | 0.939 | 0.943 | 0.739 |
Download Data |
Period Mean (original grids) [Pg yr-1] |
Model Period Mean (intersection) [Pg yr-1] |
Model Period Mean (complement) [Pg yr-1] |
Benchmark Period Mean (intersection) [Pg yr-1] |
Benchmark Period Mean (complement) [Pg yr-1] |
Bias [g m-2 d-1] |
RMSE [g m-2 d-1] |
Phase Shift [months] |
Bias Score [1] |
RMSE Score [1] |
Seasonal Cycle Score [1] |
Spatial Distribution Score [1] |
Overall Score [1] |
|||
|---|---|---|---|---|---|---|---|---|---|---|---|---|---|---|---|---|
| Benchmark | [-] | 23.2 | ||||||||||||||
| CLM4.5SP | [-] | 23.9 | 23.6 | 0.195 | 23.2 | 0.0226 | 0.367 | 1.78 | 2.56 | 0.299 | 0.194 | 0.579 | 0.810 | 0.415 | ||
| CLM4SP | [-] | 29.9 | 29.6 | 0.200 | 23.2 | 0.0226 | 2.30 | 3.05 | 2.75 | 0.128 | 0.119 | 0.541 | 0.958 | 0.373 | ||
| CLM5SP | [-] | 21.8 | 21.5 | 0.185 | 23.2 | 0.0226 | -0.346 | 1.82 | 2.72 | 0.163 | 0.259 | 0.542 | 0.884 | 0.421 |
Download Data |
Period Mean (original grids) [Pg yr-1] |
Model Period Mean (intersection) [Pg yr-1] |
Model Period Mean (complement) [Pg yr-1] |
Benchmark Period Mean (intersection) [Pg yr-1] |
Benchmark Period Mean (complement) [Pg yr-1] |
Bias [g m-2 d-1] |
RMSE [g m-2 d-1] |
Phase Shift [months] |
Bias Score [1] |
RMSE Score [1] |
Seasonal Cycle Score [1] |
Spatial Distribution Score [1] |
Overall Score [1] |
|||
|---|---|---|---|---|---|---|---|---|---|---|---|---|---|---|---|---|
| Benchmark | [-] | 10.4 | ||||||||||||||
| CLM4.5SP | [-] | 13.6 | 13.4 | 0.364 | 10.4 | 0.00314 | 1.42 | 2.42 | 0.780 | 0.441 | 0.451 | 0.910 | 0.776 | 0.606 | ||
| CLM4SP | [-] | 12.0 | 11.9 | 0.330 | 10.4 | 0.00314 | 0.738 | 1.92 | 1.33 | 0.520 | 0.478 | 0.805 | 0.818 | 0.620 | ||
| CLM5SP | [-] | 11.6 | 11.5 | 0.317 | 10.4 | 0.00314 | 0.582 | 1.93 | 0.741 | 0.518 | 0.523 | 0.917 | 0.805 | 0.657 |
Download Data |
Period Mean (original grids) [Pg yr-1] |
Model Period Mean (intersection) [Pg yr-1] |
Model Period Mean (complement) [Pg yr-1] |
Benchmark Period Mean (intersection) [Pg yr-1] |
Benchmark Period Mean (complement) [Pg yr-1] |
Bias [g m-2 d-1] |
RMSE [g m-2 d-1] |
Phase Shift [months] |
Bias Score [1] |
RMSE Score [1] |
Seasonal Cycle Score [1] |
Spatial Distribution Score [1] |
Overall Score [1] |
|||
|---|---|---|---|---|---|---|---|---|---|---|---|---|---|---|---|---|
| Benchmark | [-] | 1.16 | ||||||||||||||
| CLM4.5SP | [-] | 1.32 | 1.23 | 0.0482 | 1.14 | 0.0148 | 0.248 | 0.751 | 1.29 | 0.487 | 0.453 | 0.882 | 0.924 | 0.640 | ||
| CLM4SP | [-] | 1.53 | 1.44 | 0.0566 | 1.14 | 0.0148 | 0.502 | 0.845 | 1.22 | 0.414 | 0.457 | 0.901 | 0.841 | 0.614 | ||
| CLM5SP | [-] | 1.08 | 0.998 | 0.0459 | 1.14 | 0.0148 | 0.0351 | 0.660 | 1.29 | 0.480 | 0.463 | 0.870 | 0.931 | 0.642 |
Temporally integrated period mean