Mean State
Download Data |
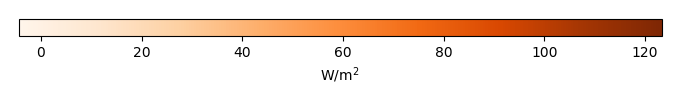
Period Mean (original grids) [W/m2] |
Model Period Mean (intersection) [W/m2] |
Model Period Mean (complement) [W/m2] |
Benchmark Period Mean (intersection) [W/m2] |
Benchmark Period Mean (complement) [W/m2] |
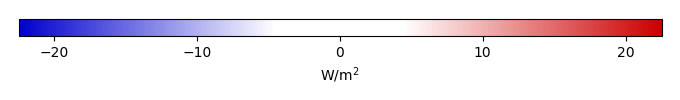
Bias [W/m2] |
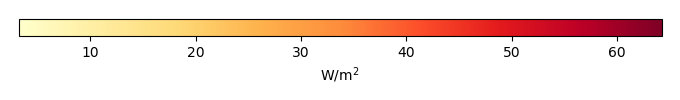
RMSE [W/m2] |
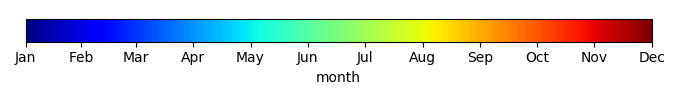
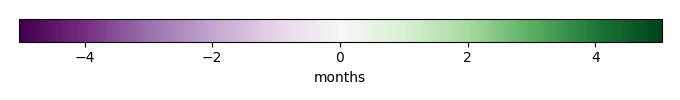
Phase Shift [months] |
Bias Score [1] |
RMSE Score [1] |
Seasonal Cycle Score [1] |
Spatial Distribution Score [1] |
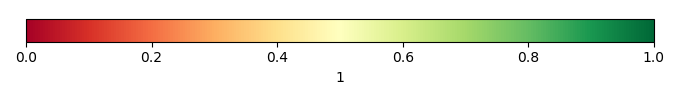
Overall Score [1] |
|||
|---|---|---|---|---|---|---|---|---|---|---|---|---|---|---|---|---|
| Benchmark | [-] | 70.6 | ||||||||||||||
| CLM4.5SP | [-] | 74.6 | 75.4 | 64.6 | 70.7 | 18.1 | 3.81 | 18.4 | 1.04 | 0.324 | 0.128 | 0.871 | 0.992 | 0.489 | ||
| CLM4SP | [-] | 83.0 | 83.6 | 73.0 | 70.7 | 18.1 | 12.1 | 23.3 | 1.46 | 0.250 | 0.106 | 0.784 | 0.976 | 0.444 | ||
| CLM5SP | [-] | 75.3 | 76.1 | 66.4 | 70.7 | 18.1 | 4.68 | 17.5 | 1.39 | 0.284 | 0.153 | 0.799 | 0.992 | 0.476 |
Download Data |
Period Mean (original grids) [W/m2] |
Model Period Mean (intersection) [W/m2] |
Model Period Mean (complement) [W/m2] |
Benchmark Period Mean (intersection) [W/m2] |
Benchmark Period Mean (complement) [W/m2] |
Bias [W/m2] |
RMSE [W/m2] |
Phase Shift [months] |
Bias Score [1] |
RMSE Score [1] |
Seasonal Cycle Score [1] |
Spatial Distribution Score [1] |
Overall Score [1] |
|||
|---|---|---|---|---|---|---|---|---|---|---|---|---|---|---|---|---|
| Benchmark | [-] | 47.3 | ||||||||||||||
| CLM4.5SP | [-] | 54.0 | 53.3 | 37.4 | 47.3 | 34.2 | 5.82 | 20.1 | 1.06 | 0.768 | 0.523 | 0.810 | 0.981 | 0.721 | ||
| CLM4SP | [-] | 54.5 | 53.8 | 42.3 | 47.3 | 34.2 | 6.37 | 19.8 | 1.10 | 0.747 | 0.534 | 0.793 | 0.989 | 0.720 | ||
| CLM5SP | [-] | 52.8 | 52.1 | 40.4 | 47.3 | 34.2 | 4.54 | 19.2 | 1.17 | 0.765 | 0.503 | 0.776 | 0.984 | 0.706 |
Download Data |
Period Mean (original grids) [W/m2] |
Model Period Mean (intersection) [W/m2] |
Model Period Mean (complement) [W/m2] |
Benchmark Period Mean (intersection) [W/m2] |
Benchmark Period Mean (complement) [W/m2] |
Bias [W/m2] |
RMSE [W/m2] |
Phase Shift [months] |
Bias Score [1] |
RMSE Score [1] |
Seasonal Cycle Score [1] |
Spatial Distribution Score [1] |
Overall Score [1] |
|||
|---|---|---|---|---|---|---|---|---|---|---|---|---|---|---|---|---|
| Benchmark | [-] | 52.1 | ||||||||||||||
| CLM4.5SP | [-] | 55.2 | 55.2 | 55.5 | 52.2 | 23.6 | 2.87 | 19.8 | 1.03 | 0.695 | 0.450 | 0.855 | 0.984 | 0.687 | ||
| CLM4SP | [-] | 57.4 | 57.2 | 59.1 | 52.2 | 23.6 | 4.88 | 20.2 | 1.27 | 0.667 | 0.459 | 0.783 | 0.977 | 0.669 | ||
| CLM5SP | [-] | 55.4 | 55.4 | 52.8 | 52.2 | 23.6 | 3.06 | 18.4 | 1.00 | 0.661 | 0.491 | 0.855 | 0.976 | 0.695 |
Download Data |
Period Mean (original grids) [W/m2] |
Model Period Mean (intersection) [W/m2] |
Model Period Mean (complement) [W/m2] |
Benchmark Period Mean (intersection) [W/m2] |
Benchmark Period Mean (complement) [W/m2] |
Bias [W/m2] |
RMSE [W/m2] |
Phase Shift [months] |
Bias Score [1] |
RMSE Score [1] |
Seasonal Cycle Score [1] |
Spatial Distribution Score [1] |
Overall Score [1] |
|||
|---|---|---|---|---|---|---|---|---|---|---|---|---|---|---|---|---|
| Benchmark | [-] | 14.9 | ||||||||||||||
| CLM4.5SP | [-] | 15.5 | 15.6 | 12.4 | 15.0 | 3.59 | 0.523 | 9.39 | 0.282 | 0.885 | 0.696 | 1.00 | 0.525 | 0.761 | ||
| CLM4SP | [-] | 13.4 | 13.5 | 12.4 | 15.0 | 3.59 | -1.44 | 10.4 | 0.0438 | 0.826 | 0.675 | 1.02 | 0.606 | 0.760 | ||
| CLM5SP | [-] | 14.0 | 14.2 | 10.9 | 15.0 | 3.59 | -0.908 | 10.2 | 0.179 | 0.882 | 0.657 | 1.01 | 0.510 | 0.743 |
Download Data |
Period Mean (original grids) [W/m2] |
Model Period Mean (intersection) [W/m2] |
Model Period Mean (complement) [W/m2] |
Benchmark Period Mean (intersection) [W/m2] |
Benchmark Period Mean (complement) [W/m2] |
Bias [W/m2] |
RMSE [W/m2] |
Phase Shift [months] |
Bias Score [1] |
RMSE Score [1] |
Seasonal Cycle Score [1] |
Spatial Distribution Score [1] |
Overall Score [1] |
|||
|---|---|---|---|---|---|---|---|---|---|---|---|---|---|---|---|---|
| Benchmark | [-] | 77.5 | ||||||||||||||
| CLM4.5SP | [-] | 103. | 103. | 102. | 80.4 | 34.5 | 22.6 | 28.9 | 2.32 | 0.247 | 0.125 | 0.629 | 0.243 | 0.274 | ||
| CLM4SP | [-] | 120. | 121. | 116. | 80.4 | 34.5 | 39.8 | 43.5 | 2.32 | 0.0494 | 0.0794 | 0.636 | 0.453 | 0.259 | ||
| CLM5SP | [-] | 104. | 103. | 105. | 80.4 | 34.5 | 23.2 | 27.9 | 2.19 | 0.254 | 0.174 | 0.659 | 0.291 | 0.310 |
Download Data |
Period Mean (original grids) [W/m2] |
Model Period Mean (intersection) [W/m2] |
Model Period Mean (complement) [W/m2] |
Benchmark Period Mean (intersection) [W/m2] |
Benchmark Period Mean (complement) [W/m2] |
Bias [W/m2] |
RMSE [W/m2] |
Phase Shift [months] |
Bias Score [1] |
RMSE Score [1] |
Seasonal Cycle Score [1] |
Spatial Distribution Score [1] |
Overall Score [1] |
|||
|---|---|---|---|---|---|---|---|---|---|---|---|---|---|---|---|---|
| Benchmark | [-] | 26.3 | ||||||||||||||
| CLM4.5SP | [-] | 26.2 | 26.1 | 28.2 | 26.3 | 3.49 | -0.149 | 8.57 | 0.239 | 0.922 | 0.754 | 0.983 | 0.990 | 0.881 | ||
| CLM4SP | [-] | 23.3 | 23.1 | 27.6 | 26.3 | 3.49 | -3.17 | 8.51 | 0.154 | 0.858 | 0.784 | 0.990 | 0.983 | 0.880 | ||
| CLM5SP | [-] | 24.7 | 24.7 | 24.3 | 26.3 | 3.49 | -1.63 | 11.0 | 0.526 | 0.901 | 0.695 | 0.965 | 0.977 | 0.847 |
Download Data |
Period Mean (original grids) [W/m2] |
Model Period Mean (intersection) [W/m2] |
Model Period Mean (complement) [W/m2] |
Benchmark Period Mean (intersection) [W/m2] |
Benchmark Period Mean (complement) [W/m2] |
Bias [W/m2] |
RMSE [W/m2] |
Phase Shift [months] |
Bias Score [1] |
RMSE Score [1] |
Seasonal Cycle Score [1] |
Spatial Distribution Score [1] |
Overall Score [1] |
|||
|---|---|---|---|---|---|---|---|---|---|---|---|---|---|---|---|---|
| Benchmark | [-] | 28.0 | ||||||||||||||
| CLM4.5SP | [-] | 28.5 | 28.8 | 21.8 | 28.1 | 13.0 | 1.13 | 12.7 | 0.668 | 0.759 | 0.637 | 0.963 | 0.957 | 0.791 | ||
| CLM4SP | [-] | 27.4 | 27.6 | 22.6 | 28.1 | 13.0 | -0.114 | 12.2 | 0.653 | 0.745 | 0.664 | 0.963 | 0.942 | 0.795 | ||
| CLM5SP | [-] | 25.1 | 25.3 | 19.4 | 28.1 | 13.0 | -2.36 | 11.0 | 0.487 | 0.722 | 0.698 | 0.974 | 0.923 | 0.803 |
Download Data |
Period Mean (original grids) [W/m2] |
Model Period Mean (intersection) [W/m2] |
Model Period Mean (complement) [W/m2] |
Benchmark Period Mean (intersection) [W/m2] |
Benchmark Period Mean (complement) [W/m2] |
Bias [W/m2] |
RMSE [W/m2] |
Phase Shift [months] |
Bias Score [1] |
RMSE Score [1] |
Seasonal Cycle Score [1] |
Spatial Distribution Score [1] |
Overall Score [1] |
|||
|---|---|---|---|---|---|---|---|---|---|---|---|---|---|---|---|---|
| Benchmark | [-] | 57.0 | ||||||||||||||
| CLM4.5SP | [-] | 58.1 | 57.3 | 72.1 | 57.2 | 29.3 | 2.21 | 21.9 | 1.16 | 0.592 | 0.428 | 0.855 | 0.968 | 0.654 | ||
| CLM4SP | [-] | 59.1 | 58.2 | 73.9 | 57.2 | 29.3 | 3.35 | 22.8 | 1.18 | 0.589 | 0.421 | 0.849 | 0.973 | 0.650 | ||
| CLM5SP | [-] | 60.2 | 59.5 | 74.6 | 57.2 | 29.3 | 4.46 | 22.0 | 1.27 | 0.603 | 0.412 | 0.819 | 0.975 | 0.644 |
Download Data |
Period Mean (original grids) [W/m2] |
Model Period Mean (intersection) [W/m2] |
Model Period Mean (complement) [W/m2] |
Benchmark Period Mean (intersection) [W/m2] |
Benchmark Period Mean (complement) [W/m2] |
Bias [W/m2] |
RMSE [W/m2] |
Phase Shift [months] |
Bias Score [1] |
RMSE Score [1] |
Seasonal Cycle Score [1] |
Spatial Distribution Score [1] |
Overall Score [1] |
|||
|---|---|---|---|---|---|---|---|---|---|---|---|---|---|---|---|---|
| Benchmark | [-] | 15.7 | ||||||||||||||
| CLM4.5SP | [-] | 12.8 | 13.1 | 7.98 | 15.8 | -6.07 | -2.76 | 10.9 | 0.0590 | 0.838 | 0.668 | 1.01 | 0.596 | 0.756 | ||
| CLM4SP | [-] | 12.8 | 13.0 | 9.09 | 15.8 | -6.07 | -2.79 | 12.1 | 0.0271 | 0.807 | 0.646 | 1.01 | 0.794 | 0.781 | ||
| CLM5SP | [-] | 14.7 | 15.1 | 8.46 | 15.8 | -6.07 | -0.918 | 14.1 | 0.159 | 0.895 | 0.562 | 1.00 | 0.743 | 0.753 |
Download Data |
Period Mean (original grids) [W/m2] |
Model Period Mean (intersection) [W/m2] |
Model Period Mean (complement) [W/m2] |
Benchmark Period Mean (intersection) [W/m2] |
Benchmark Period Mean (complement) [W/m2] |
Bias [W/m2] |
RMSE [W/m2] |
Phase Shift [months] |
Bias Score [1] |
RMSE Score [1] |
Seasonal Cycle Score [1] |
Spatial Distribution Score [1] |
Overall Score [1] |
|||
|---|---|---|---|---|---|---|---|---|---|---|---|---|---|---|---|---|
| Benchmark | [-] | 26.8 | ||||||||||||||
| CLM4.5SP | [-] | 34.2 | 33.4 | 51.1 | 26.9 | 19.3 | 7.86 | 17.0 | 0.529 | 0.635 | 0.408 | 0.946 | 0.939 | 0.667 | ||
| CLM4SP | [-] | 34.1 | 33.2 | 51.7 | 26.9 | 19.3 | 7.78 | 17.1 | 0.606 | 0.641 | 0.405 | 0.936 | 0.929 | 0.663 | ||
| CLM5SP | [-] | 32.7 | 31.8 | 49.8 | 26.9 | 19.3 | 6.45 | 13.7 | 0.512 | 0.665 | 0.507 | 0.951 | 0.912 | 0.709 |
Download Data |
Period Mean (original grids) [W/m2] |
Model Period Mean (intersection) [W/m2] |
Model Period Mean (complement) [W/m2] |
Benchmark Period Mean (intersection) [W/m2] |
Benchmark Period Mean (complement) [W/m2] |
Bias [W/m2] |
RMSE [W/m2] |
Phase Shift [months] |
Bias Score [1] |
RMSE Score [1] |
Seasonal Cycle Score [1] |
Spatial Distribution Score [1] |
Overall Score [1] |
|||
|---|---|---|---|---|---|---|---|---|---|---|---|---|---|---|---|---|
| Benchmark | [-] | 31.2 | ||||||||||||||
| CLM4.5SP | [-] | 34.7 | 34.7 | 35.6 | 31.7 | 9.65 | 3.12 | 13.1 | 0.392 | 0.819 | 0.669 | 0.974 | 0.808 | 0.788 | ||
| CLM4SP | [-] | 33.0 | 33.0 | 34.2 | 31.7 | 9.65 | 1.52 | 11.9 | 0.485 | 0.817 | 0.708 | 0.968 | 0.845 | 0.809 | ||
| CLM5SP | [-] | 33.8 | 33.9 | 32.9 | 31.7 | 9.65 | 2.09 | 12.3 | 0.303 | 0.827 | 0.687 | 0.982 | 0.854 | 0.807 |
Download Data |
Period Mean (original grids) [W/m2] |
Model Period Mean (intersection) [W/m2] |
Model Period Mean (complement) [W/m2] |
Benchmark Period Mean (intersection) [W/m2] |
Benchmark Period Mean (complement) [W/m2] |
Bias [W/m2] |
RMSE [W/m2] |
Phase Shift [months] |
Bias Score [1] |
RMSE Score [1] |
Seasonal Cycle Score [1] |
Spatial Distribution Score [1] |
Overall Score [1] |
|||
|---|---|---|---|---|---|---|---|---|---|---|---|---|---|---|---|---|
| Benchmark | [-] | 39.1 | ||||||||||||||
| CLM4.5SP | [-] | 36.2 | 43.1 | 8.02 | 39.4 | 16.4 | 4.03 | 15.8 | 0.835 | 0.629 | 0.426 | 0.870 | 0.979 | 0.666 | ||
| CLM4SP | [-] | 36.8 | 43.9 | 7.84 | 39.4 | 16.4 | 4.97 | 16.6 | 0.869 | 0.570 | 0.429 | 0.850 | 0.958 | 0.647 | ||
| CLM5SP | [-] | 35.0 | 41.6 | 7.58 | 39.4 | 16.4 | 2.55 | 14.6 | 0.783 | 0.619 | 0.455 | 0.869 | 0.976 | 0.675 |
Download Data |
Period Mean (original grids) [W/m2] |
Model Period Mean (intersection) [W/m2] |
Model Period Mean (complement) [W/m2] |
Benchmark Period Mean (intersection) [W/m2] |
Benchmark Period Mean (complement) [W/m2] |
Bias [W/m2] |
RMSE [W/m2] |
Phase Shift [months] |
Bias Score [1] |
RMSE Score [1] |
Seasonal Cycle Score [1] |
Spatial Distribution Score [1] |
Overall Score [1] |
|||
|---|---|---|---|---|---|---|---|---|---|---|---|---|---|---|---|---|
| Benchmark | [-] | 8.45 | ||||||||||||||
| CLM4.5SP | [-] | 8.66 | 14.4 | 3.44 | 8.47 | 5.81 | 6.32 | 13.2 | 1.47 | 0.554 | 0.338 | 0.899 | 0.927 | 0.611 | ||
| CLM4SP | [-] | 8.74 | 14.7 | 3.34 | 8.47 | 5.81 | 6.51 | 13.4 | 1.51 | 0.526 | 0.324 | 0.888 | 0.934 | 0.599 | ||
| CLM5SP | [-] | 7.81 | 13.0 | 3.16 | 8.47 | 5.81 | 4.84 | 9.53 | 1.06 | 0.606 | 0.451 | 0.939 | 0.924 | 0.674 |
Download Data |
Period Mean (original grids) [W/m2] |
Model Period Mean (intersection) [W/m2] |
Model Period Mean (complement) [W/m2] |
Benchmark Period Mean (intersection) [W/m2] |
Benchmark Period Mean (complement) [W/m2] |
Bias [W/m2] |
RMSE [W/m2] |
Phase Shift [months] |
Bias Score [1] |
RMSE Score [1] |
Seasonal Cycle Score [1] |
Spatial Distribution Score [1] |
Overall Score [1] |
|||
|---|---|---|---|---|---|---|---|---|---|---|---|---|---|---|---|---|
| Benchmark | [-] | 14.0 | ||||||||||||||
| CLM4.5SP | [-] | 16.5 | 16.9 | 10.2 | 14.0 | 1.27 | 2.49 | 11.9 | 0.289 | 0.846 | 0.618 | 0.989 | 0.674 | 0.749 | ||
| CLM4SP | [-] | 13.5 | 13.7 | 8.55 | 14.0 | 1.27 | -0.374 | 10.6 | 0.122 | 0.798 | 0.654 | 1.01 | 0.805 | 0.783 | ||
| CLM5SP | [-] | 14.1 | 14.5 | 7.03 | 14.0 | 1.27 | 0.0514 | 11.7 | 0.312 | 0.837 | 0.596 | 0.987 | 0.787 | 0.761 |
Download Data |
Period Mean (original grids) [W/m2] |
Model Period Mean (intersection) [W/m2] |
Model Period Mean (complement) [W/m2] |
Benchmark Period Mean (intersection) [W/m2] |
Benchmark Period Mean (complement) [W/m2] |
Bias [W/m2] |
RMSE [W/m2] |
Phase Shift [months] |
Bias Score [1] |
RMSE Score [1] |
Seasonal Cycle Score [1] |
Spatial Distribution Score [1] |
Overall Score [1] |
|||
|---|---|---|---|---|---|---|---|---|---|---|---|---|---|---|---|---|
| Benchmark | [-] | 50.4 | ||||||||||||||
| CLM4.5SP | [-] | 61.5 | 61.3 | 65.8 | 50.9 | 20.2 | 12.6 | 25.4 | 1.01 | 0.481 | 0.277 | 0.870 | 0.960 | 0.573 | ||
| CLM4SP | [-] | 64.8 | 64.4 | 70.8 | 50.9 | 20.2 | 16.1 | 28.1 | 1.05 | 0.422 | 0.268 | 0.868 | 0.923 | 0.550 | ||
| CLM5SP | [-] | 60.4 | 60.0 | 66.8 | 50.9 | 20.2 | 11.6 | 23.2 | 0.830 | 0.455 | 0.352 | 0.897 | 0.939 | 0.599 |
Download Data |
Period Mean (original grids) [W/m2] |
Model Period Mean (intersection) [W/m2] |
Model Period Mean (complement) [W/m2] |
Benchmark Period Mean (intersection) [W/m2] |
Benchmark Period Mean (complement) [W/m2] |
Bias [W/m2] |
RMSE [W/m2] |
Phase Shift [months] |
Bias Score [1] |
RMSE Score [1] |
Seasonal Cycle Score [1] |
Spatial Distribution Score [1] |
Overall Score [1] |
|||
|---|---|---|---|---|---|---|---|---|---|---|---|---|---|---|---|---|
| Benchmark | [-] | 49.7 | ||||||||||||||
| CLM4.5SP | [-] | 57.8 | 57.7 | 66.1 | 49.8 | 19.0 | 8.38 | 15.4 | 0.165 | 0.797 | 0.710 | 0.987 | 0.981 | 0.837 | ||
| CLM4SP | [-] | 56.5 | 56.1 | 69.6 | 49.8 | 19.0 | 6.84 | 13.9 | 0.181 | 0.836 | 0.747 | 0.984 | 0.946 | 0.852 | ||
| CLM5SP | [-] | 50.6 | 50.6 | 58.1 | 49.8 | 19.0 | 1.19 | 13.6 | 0.173 | 0.832 | 0.742 | 0.988 | 0.965 | 0.854 |
Download Data |
Period Mean (original grids) [W/m2] |
Model Period Mean (intersection) [W/m2] |
Model Period Mean (complement) [W/m2] |
Benchmark Period Mean (intersection) [W/m2] |
Benchmark Period Mean (complement) [W/m2] |
Bias [W/m2] |
RMSE [W/m2] |
Phase Shift [months] |
Bias Score [1] |
RMSE Score [1] |
Seasonal Cycle Score [1] |
Spatial Distribution Score [1] |
Overall Score [1] |
|||
|---|---|---|---|---|---|---|---|---|---|---|---|---|---|---|---|---|
| Benchmark | [-] | 25.2 | ||||||||||||||
| CLM4.5SP | [-] | 32.5 | 32.5 | 38.0 | 25.4 | 10.7 | 7.15 | 13.0 | 0.159 | 0.768 | 0.666 | 0.991 | 0.981 | 0.814 | ||
| CLM4SP | [-] | 27.2 | 27.1 | 42.0 | 25.4 | 10.7 | 1.94 | 9.87 | 0.0981 | 0.831 | 0.743 | 0.995 | 0.964 | 0.855 | ||
| CLM5SP | [-] | 28.0 | 28.0 | 32.7 | 25.4 | 10.7 | 2.61 | 11.4 | 0.132 | 0.843 | 0.672 | 0.992 | 0.970 | 0.830 |
Download Data |
Period Mean (original grids) [W/m2] |
Model Period Mean (intersection) [W/m2] |
Model Period Mean (complement) [W/m2] |
Benchmark Period Mean (intersection) [W/m2] |
Benchmark Period Mean (complement) [W/m2] |
Bias [W/m2] |
RMSE [W/m2] |
Phase Shift [months] |
Bias Score [1] |
RMSE Score [1] |
Seasonal Cycle Score [1] |
Spatial Distribution Score [1] |
Overall Score [1] |
|||
|---|---|---|---|---|---|---|---|---|---|---|---|---|---|---|---|---|
| Benchmark | [-] | 27.2 | ||||||||||||||
| CLM4.5SP | [-] | 30.1 | 30.5 | 33.8 | 27.2 | 14.3 | 3.47 | 13.8 | 0.829 | 0.716 | 0.505 | 0.909 | 0.983 | 0.723 | ||
| CLM4SP | [-] | 29.8 | 30.2 | 35.0 | 27.2 | 14.3 | 3.19 | 13.0 | 0.715 | 0.720 | 0.533 | 0.927 | 0.983 | 0.739 | ||
| CLM5SP | [-] | 24.7 | 25.1 | 31.2 | 27.2 | 14.3 | -1.91 | 9.79 | 0.527 | 0.748 | 0.640 | 0.957 | 0.958 | 0.789 |
Download Data |
Period Mean (original grids) [W/m2] |
Model Period Mean (intersection) [W/m2] |
Model Period Mean (complement) [W/m2] |
Benchmark Period Mean (intersection) [W/m2] |
Benchmark Period Mean (complement) [W/m2] |
Bias [W/m2] |
RMSE [W/m2] |
Phase Shift [months] |
Bias Score [1] |
RMSE Score [1] |
Seasonal Cycle Score [1] |
Spatial Distribution Score [1] |
Overall Score [1] |
|||
|---|---|---|---|---|---|---|---|---|---|---|---|---|---|---|---|---|
| Benchmark | [-] | 90.0 | ||||||||||||||
| CLM4.5SP | [-] | 95.0 | 95.1 | 86.7 | 90.2 | 27.7 | 4.52 | 18.0 | 1.88 | 0.419 | 0.125 | 0.729 | 0.926 | 0.465 | ||
| CLM4SP | [-] | 107. | 107. | 95.5 | 90.2 | 27.7 | 16.7 | 26.3 | 2.09 | 0.191 | 0.0940 | 0.694 | 0.984 | 0.411 | ||
| CLM5SP | [-] | 97.8 | 97.8 | 92.3 | 90.2 | 27.7 | 7.24 | 16.8 | 1.81 | 0.392 | 0.166 | 0.746 | 0.972 | 0.488 |
Download Data |
Period Mean (original grids) [W/m2] |
Model Period Mean (intersection) [W/m2] |
Model Period Mean (complement) [W/m2] |
Benchmark Period Mean (intersection) [W/m2] |
Benchmark Period Mean (complement) [W/m2] |
Bias [W/m2] |
RMSE [W/m2] |
Phase Shift [months] |
Bias Score [1] |
RMSE Score [1] |
Seasonal Cycle Score [1] |
Spatial Distribution Score [1] |
Overall Score [1] |
|||
|---|---|---|---|---|---|---|---|---|---|---|---|---|---|---|---|---|
| Benchmark | [-] | 69.7 | ||||||||||||||
| CLM4.5SP | [-] | 69.5 | 69.2 | 70.9 | 69.8 | 17.5 | -0.401 | 19.0 | 0.948 | 0.720 | 0.465 | 0.902 | 0.976 | 0.706 | ||
| CLM4SP | [-] | 70.0 | 69.6 | 74.0 | 69.8 | 17.5 | 0.0300 | 18.5 | 1.02 | 0.709 | 0.475 | 0.890 | 0.988 | 0.707 | ||
| CLM5SP | [-] | 67.6 | 67.3 | 68.9 | 69.8 | 17.5 | -2.30 | 18.8 | 0.851 | 0.688 | 0.485 | 0.912 | 0.978 | 0.709 |
Download Data |
Period Mean (original grids) [W/m2] |
Model Period Mean (intersection) [W/m2] |
Model Period Mean (complement) [W/m2] |
Benchmark Period Mean (intersection) [W/m2] |
Benchmark Period Mean (complement) [W/m2] |
Bias [W/m2] |
RMSE [W/m2] |
Phase Shift [months] |
Bias Score [1] |
RMSE Score [1] |
Seasonal Cycle Score [1] |
Spatial Distribution Score [1] |
Overall Score [1] |
|||
|---|---|---|---|---|---|---|---|---|---|---|---|---|---|---|---|---|
| Benchmark | [-] | 22.7 | ||||||||||||||
| CLM4.5SP | [-] | 29.4 | 29.7 | 16.8 | 23.0 | 8.02 | 6.19 | 16.9 | 1.41 | 0.498 | 0.346 | 0.839 | 0.940 | 0.594 | ||
| CLM4SP | [-] | 30.8 | 31.1 | 18.1 | 23.0 | 8.02 | 7.91 | 17.9 | 1.35 | 0.460 | 0.332 | 0.847 | 0.902 | 0.575 | ||
| CLM5SP | [-] | 24.8 | 25.1 | 14.3 | 23.0 | 8.02 | 1.94 | 11.5 | 0.939 | 0.547 | 0.478 | 0.908 | 0.954 | 0.673 |
Temporally integrated period mean