Mean State
Download Data |
Period Mean (original grids) [Watt/m2] |
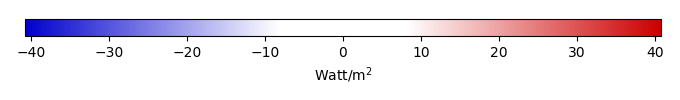
Bias [Watt/m2] |
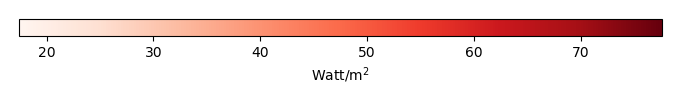
RMSE [Watt/m2] |
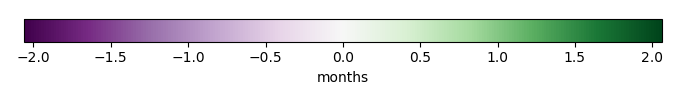
Phase Shift [months] |
Bias Score [1] |
RMSE Score [1] |
Seasonal Cycle Score [1] |
Interannual Variability Score [1] |
Overall Score [1] |
|||
|---|---|---|---|---|---|---|---|---|---|---|---|---|
| Benchmark | [-] | 131. | ||||||||||
| CLM4.5SP | [-] | 97.5 | -39.0 | 42.9 | 0.00 | 0.118 | 0.567 | 1.00 | 0.739 | 0.598 | ||
| CLM4SP | [-] | 95.8 | -44.5 | 47.5 | 0.00 | 0.0963 | 0.597 | 1.00 | 0.810 | 0.620 | ||
| CLM5SP | [-] | 95.7 | -39.8 | 43.5 | 0.00 | 0.115 | 0.571 | 1.00 | 0.734 | 0.598 |
Download Data |
Period Mean (original grids) [Watt/m2] |
Bias [Watt/m2] |
RMSE [Watt/m2] |
Phase Shift [months] |
Bias Score [1] |
RMSE Score [1] |
Seasonal Cycle Score [1] |
Interannual Variability Score [1] |
Overall Score [1] |
|||
|---|---|---|---|---|---|---|---|---|---|---|---|---|
| Benchmark | [-] | 54.1 | ||||||||||
| CLM4.5SP | [-] | 25.6 | -28.5 | 25.5 | 0.00 | 0.574 | 0.570 | 1.00 | 0.949 | 0.732 | ||
| CLM4SP | [-] | 25.4 | -28.7 | 24.2 | 0.00 | 0.572 | 0.626 | 1.00 | 0.979 | 0.760 | ||
| CLM5SP | [-] | 23.6 | -30.4 | 27.2 | 0.00 | 0.552 | 0.560 | 1.00 | 0.930 | 0.721 |
Download Data |
Period Mean (original grids) [Watt/m2] |
Bias [Watt/m2] |
RMSE [Watt/m2] |
Phase Shift [months] |
Bias Score [1] |
RMSE Score [1] |
Seasonal Cycle Score [1] |
Interannual Variability Score [1] |
Overall Score [1] |
|||
|---|---|---|---|---|---|---|---|---|---|---|---|---|
| Benchmark | [-] | 147. | ||||||||||
| CLM4.5SP | [-] | 135. | -11.3 | 25.5 | 4.08 | 0.548 | 0.286 | 0.244 | 0.686 | 0.410 | ||
| CLM4SP | [-] | 136. | -10.4 | 25.4 | 4.08 | 0.577 | 0.283 | 0.244 | 0.695 | 0.416 | ||
| CLM5SP | [-] | 134. | -13.1 | 26.2 | 4.08 | 0.500 | 0.286 | 0.244 | 0.683 | 0.400 |
Download Data |
Period Mean (original grids) [Watt/m2] |
Bias [Watt/m2] |
RMSE [Watt/m2] |
Phase Shift [months] |
Bias Score [1] |
RMSE Score [1] |
Seasonal Cycle Score [1] |
Interannual Variability Score [1] |
Overall Score [1] |
|||
|---|---|---|---|---|---|---|---|---|---|---|---|---|
| Benchmark | [-] | 42.7 | ||||||||||
| CLM4.5SP | [-] | 47.5 | 6.05 | 34.3 | 0.00 | 0.444 | 0.519 | 1.00 | 0.402 | 0.577 | ||
| CLM4SP | [-] | 50.4 | 10.1 | 35.7 | 0.00 | 0.410 | 0.516 | 1.00 | 0.399 | 0.568 | ||
| CLM5SP | [-] | 44.1 | 2.13 | 34.2 | 0.00 | 0.480 | 0.514 | 1.00 | 0.391 | 0.580 |
Download Data |
Period Mean (original grids) [Watt/m2] |
Bias [Watt/m2] |
RMSE [Watt/m2] |
Phase Shift [months] |
Bias Score [1] |
RMSE Score [1] |
Seasonal Cycle Score [1] |
Interannual Variability Score [1] |
Overall Score [1] |
|||
|---|---|---|---|---|---|---|---|---|---|---|---|---|
| Benchmark | [-] | 119. | ||||||||||
| CLM4.5SP | [-] | 120. | 1.48 | 16.4 | 0.00 | 0.883 | 0.646 | 1.00 | 0.917 | 0.819 | ||
| CLM4SP | [-] | 120. | 1.58 | 16.0 | 0.00 | 0.904 | 0.650 | 1.00 | 0.911 | 0.823 | ||
| CLM5SP | [-] | 120. | 1.21 | 16.1 | 0.00 | 0.905 | 0.646 | 1.00 | 0.874 | 0.814 |
Download Data |
Period Mean (original grids) [Watt/m2] |
Bias [Watt/m2] |
RMSE [Watt/m2] |
Phase Shift [months] |
Bias Score [1] |
RMSE Score [1] |
Seasonal Cycle Score [1] |
Interannual Variability Score [1] |
Overall Score [1] |
|||
|---|---|---|---|---|---|---|---|---|---|---|---|---|
| Benchmark | [-] | 67.2 | ||||||||||
| CLM4.5SP | [-] | 61.1 | -6.75 | 25.7 | 0.259 | 0.760 | 0.700 | 0.981 | 0.859 | 0.800 | ||
| CLM4SP | [-] | 62.8 | -5.03 | 25.4 | 0.259 | 0.768 | 0.699 | 0.981 | 0.858 | 0.801 | ||
| CLM5SP | [-] | 59.7 | -8.15 | 26.6 | 0.259 | 0.748 | 0.695 | 0.981 | 0.855 | 0.794 |
Download Data |
Period Mean (original grids) [Watt/m2] |
Bias [Watt/m2] |
RMSE [Watt/m2] |
Phase Shift [months] |
Bias Score [1] |
RMSE Score [1] |
Seasonal Cycle Score [1] |
Interannual Variability Score [1] |
Overall Score [1] |
|||
|---|---|---|---|---|---|---|---|---|---|---|---|---|
| Benchmark | [-] | 74.8 | ||||||||||
| CLM4.5SP | [-] | 69.7 | -5.54 | 25.7 | 0.377 | 0.751 | 0.688 | 0.962 | 0.854 | 0.789 | ||
| CLM4SP | [-] | 72.2 | -2.97 | 25.2 | 0.407 | 0.764 | 0.690 | 0.960 | 0.856 | 0.792 | ||
| CLM5SP | [-] | 67.9 | -7.24 | 26.3 | 0.377 | 0.743 | 0.686 | 0.962 | 0.850 | 0.785 |
Download Data |
Period Mean (original grids) [Watt/m2] |
Bias [Watt/m2] |
RMSE [Watt/m2] |
Phase Shift [months] |
Bias Score [1] |
RMSE Score [1] |
Seasonal Cycle Score [1] |
Interannual Variability Score [1] |
Overall Score [1] |
|||
|---|---|---|---|---|---|---|---|---|---|---|---|---|
| Benchmark | [-] | 117. | ||||||||||
| CLM4.5SP | [-] | 63.1 | -54.0 | 61.2 | 0.00 | 0.370 | 0.573 | 1.00 | 0.662 | 0.635 | ||
| CLM4SP | [-] | 83.8 | -33.2 | 40.5 | 0.00 | 0.542 | 0.636 | 1.00 | 0.747 | 0.712 | ||
| CLM5SP | [-] | 64.3 | -52.8 | 57.7 | 0.00 | 0.378 | 0.625 | 1.00 | 0.718 | 0.669 |
Download Data |
Period Mean (original grids) [Watt/m2] |
Bias [Watt/m2] |
RMSE [Watt/m2] |
Phase Shift [months] |
Bias Score [1] |
RMSE Score [1] |
Seasonal Cycle Score [1] |
Interannual Variability Score [1] |
Overall Score [1] |
|||
|---|---|---|---|---|---|---|---|---|---|---|---|---|
| Benchmark | [-] | 85.0 | ||||||||||
| CLM4.5SP | [-] | 84.9 | 0.255 | 26.0 | 0.662 | 0.809 | 0.682 | 0.939 | 0.854 | 0.793 | ||
| CLM4SP | [-] | 88.1 | 3.26 | 26.2 | 0.814 | 0.814 | 0.684 | 0.928 | 0.853 | 0.793 | ||
| CLM5SP | [-] | 82.9 | -1.79 | 26.0 | 0.662 | 0.807 | 0.681 | 0.939 | 0.847 | 0.791 |
Download Data |
Period Mean (original grids) [Watt/m2] |
Bias [Watt/m2] |
RMSE [Watt/m2] |
Phase Shift [months] |
Bias Score [1] |
RMSE Score [1] |
Seasonal Cycle Score [1] |
Interannual Variability Score [1] |
Overall Score [1] |
|||
|---|---|---|---|---|---|---|---|---|---|---|---|---|
| Benchmark | [-] | 68.6 | ||||||||||
| CLM4.5SP | [-] | 63.4 | -5.27 | 20.0 | 0.218 | 0.851 | 0.739 | 0.986 | 0.926 | 0.848 | ||
| CLM4SP | [-] | 68.6 | -0.00725 | 19.2 | 0.218 | 0.891 | 0.742 | 0.986 | 0.933 | 0.859 | ||
| CLM5SP | [-] | 60.3 | -8.28 | 20.7 | 0.218 | 0.837 | 0.737 | 0.986 | 0.926 | 0.845 |
Download Data |
Period Mean (original grids) [Watt/m2] |
Bias [Watt/m2] |
RMSE [Watt/m2] |
Phase Shift [months] |
Bias Score [1] |
RMSE Score [1] |
Seasonal Cycle Score [1] |
Interannual Variability Score [1] |
Overall Score [1] |
|||
|---|---|---|---|---|---|---|---|---|---|---|---|---|
| Benchmark | [-] | 82.6 | ||||||||||
| CLM4.5SP | [-] | 79.0 | -3.67 | 28.5 | 0.681 | 0.667 | 0.736 | 0.904 | 0.881 | 0.785 | ||
| CLM4SP | [-] | 81.1 | -1.53 | 26.9 | 0.681 | 0.680 | 0.743 | 0.904 | 0.897 | 0.793 | ||
| CLM5SP | [-] | 78.6 | -4.07 | 28.9 | 0.681 | 0.661 | 0.736 | 0.904 | 0.880 | 0.783 |
Download Data |
Period Mean (original grids) [Watt/m2] |
Bias [Watt/m2] |
RMSE [Watt/m2] |
Phase Shift [months] |
Bias Score [1] |
RMSE Score [1] |
Seasonal Cycle Score [1] |
Interannual Variability Score [1] |
Overall Score [1] |
|||
|---|---|---|---|---|---|---|---|---|---|---|---|---|
| Benchmark | [-] | 117. | ||||||||||
| CLM4.5SP | [-] | 137. | 20.0 | 39.8 | 0.00 | 0.555 | 0.390 | 1.00 | 0.641 | 0.595 | ||
| CLM4SP | [-] | 137. | 20.9 | 40.1 | 0.00 | 0.540 | 0.393 | 1.00 | 0.612 | 0.588 | ||
| CLM5SP | [-] | 133. | 16.5 | 37.7 | 0.00 | 0.615 | 0.389 | 1.00 | 0.628 | 0.604 |
Temporally integrated period mean