Mean State
Download Data |
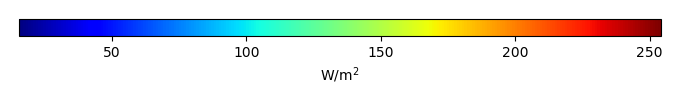
Period Mean (original grids) [W/m2] |
Model Period Mean (intersection) [W/m2] |
Model Period Mean (complement) [W/m2] |
Benchmark Period Mean (intersection) [W/m2] |
Benchmark Period Mean (complement) [W/m2] |
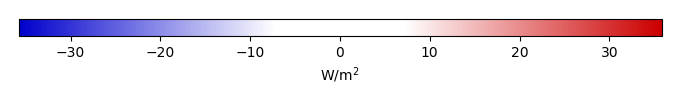
Bias [W/m2] |
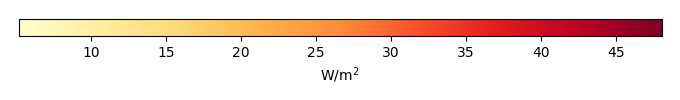
RMSE [W/m2] |
Phase Shift [months] |
Bias Score [1] |
RMSE Score [1] |
Seasonal Cycle Score [1] |
Spatial Distribution Score [1] |
Interannual Variability Score [1] |
Overall Score [1] |
|||
|---|---|---|---|---|---|---|---|---|---|---|---|---|---|---|---|---|---|
| Benchmark | [-] | 187. | |||||||||||||||
| CLM4.5SP | [-] | 181. | 181. | 186. | 206. | -4.80 | 15.5 | 0.729 | 0.719 | 0.498 | 0.915 | 0.911 | 0.802 | 0.724 | |||
| CLM4SP | [-] | 183. | 183. | 186. | 206. | -3.07 | 14.7 | 0.757 | 0.748 | 0.497 | 0.911 | 0.937 | 0.804 | 0.732 | |||
| CLM5SP | [-] | 182. | 182. | 186. | 206. | -4.31 | 15.3 | 0.775 | 0.727 | 0.494 | 0.907 | 0.924 | 0.800 | 0.724 |
Download Data |
Period Mean (original grids) [W/m2] |
Model Period Mean (intersection) [W/m2] |
Model Period Mean (complement) [W/m2] |
Benchmark Period Mean (intersection) [W/m2] |
Benchmark Period Mean (complement) [W/m2] |
Bias [W/m2] |
RMSE [W/m2] |
Phase Shift [months] |
Bias Score [1] |
RMSE Score [1] |
Seasonal Cycle Score [1] |
Spatial Distribution Score [1] |
Interannual Variability Score [1] |
Overall Score [1] |
|||
|---|---|---|---|---|---|---|---|---|---|---|---|---|---|---|---|---|---|
| Benchmark | [-] | 198. | |||||||||||||||
| CLM4.5SP | [-] | 194. | 194. | 198. | 214. | -3.89 | 14.2 | 0.662 | 0.714 | 0.519 | 0.929 | 0.984 | 0.833 | 0.749 | |||
| CLM4SP | [-] | 195. | 196. | 198. | 214. | -2.13 | 13.8 | 0.637 | 0.714 | 0.524 | 0.932 | 0.939 | 0.837 | 0.745 | |||
| CLM5SP | [-] | 194. | 194. | 198. | 214. | -3.39 | 14.2 | 0.702 | 0.718 | 0.513 | 0.923 | 0.979 | 0.833 | 0.747 |
Download Data |
Period Mean (original grids) [W/m2] |
Model Period Mean (intersection) [W/m2] |
Model Period Mean (complement) [W/m2] |
Benchmark Period Mean (intersection) [W/m2] |
Benchmark Period Mean (complement) [W/m2] |
Bias [W/m2] |
RMSE [W/m2] |
Phase Shift [months] |
Bias Score [1] |
RMSE Score [1] |
Seasonal Cycle Score [1] |
Spatial Distribution Score [1] |
Interannual Variability Score [1] |
Overall Score [1] |
|||
|---|---|---|---|---|---|---|---|---|---|---|---|---|---|---|---|---|---|
| Benchmark | [-] | 199. | |||||||||||||||
| CLM4.5SP | [-] | 196. | 196. | 198. | 219. | -2.92 | 15.5 | 0.777 | 0.799 | 0.571 | 0.892 | 0.995 | 0.743 | 0.762 | |||
| CLM4SP | [-] | 197. | 197. | 198. | 219. | -1.79 | 15.1 | 0.808 | 0.808 | 0.571 | 0.888 | 0.991 | 0.745 | 0.762 | |||
| CLM5SP | [-] | 196. | 197. | 198. | 219. | -2.35 | 15.5 | 0.774 | 0.801 | 0.568 | 0.893 | 0.995 | 0.744 | 0.762 |
Download Data |
Period Mean (original grids) [W/m2] |
Model Period Mean (intersection) [W/m2] |
Model Period Mean (complement) [W/m2] |
Benchmark Period Mean (intersection) [W/m2] |
Benchmark Period Mean (complement) [W/m2] |
Bias [W/m2] |
RMSE [W/m2] |
Phase Shift [months] |
Bias Score [1] |
RMSE Score [1] |
Seasonal Cycle Score [1] |
Spatial Distribution Score [1] |
Interannual Variability Score [1] |
Overall Score [1] |
|||
|---|---|---|---|---|---|---|---|---|---|---|---|---|---|---|---|---|---|
| Benchmark | [-] | 70.7 | |||||||||||||||
| CLM4.5SP | [-] | 71.1 | 71.2 | 70.5 | 72.8 | 0.124 | 18.6 | 0.302 | 0.933 | 0.760 | 0.980 | 0.998 | 0.768 | 0.867 | |||
| CLM4SP | [-] | 70.0 | 70.2 | 70.5 | 72.8 | -0.718 | 19.8 | 0.331 | 0.911 | 0.752 | 0.978 | 0.996 | 0.815 | 0.867 | |||
| CLM5SP | [-] | 70.3 | 70.4 | 70.5 | 72.8 | -0.648 | 18.5 | 0.319 | 0.934 | 0.761 | 0.979 | 0.998 | 0.763 | 0.866 |
Download Data |
Period Mean (original grids) [W/m2] |
Model Period Mean (intersection) [W/m2] |
Model Period Mean (complement) [W/m2] |
Benchmark Period Mean (intersection) [W/m2] |
Benchmark Period Mean (complement) [W/m2] |
Bias [W/m2] |
RMSE [W/m2] |
Phase Shift [months] |
Bias Score [1] |
RMSE Score [1] |
Seasonal Cycle Score [1] |
Spatial Distribution Score [1] |
Interannual Variability Score [1] |
Overall Score [1] |
|||
|---|---|---|---|---|---|---|---|---|---|---|---|---|---|---|---|---|---|
| Benchmark | [-] | 194. | |||||||||||||||
| CLM4.5SP | [-] | 176. | 176. | 190. | 207. | -10.3 | 18.7 | 1.27 | 0.568 | 0.436 | 0.800 | 0.962 | 0.768 | 0.662 | |||
| CLM4SP | [-] | 176. | 176. | 190. | 207. | -9.44 | 18.3 | 1.26 | 0.586 | 0.436 | 0.801 | 0.977 | 0.769 | 0.667 | |||
| CLM5SP | [-] | 176. | 176. | 190. | 207. | -10.3 | 18.7 | 1.27 | 0.569 | 0.436 | 0.800 | 0.963 | 0.769 | 0.662 |
Download Data |
Period Mean (original grids) [W/m2] |
Model Period Mean (intersection) [W/m2] |
Model Period Mean (complement) [W/m2] |
Benchmark Period Mean (intersection) [W/m2] |
Benchmark Period Mean (complement) [W/m2] |
Bias [W/m2] |
RMSE [W/m2] |
Phase Shift [months] |
Bias Score [1] |
RMSE Score [1] |
Seasonal Cycle Score [1] |
Spatial Distribution Score [1] |
Interannual Variability Score [1] |
Overall Score [1] |
|||
|---|---|---|---|---|---|---|---|---|---|---|---|---|---|---|---|---|---|
| Benchmark | [-] | 97.8 | |||||||||||||||
| CLM4.5SP | [-] | 103. | 103. | 97.6 | 118. | 5.28 | 15.2 | 0.231 | 0.916 | 0.823 | 0.985 | 0.997 | 0.662 | 0.868 | |||
| CLM4SP | [-] | 105. | 105. | 97.6 | 118. | 7.60 | 16.8 | 0.226 | 0.886 | 0.818 | 0.985 | 0.996 | 0.670 | 0.862 | |||
| CLM5SP | [-] | 102. | 102. | 97.6 | 118. | 4.51 | 14.6 | 0.227 | 0.926 | 0.827 | 0.985 | 0.995 | 0.668 | 0.871 |
Download Data |
Period Mean (original grids) [W/m2] |
Model Period Mean (intersection) [W/m2] |
Model Period Mean (complement) [W/m2] |
Benchmark Period Mean (intersection) [W/m2] |
Benchmark Period Mean (complement) [W/m2] |
Bias [W/m2] |
RMSE [W/m2] |
Phase Shift [months] |
Bias Score [1] |
RMSE Score [1] |
Seasonal Cycle Score [1] |
Spatial Distribution Score [1] |
Interannual Variability Score [1] |
Overall Score [1] |
|||
|---|---|---|---|---|---|---|---|---|---|---|---|---|---|---|---|---|---|
| Benchmark | [-] | 139. | |||||||||||||||
| CLM4.5SP | [-] | 134. | 134. | 138. | 149. | -4.05 | 16.3 | 0.330 | 0.866 | 0.770 | 0.971 | 0.996 | 0.659 | 0.838 | |||
| CLM4SP | [-] | 134. | 134. | 138. | 149. | -3.71 | 16.9 | 0.347 | 0.862 | 0.763 | 0.970 | 0.993 | 0.663 | 0.836 | |||
| CLM5SP | [-] | 136. | 136. | 138. | 149. | -2.20 | 15.9 | 0.348 | 0.880 | 0.767 | 0.970 | 0.999 | 0.670 | 0.842 |
Download Data |
Period Mean (original grids) [W/m2] |
Model Period Mean (intersection) [W/m2] |
Model Period Mean (complement) [W/m2] |
Benchmark Period Mean (intersection) [W/m2] |
Benchmark Period Mean (complement) [W/m2] |
Bias [W/m2] |
RMSE [W/m2] |
Phase Shift [months] |
Bias Score [1] |
RMSE Score [1] |
Seasonal Cycle Score [1] |
Spatial Distribution Score [1] |
Interannual Variability Score [1] |
Overall Score [1] |
|||
|---|---|---|---|---|---|---|---|---|---|---|---|---|---|---|---|---|---|
| Benchmark | [-] | 181. | |||||||||||||||
| CLM4.5SP | [-] | 174. | 174. | 179. | 205. | -3.76 | 18.2 | 0.329 | 0.770 | 0.611 | 0.973 | 0.964 | 0.721 | 0.775 | |||
| CLM4SP | [-] | 175. | 174. | 179. | 205. | -3.10 | 18.1 | 0.332 | 0.779 | 0.611 | 0.973 | 0.979 | 0.725 | 0.780 | |||
| CLM5SP | [-] | 175. | 175. | 179. | 205. | -3.00 | 18.1 | 0.342 | 0.776 | 0.609 | 0.973 | 0.946 | 0.723 | 0.772 |
Download Data |
Period Mean (original grids) [W/m2] |
Model Period Mean (intersection) [W/m2] |
Model Period Mean (complement) [W/m2] |
Benchmark Period Mean (intersection) [W/m2] |
Benchmark Period Mean (complement) [W/m2] |
Bias [W/m2] |
RMSE [W/m2] |
Phase Shift [months] |
Bias Score [1] |
RMSE Score [1] |
Seasonal Cycle Score [1] |
Spatial Distribution Score [1] |
Interannual Variability Score [1] |
Overall Score [1] |
|||
|---|---|---|---|---|---|---|---|---|---|---|---|---|---|---|---|---|---|
| Benchmark | [-] | 62.8 | |||||||||||||||
| CLM4.5SP | [-] | 61.8 | 62.2 | 63.2 | 54.4 | -1.94 | 16.1 | 0.147 | 0.945 | 0.780 | 0.990 | 0.983 | 0.760 | 0.873 | |||
| CLM4SP | [-] | 62.2 | 62.6 | 63.2 | 54.4 | -1.31 | 16.8 | 0.201 | 0.936 | 0.774 | 0.987 | 0.961 | 0.801 | 0.872 | |||
| CLM5SP | [-] | 61.3 | 61.7 | 63.2 | 54.4 | -2.47 | 16.4 | 0.176 | 0.941 | 0.777 | 0.988 | 0.984 | 0.759 | 0.871 |
Download Data |
Period Mean (original grids) [W/m2] |
Model Period Mean (intersection) [W/m2] |
Model Period Mean (complement) [W/m2] |
Benchmark Period Mean (intersection) [W/m2] |
Benchmark Period Mean (complement) [W/m2] |
Bias [W/m2] |
RMSE [W/m2] |
Phase Shift [months] |
Bias Score [1] |
RMSE Score [1] |
Seasonal Cycle Score [1] |
Spatial Distribution Score [1] |
Interannual Variability Score [1] |
Overall Score [1] |
|||
|---|---|---|---|---|---|---|---|---|---|---|---|---|---|---|---|---|---|
| Benchmark | [-] | 198. | |||||||||||||||
| CLM4.5SP | [-] | 189. | 189. | 198. | 197. | -10.3 | 17.2 | 0.349 | 0.802 | 0.767 | 0.974 | 0.999 | 0.708 | 0.836 | |||
| CLM4SP | [-] | 193. | 193. | 198. | 197. | -6.46 | 14.7 | 0.333 | 0.859 | 0.771 | 0.975 | 0.999 | 0.722 | 0.850 | |||
| CLM5SP | [-] | 190. | 190. | 198. | 197. | -9.01 | 16.6 | 0.371 | 0.822 | 0.764 | 0.971 | 1.00 | 0.706 | 0.838 |
Download Data |
Period Mean (original grids) [W/m2] |
Model Period Mean (intersection) [W/m2] |
Model Period Mean (complement) [W/m2] |
Benchmark Period Mean (intersection) [W/m2] |
Benchmark Period Mean (complement) [W/m2] |
Bias [W/m2] |
RMSE [W/m2] |
Phase Shift [months] |
Bias Score [1] |
RMSE Score [1] |
Seasonal Cycle Score [1] |
Spatial Distribution Score [1] |
Interannual Variability Score [1] |
Overall Score [1] |
|||
|---|---|---|---|---|---|---|---|---|---|---|---|---|---|---|---|---|---|
| Benchmark | [-] | 120. | |||||||||||||||
| CLM4.5SP | [-] | 113. | 113. | 118. | 145. | -1.80 | 13.4 | 0.215 | 0.924 | 0.840 | 0.986 | 0.992 | 0.657 | 0.873 | |||
| CLM4SP | [-] | 115. | 115. | 118. | 145. | 0.0366 | 13.7 | 0.223 | 0.922 | 0.837 | 0.985 | 0.996 | 0.663 | 0.873 | |||
| CLM5SP | [-] | 114. | 114. | 118. | 145. | -1.47 | 13.2 | 0.209 | 0.926 | 0.841 | 0.986 | 0.993 | 0.658 | 0.874 |
Download Data |
Period Mean (original grids) [W/m2] |
Model Period Mean (intersection) [W/m2] |
Model Period Mean (complement) [W/m2] |
Benchmark Period Mean (intersection) [W/m2] |
Benchmark Period Mean (complement) [W/m2] |
Bias [W/m2] |
RMSE [W/m2] |
Phase Shift [months] |
Bias Score [1] |
RMSE Score [1] |
Seasonal Cycle Score [1] |
Spatial Distribution Score [1] |
Interannual Variability Score [1] |
Overall Score [1] |
|||
|---|---|---|---|---|---|---|---|---|---|---|---|---|---|---|---|---|---|
| Benchmark | [-] | 163. | |||||||||||||||
| CLM4.5SP | [-] | 136. | 136. | 142. | 173. | -4.91 | 16.1 | 0.381 | 0.817 | 0.708 | 0.960 | 0.998 | 0.714 | 0.817 | |||
| CLM4SP | [-] | 137. | 137. | 142. | 173. | -4.01 | 16.4 | 0.391 | 0.815 | 0.700 | 0.959 | 0.997 | 0.710 | 0.814 | |||
| CLM5SP | [-] | 137. | 137. | 142. | 173. | -4.46 | 16.0 | 0.389 | 0.822 | 0.705 | 0.959 | 0.998 | 0.712 | 0.817 |
Download Data |
Period Mean (original grids) [W/m2] |
Model Period Mean (intersection) [W/m2] |
Model Period Mean (complement) [W/m2] |
Benchmark Period Mean (intersection) [W/m2] |
Benchmark Period Mean (complement) [W/m2] |
Bias [W/m2] |
RMSE [W/m2] |
Phase Shift [months] |
Bias Score [1] |
RMSE Score [1] |
Seasonal Cycle Score [1] |
Spatial Distribution Score [1] |
Interannual Variability Score [1] |
Overall Score [1] |
|||
|---|---|---|---|---|---|---|---|---|---|---|---|---|---|---|---|---|---|
| Benchmark | [-] | 177. | |||||||||||||||
| CLM4.5SP | [-] | 161. | 161. | 175. | 217. | -13.4 | 18.5 | 0.287 | 0.693 | 0.771 | 0.979 | 0.965 | 0.664 | 0.807 | |||
| CLM4SP | [-] | 162. | 162. | 175. | 217. | -11.1 | 17.4 | 0.287 | 0.718 | 0.767 | 0.979 | 0.958 | 0.672 | 0.810 | |||
| CLM5SP | [-] | 162. | 162. | 175. | 217. | -12.0 | 17.9 | 0.298 | 0.709 | 0.763 | 0.978 | 0.963 | 0.673 | 0.808 |
Download Data |
Period Mean (original grids) [W/m2] |
Model Period Mean (intersection) [W/m2] |
Model Period Mean (complement) [W/m2] |
Benchmark Period Mean (intersection) [W/m2] |
Benchmark Period Mean (complement) [W/m2] |
Bias [W/m2] |
RMSE [W/m2] |
Phase Shift [months] |
Bias Score [1] |
RMSE Score [1] |
Seasonal Cycle Score [1] |
Spatial Distribution Score [1] |
Interannual Variability Score [1] |
Overall Score [1] |
|||
|---|---|---|---|---|---|---|---|---|---|---|---|---|---|---|---|---|---|
| Benchmark | [-] | 69.7 | |||||||||||||||
| CLM4.5SP | [-] | 70.0 | 69.9 | 69.6 | 71.1 | -1.10 | 17.1 | 0.109 | 0.920 | 0.781 | 0.993 | 0.990 | 0.767 | 0.872 | |||
| CLM4SP | [-] | 69.6 | 69.4 | 69.6 | 71.1 | -1.60 | 19.1 | 0.164 | 0.899 | 0.764 | 0.989 | 0.943 | 0.800 | 0.860 | |||
| CLM5SP | [-] | 69.2 | 69.2 | 69.6 | 71.1 | -1.83 | 17.2 | 0.0813 | 0.920 | 0.779 | 0.995 | 0.989 | 0.765 | 0.871 |
Download Data |
Period Mean (original grids) [W/m2] |
Model Period Mean (intersection) [W/m2] |
Model Period Mean (complement) [W/m2] |
Benchmark Period Mean (intersection) [W/m2] |
Benchmark Period Mean (complement) [W/m2] |
Bias [W/m2] |
RMSE [W/m2] |
Phase Shift [months] |
Bias Score [1] |
RMSE Score [1] |
Seasonal Cycle Score [1] |
Spatial Distribution Score [1] |
Interannual Variability Score [1] |
Overall Score [1] |
|||
|---|---|---|---|---|---|---|---|---|---|---|---|---|---|---|---|---|---|
| Benchmark | [-] | 204. | |||||||||||||||
| CLM4.5SP | [-] | 191. | 191. | 201. | 219. | -7.26 | 17.0 | 0.444 | 0.760 | 0.679 | 0.946 | 0.988 | 0.752 | 0.801 | |||
| CLM4SP | [-] | 192. | 193. | 201. | 219. | -5.34 | 16.4 | 0.451 | 0.775 | 0.677 | 0.945 | 0.995 | 0.757 | 0.804 | |||
| CLM5SP | [-] | 192. | 192. | 201. | 219. | -6.68 | 16.7 | 0.458 | 0.769 | 0.678 | 0.945 | 0.986 | 0.753 | 0.801 |
Download Data |
Period Mean (original grids) [W/m2] |
Model Period Mean (intersection) [W/m2] |
Model Period Mean (complement) [W/m2] |
Benchmark Period Mean (intersection) [W/m2] |
Benchmark Period Mean (complement) [W/m2] |
Bias [W/m2] |
RMSE [W/m2] |
Phase Shift [months] |
Bias Score [1] |
RMSE Score [1] |
Seasonal Cycle Score [1] |
Spatial Distribution Score [1] |
Interannual Variability Score [1] |
Overall Score [1] |
|||
|---|---|---|---|---|---|---|---|---|---|---|---|---|---|---|---|---|---|
| Benchmark | [-] | 150. | |||||||||||||||
| CLM4.5SP | [-] | 145. | 145. | 148. | 192. | -1.72 | 13.4 | 0.291 | 0.937 | 0.800 | 0.981 | 0.991 | 0.701 | 0.868 | |||
| CLM4SP | [-] | 147. | 147. | 148. | 192. | 0.728 | 13.7 | 0.286 | 0.929 | 0.799 | 0.981 | 0.991 | 0.692 | 0.865 | |||
| CLM5SP | [-] | 145. | 145. | 148. | 192. | -1.45 | 13.3 | 0.293 | 0.939 | 0.801 | 0.981 | 0.991 | 0.701 | 0.869 |
Download Data |
Period Mean (original grids) [W/m2] |
Model Period Mean (intersection) [W/m2] |
Model Period Mean (complement) [W/m2] |
Benchmark Period Mean (intersection) [W/m2] |
Benchmark Period Mean (complement) [W/m2] |
Bias [W/m2] |
RMSE [W/m2] |
Phase Shift [months] |
Bias Score [1] |
RMSE Score [1] |
Seasonal Cycle Score [1] |
Spatial Distribution Score [1] |
Interannual Variability Score [1] |
Overall Score [1] |
|||
|---|---|---|---|---|---|---|---|---|---|---|---|---|---|---|---|---|---|
| Benchmark | [-] | 110. | |||||||||||||||
| CLM4.5SP | [-] | 112. | 112. | 110. | 117. | 2.18 | 13.9 | 0.112 | 0.924 | 0.838 | 0.992 | 0.997 | 0.667 | 0.876 | |||
| CLM4SP | [-] | 114. | 114. | 110. | 117. | 4.28 | 15.6 | 0.132 | 0.904 | 0.826 | 0.991 | 0.991 | 0.678 | 0.869 | |||
| CLM5SP | [-] | 112. | 112. | 110. | 117. | 1.79 | 13.4 | 0.112 | 0.929 | 0.841 | 0.993 | 0.999 | 0.675 | 0.880 |
Download Data |
Period Mean (original grids) [W/m2] |
Model Period Mean (intersection) [W/m2] |
Model Period Mean (complement) [W/m2] |
Benchmark Period Mean (intersection) [W/m2] |
Benchmark Period Mean (complement) [W/m2] |
Bias [W/m2] |
RMSE [W/m2] |
Phase Shift [months] |
Bias Score [1] |
RMSE Score [1] |
Seasonal Cycle Score [1] |
Spatial Distribution Score [1] |
Interannual Variability Score [1] |
Overall Score [1] |
|||
|---|---|---|---|---|---|---|---|---|---|---|---|---|---|---|---|---|---|
| Benchmark | [-] | 161. | |||||||||||||||
| CLM4.5SP | [-] | 158. | 158. | 161. | 163. | -2.82 | 14.6 | 0.176 | 0.911 | 0.827 | 0.988 | 0.983 | 0.702 | 0.873 | |||
| CLM4SP | [-] | 160. | 160. | 161. | 163. | -0.974 | 14.9 | 0.187 | 0.918 | 0.822 | 0.987 | 0.988 | 0.687 | 0.871 | |||
| CLM5SP | [-] | 160. | 160. | 161. | 163. | -0.462 | 14.3 | 0.198 | 0.928 | 0.826 | 0.987 | 0.983 | 0.702 | 0.875 |
Download Data |
Period Mean (original grids) [W/m2] |
Model Period Mean (intersection) [W/m2] |
Model Period Mean (complement) [W/m2] |
Benchmark Period Mean (intersection) [W/m2] |
Benchmark Period Mean (complement) [W/m2] |
Bias [W/m2] |
RMSE [W/m2] |
Phase Shift [months] |
Bias Score [1] |
RMSE Score [1] |
Seasonal Cycle Score [1] |
Spatial Distribution Score [1] |
Interannual Variability Score [1] |
Overall Score [1] |
|||
|---|---|---|---|---|---|---|---|---|---|---|---|---|---|---|---|---|---|
| Benchmark | [-] | 179. | |||||||||||||||
| CLM4.5SP | [-] | 174. | 174. | 178. | 218. | -3.07 | 14.3 | 0.797 | 0.750 | 0.449 | 0.897 | 0.956 | 0.806 | 0.718 | |||
| CLM4SP | [-] | 174. | 174. | 178. | 218. | -2.49 | 14.3 | 0.799 | 0.763 | 0.449 | 0.896 | 0.966 | 0.807 | 0.721 | |||
| CLM5SP | [-] | 174. | 174. | 178. | 218. | -3.01 | 14.3 | 0.799 | 0.751 | 0.449 | 0.896 | 0.959 | 0.806 | 0.718 |
Download Data |
Period Mean (original grids) [W/m2] |
Model Period Mean (intersection) [W/m2] |
Model Period Mean (complement) [W/m2] |
Benchmark Period Mean (intersection) [W/m2] |
Benchmark Period Mean (complement) [W/m2] |
Bias [W/m2] |
RMSE [W/m2] |
Phase Shift [months] |
Bias Score [1] |
RMSE Score [1] |
Seasonal Cycle Score [1] |
Spatial Distribution Score [1] |
Interannual Variability Score [1] |
Overall Score [1] |
|||
|---|---|---|---|---|---|---|---|---|---|---|---|---|---|---|---|---|---|
| Benchmark | [-] | 185. | |||||||||||||||
| CLM4.5SP | [-] | 180. | 180. | 184. | 202. | -3.77 | 15.5 | 0.693 | 0.826 | 0.646 | 0.914 | 0.974 | 0.713 | 0.786 | |||
| CLM4SP | [-] | 181. | 182. | 184. | 202. | -2.53 | 15.3 | 0.763 | 0.841 | 0.645 | 0.901 | 0.971 | 0.717 | 0.787 | |||
| CLM5SP | [-] | 180. | 181. | 184. | 202. | -3.37 | 15.5 | 0.717 | 0.831 | 0.645 | 0.909 | 0.976 | 0.715 | 0.787 |
Download Data |
Period Mean (original grids) [W/m2] |
Model Period Mean (intersection) [W/m2] |
Model Period Mean (complement) [W/m2] |
Benchmark Period Mean (intersection) [W/m2] |
Benchmark Period Mean (complement) [W/m2] |
Bias [W/m2] |
RMSE [W/m2] |
Phase Shift [months] |
Bias Score [1] |
RMSE Score [1] |
Seasonal Cycle Score [1] |
Spatial Distribution Score [1] |
Interannual Variability Score [1] |
Overall Score [1] |
|||
|---|---|---|---|---|---|---|---|---|---|---|---|---|---|---|---|---|---|
| Benchmark | [-] | 178. | |||||||||||||||
| CLM4.5SP | [-] | 175. | 174. | 179. | 169. | -9.39 | 22.0 | 0.386 | 0.765 | 0.711 | 0.960 | 0.997 | 0.684 | 0.805 | |||
| CLM4SP | [-] | 176. | 175. | 179. | 169. | -7.95 | 21.3 | 0.390 | 0.780 | 0.712 | 0.960 | 0.997 | 0.692 | 0.809 | |||
| CLM5SP | [-] | 177. | 176. | 179. | 169. | -7.13 | 20.8 | 0.400 | 0.791 | 0.712 | 0.959 | 0.998 | 0.687 | 0.810 |
Temporally integrated period mean