Mean State
Download Data |
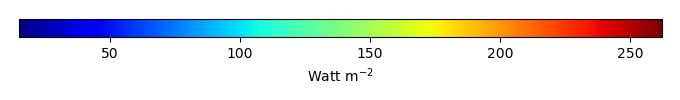
Period Mean (original grids) [Watt m-2] |
Model Period Mean (intersection) [Watt m-2] |
Model Period Mean (complement) [Watt m-2] |
Benchmark Period Mean (intersection) [Watt m-2] |
Benchmark Period Mean (complement) [Watt m-2] |
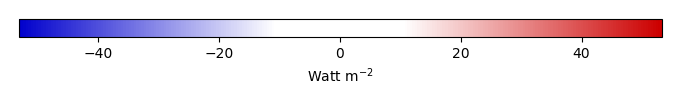
Bias [Watt m-2] |
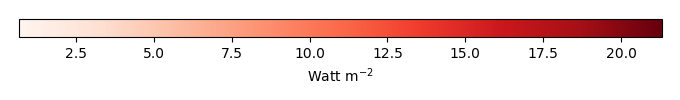
RMSE [Watt m-2] |
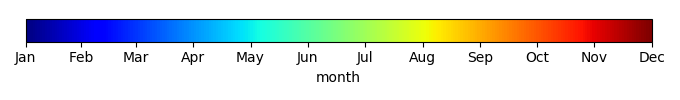
Phase Shift [months] |
Bias Score [1] |
RMSE Score [1] |
Seasonal Cycle Score [1] |
Spatial Distribution Score [1] |
Interannual Variability Score [1] |
Overall Score [1] |
|||
|---|---|---|---|---|---|---|---|---|---|---|---|---|---|---|---|---|---|
| Benchmark | [-] | 179. | |||||||||||||||
| CLM4.5SP | [-] | 182. | 182. | 177. | 216. | 5.47 | 16.7 | 0.472 | 0.622 | 0.527 | 0.942 | 0.909 | 0.725 | 0.709 | |||
| CLM4SP | [-] | 184. | 184. | 177. | 216. | 7.17 | 16.9 | 0.457 | 0.602 | 0.527 | 0.945 | 0.934 | 0.729 | 0.711 | |||
| CLM5SP | [-] | 183. | 183. | 177. | 216. | 5.93 | 16.8 | 0.514 | 0.620 | 0.524 | 0.935 | 0.921 | 0.727 | 0.709 |
Download Data |
Period Mean (original grids) [Watt m-2] |
Model Period Mean (intersection) [Watt m-2] |
Model Period Mean (complement) [Watt m-2] |
Benchmark Period Mean (intersection) [Watt m-2] |
Benchmark Period Mean (complement) [Watt m-2] |
Bias [Watt m-2] |
RMSE [Watt m-2] |
Phase Shift [months] |
Bias Score [1] |
RMSE Score [1] |
Seasonal Cycle Score [1] |
Spatial Distribution Score [1] |
Interannual Variability Score [1] |
Overall Score [1] |
|||
|---|---|---|---|---|---|---|---|---|---|---|---|---|---|---|---|---|---|
| Benchmark | [-] | 189. | |||||||||||||||
| CLM4.5SP | [-] | 194. | 194. | 188. | 224. | 5.92 | 16.0 | 0.362 | 0.679 | 0.542 | 0.972 | 0.999 | 0.766 | 0.750 | |||
| CLM4SP | [-] | 196. | 196. | 188. | 224. | 7.63 | 16.1 | 0.325 | 0.658 | 0.547 | 0.976 | 0.986 | 0.769 | 0.747 | |||
| CLM5SP | [-] | 195. | 195. | 188. | 224. | 6.39 | 16.2 | 0.423 | 0.672 | 0.536 | 0.965 | 0.999 | 0.767 | 0.746 |
Download Data |
Period Mean (original grids) [Watt m-2] |
Model Period Mean (intersection) [Watt m-2] |
Model Period Mean (complement) [Watt m-2] |
Benchmark Period Mean (intersection) [Watt m-2] |
Benchmark Period Mean (complement) [Watt m-2] |
Bias [Watt m-2] |
RMSE [Watt m-2] |
Phase Shift [months] |
Bias Score [1] |
RMSE Score [1] |
Seasonal Cycle Score [1] |
Spatial Distribution Score [1] |
Interannual Variability Score [1] |
Overall Score [1] |
|||
|---|---|---|---|---|---|---|---|---|---|---|---|---|---|---|---|---|---|
| Benchmark | [-] | 194. | |||||||||||||||
| CLM4.5SP | [-] | 197. | 197. | 192. | 221. | 3.94 | 18.4 | 0.497 | 0.714 | 0.567 | 0.932 | 0.960 | 0.664 | 0.734 | |||
| CLM4SP | [-] | 197. | 198. | 192. | 221. | 5.04 | 18.3 | 0.488 | 0.710 | 0.569 | 0.932 | 0.951 | 0.666 | 0.733 | |||
| CLM5SP | [-] | 197. | 197. | 192. | 221. | 4.44 | 18.6 | 0.496 | 0.707 | 0.567 | 0.932 | 0.960 | 0.665 | 0.733 |
Download Data |
Period Mean (original grids) [Watt m-2] |
Model Period Mean (intersection) [Watt m-2] |
Model Period Mean (complement) [Watt m-2] |
Benchmark Period Mean (intersection) [Watt m-2] |
Benchmark Period Mean (complement) [Watt m-2] |
Bias [Watt m-2] |
RMSE [Watt m-2] |
Phase Shift [months] |
Bias Score [1] |
RMSE Score [1] |
Seasonal Cycle Score [1] |
Spatial Distribution Score [1] |
Interannual Variability Score [1] |
Overall Score [1] |
|||
|---|---|---|---|---|---|---|---|---|---|---|---|---|---|---|---|---|---|
| Benchmark | [-] | 81.3 | |||||||||||||||
| CLM4.5SP | [-] | 70.7 | 70.9 | 80.9 | 86.2 | -10.7 | 21.2 | 0.180 | 0.854 | 0.742 | 0.988 | 0.937 | 0.720 | 0.831 | |||
| CLM4SP | [-] | 69.7 | 69.9 | 80.9 | 86.2 | -11.5 | 23.2 | 0.262 | 0.843 | 0.728 | 0.983 | 0.925 | 0.790 | 0.833 | |||
| CLM5SP | [-] | 69.8 | 69.9 | 80.9 | 86.2 | -11.6 | 21.8 | 0.200 | 0.843 | 0.740 | 0.987 | 0.945 | 0.720 | 0.829 |
Download Data |
Period Mean (original grids) [Watt m-2] |
Model Period Mean (intersection) [Watt m-2] |
Model Period Mean (complement) [Watt m-2] |
Benchmark Period Mean (intersection) [Watt m-2] |
Benchmark Period Mean (complement) [Watt m-2] |
Bias [Watt m-2] |
RMSE [Watt m-2] |
Phase Shift [months] |
Bias Score [1] |
RMSE Score [1] |
Seasonal Cycle Score [1] |
Spatial Distribution Score [1] |
Interannual Variability Score [1] |
Overall Score [1] |
|||
|---|---|---|---|---|---|---|---|---|---|---|---|---|---|---|---|---|---|
| Benchmark | [-] | 189. | |||||||||||||||
| CLM4.5SP | [-] | 178. | 178. | 183. | 210. | -1.26 | 20.6 | 0.686 | 0.600 | 0.455 | 0.906 | 0.728 | 0.715 | 0.643 | |||
| CLM4SP | [-] | 179. | 179. | 183. | 210. | -0.389 | 20.5 | 0.684 | 0.598 | 0.455 | 0.906 | 0.761 | 0.716 | 0.648 | |||
| CLM5SP | [-] | 178. | 178. | 183. | 210. | -1.23 | 20.6 | 0.686 | 0.600 | 0.455 | 0.906 | 0.730 | 0.715 | 0.643 |
Download Data |
Period Mean (original grids) [Watt m-2] |
Model Period Mean (intersection) [Watt m-2] |
Model Period Mean (complement) [Watt m-2] |
Benchmark Period Mean (intersection) [Watt m-2] |
Benchmark Period Mean (complement) [Watt m-2] |
Bias [Watt m-2] |
RMSE [Watt m-2] |
Phase Shift [months] |
Bias Score [1] |
RMSE Score [1] |
Seasonal Cycle Score [1] |
Spatial Distribution Score [1] |
Interannual Variability Score [1] |
Overall Score [1] |
|||
|---|---|---|---|---|---|---|---|---|---|---|---|---|---|---|---|---|---|
| Benchmark | [-] | 105. | |||||||||||||||
| CLM4.5SP | [-] | 103. | 103. | 104. | 127. | -1.38 | 14.7 | 0.0790 | 0.948 | 0.814 | 0.995 | 0.996 | 0.624 | 0.865 | |||
| CLM4SP | [-] | 105. | 105. | 104. | 127. | 1.05 | 14.6 | 0.0810 | 0.940 | 0.818 | 0.995 | 0.996 | 0.629 | 0.866 | |||
| CLM5SP | [-] | 102. | 102. | 104. | 127. | -2.18 | 14.9 | 0.0819 | 0.947 | 0.812 | 0.995 | 0.998 | 0.630 | 0.866 |
Download Data |
Period Mean (original grids) [Watt m-2] |
Model Period Mean (intersection) [Watt m-2] |
Model Period Mean (complement) [Watt m-2] |
Benchmark Period Mean (intersection) [Watt m-2] |
Benchmark Period Mean (complement) [Watt m-2] |
Bias [Watt m-2] |
RMSE [Watt m-2] |
Phase Shift [months] |
Bias Score [1] |
RMSE Score [1] |
Seasonal Cycle Score [1] |
Spatial Distribution Score [1] |
Interannual Variability Score [1] |
Overall Score [1] |
|||
|---|---|---|---|---|---|---|---|---|---|---|---|---|---|---|---|---|---|
| Benchmark | [-] | 140. | |||||||||||||||
| CLM4.5SP | [-] | 134. | 134. | 139. | 154. | -5.16 | 17.6 | 0.246 | 0.870 | 0.745 | 0.980 | 0.993 | 0.620 | 0.825 | |||
| CLM4SP | [-] | 134. | 134. | 139. | 154. | -4.73 | 17.6 | 0.233 | 0.868 | 0.745 | 0.980 | 0.990 | 0.622 | 0.825 | |||
| CLM5SP | [-] | 136. | 136. | 139. | 154. | -3.31 | 17.0 | 0.232 | 0.890 | 0.743 | 0.981 | 0.998 | 0.628 | 0.831 |
Download Data |
Period Mean (original grids) [Watt m-2] |
Model Period Mean (intersection) [Watt m-2] |
Model Period Mean (complement) [Watt m-2] |
Benchmark Period Mean (intersection) [Watt m-2] |
Benchmark Period Mean (complement) [Watt m-2] |
Bias [Watt m-2] |
RMSE [Watt m-2] |
Phase Shift [months] |
Bias Score [1] |
RMSE Score [1] |
Seasonal Cycle Score [1] |
Spatial Distribution Score [1] |
Interannual Variability Score [1] |
Overall Score [1] |
|||
|---|---|---|---|---|---|---|---|---|---|---|---|---|---|---|---|---|---|
| Benchmark | [-] | 180. | |||||||||||||||
| CLM4.5SP | [-] | 175. | 174. | 178. | 210. | -1.82 | 18.9 | 0.286 | 0.799 | 0.621 | 0.980 | 0.951 | 0.634 | 0.768 | |||
| CLM4SP | [-] | 175. | 175. | 178. | 210. | -1.16 | 19.0 | 0.279 | 0.786 | 0.621 | 0.981 | 0.970 | 0.639 | 0.770 | |||
| CLM5SP | [-] | 175. | 175. | 178. | 210. | -1.06 | 18.7 | 0.290 | 0.800 | 0.620 | 0.980 | 0.929 | 0.635 | 0.764 |
Download Data |
Period Mean (original grids) [Watt m-2] |
Model Period Mean (intersection) [Watt m-2] |
Model Period Mean (complement) [Watt m-2] |
Benchmark Period Mean (intersection) [Watt m-2] |
Benchmark Period Mean (complement) [Watt m-2] |
Bias [Watt m-2] |
RMSE [Watt m-2] |
Phase Shift [months] |
Bias Score [1] |
RMSE Score [1] |
Seasonal Cycle Score [1] |
Spatial Distribution Score [1] |
Interannual Variability Score [1] |
Overall Score [1] |
|||
|---|---|---|---|---|---|---|---|---|---|---|---|---|---|---|---|---|---|
| Benchmark | [-] | 74.6 | |||||||||||||||
| CLM4.5SP | [-] | 61.1 | 61.6 | 74.6 | 74.8 | -13.8 | 19.8 | 0.254 | 0.808 | 0.737 | 0.983 | 0.911 | 0.678 | 0.809 | |||
| CLM4SP | [-] | 61.5 | 62.0 | 74.6 | 74.8 | -13.2 | 20.8 | 0.299 | 0.814 | 0.726 | 0.980 | 0.876 | 0.734 | 0.809 | |||
| CLM5SP | [-] | 60.5 | 60.9 | 74.6 | 74.8 | -14.4 | 20.3 | 0.228 | 0.801 | 0.735 | 0.985 | 0.911 | 0.679 | 0.808 |
Download Data |
Period Mean (original grids) [Watt m-2] |
Model Period Mean (intersection) [Watt m-2] |
Model Period Mean (complement) [Watt m-2] |
Benchmark Period Mean (intersection) [Watt m-2] |
Benchmark Period Mean (complement) [Watt m-2] |
Bias [Watt m-2] |
RMSE [Watt m-2] |
Phase Shift [months] |
Bias Score [1] |
RMSE Score [1] |
Seasonal Cycle Score [1] |
Spatial Distribution Score [1] |
Interannual Variability Score [1] |
Overall Score [1] |
|||
|---|---|---|---|---|---|---|---|---|---|---|---|---|---|---|---|---|---|
| Benchmark | [-] | 193. | |||||||||||||||
| CLM4.5SP | [-] | 189. | 189. | 193. | 202. | -4.54 | 18.1 | 0.139 | 0.850 | 0.710 | 0.989 | 0.997 | 0.607 | 0.810 | |||
| CLM4SP | [-] | 193. | 193. | 193. | 202. | -0.651 | 17.6 | 0.142 | 0.847 | 0.710 | 0.989 | 0.999 | 0.616 | 0.812 | |||
| CLM5SP | [-] | 190. | 190. | 193. | 202. | -3.35 | 18.2 | 0.157 | 0.850 | 0.706 | 0.988 | 0.998 | 0.606 | 0.809 |
Download Data |
Period Mean (original grids) [Watt m-2] |
Model Period Mean (intersection) [Watt m-2] |
Model Period Mean (complement) [Watt m-2] |
Benchmark Period Mean (intersection) [Watt m-2] |
Benchmark Period Mean (complement) [Watt m-2] |
Bias [Watt m-2] |
RMSE [Watt m-2] |
Phase Shift [months] |
Bias Score [1] |
RMSE Score [1] |
Seasonal Cycle Score [1] |
Spatial Distribution Score [1] |
Interannual Variability Score [1] |
Overall Score [1] |
|||
|---|---|---|---|---|---|---|---|---|---|---|---|---|---|---|---|---|---|
| Benchmark | [-] | 120. | |||||||||||||||
| CLM4.5SP | [-] | 113. | 113. | 117. | 151. | -1.35 | 16.3 | 0.268 | 0.906 | 0.802 | 0.981 | 0.998 | 0.619 | 0.851 | |||
| CLM4SP | [-] | 115. | 115. | 117. | 151. | 0.425 | 16.3 | 0.261 | 0.897 | 0.804 | 0.980 | 0.996 | 0.624 | 0.851 | |||
| CLM5SP | [-] | 113. | 113. | 117. | 151. | -1.04 | 16.2 | 0.267 | 0.906 | 0.803 | 0.981 | 0.998 | 0.620 | 0.852 |
Download Data |
Period Mean (original grids) [Watt m-2] |
Model Period Mean (intersection) [Watt m-2] |
Model Period Mean (complement) [Watt m-2] |
Benchmark Period Mean (intersection) [Watt m-2] |
Benchmark Period Mean (complement) [Watt m-2] |
Bias [Watt m-2] |
RMSE [Watt m-2] |
Phase Shift [months] |
Bias Score [1] |
RMSE Score [1] |
Seasonal Cycle Score [1] |
Spatial Distribution Score [1] |
Interannual Variability Score [1] |
Overall Score [1] |
|||
|---|---|---|---|---|---|---|---|---|---|---|---|---|---|---|---|---|---|
| Benchmark | [-] | 168. | |||||||||||||||
| CLM4.5SP | [-] | 136. | 136. | 143. | 180. | -6.13 | 18.8 | 0.256 | 0.786 | 0.675 | 0.975 | 0.972 | 0.624 | 0.784 | |||
| CLM4SP | [-] | 137. | 137. | 143. | 180. | -5.22 | 19.1 | 0.253 | 0.780 | 0.673 | 0.975 | 0.962 | 0.629 | 0.782 | |||
| CLM5SP | [-] | 137. | 137. | 143. | 180. | -5.71 | 18.9 | 0.261 | 0.786 | 0.673 | 0.974 | 0.966 | 0.623 | 0.783 |
Download Data |
Period Mean (original grids) [Watt m-2] |
Model Period Mean (intersection) [Watt m-2] |
Model Period Mean (complement) [Watt m-2] |
Benchmark Period Mean (intersection) [Watt m-2] |
Benchmark Period Mean (complement) [Watt m-2] |
Bias [Watt m-2] |
RMSE [Watt m-2] |
Phase Shift [months] |
Bias Score [1] |
RMSE Score [1] |
Seasonal Cycle Score [1] |
Spatial Distribution Score [1] |
Interannual Variability Score [1] |
Overall Score [1] |
|||
|---|---|---|---|---|---|---|---|---|---|---|---|---|---|---|---|---|---|
| Benchmark | [-] | 175. | |||||||||||||||
| CLM4.5SP | [-] | 161. | 161. | 173. | 224. | -11.6 | 20.0 | 0.262 | 0.706 | 0.734 | 0.978 | 0.991 | 0.571 | 0.786 | |||
| CLM4SP | [-] | 162. | 162. | 173. | 224. | -9.38 | 18.6 | 0.264 | 0.733 | 0.734 | 0.978 | 0.988 | 0.579 | 0.791 | |||
| CLM5SP | [-] | 162. | 162. | 173. | 224. | -10.2 | 19.6 | 0.295 | 0.716 | 0.729 | 0.974 | 0.990 | 0.578 | 0.786 |
Download Data |
Period Mean (original grids) [Watt m-2] |
Model Period Mean (intersection) [Watt m-2] |
Model Period Mean (complement) [Watt m-2] |
Benchmark Period Mean (intersection) [Watt m-2] |
Benchmark Period Mean (complement) [Watt m-2] |
Bias [Watt m-2] |
RMSE [Watt m-2] |
Phase Shift [months] |
Bias Score [1] |
RMSE Score [1] |
Seasonal Cycle Score [1] |
Spatial Distribution Score [1] |
Interannual Variability Score [1] |
Overall Score [1] |
|||
|---|---|---|---|---|---|---|---|---|---|---|---|---|---|---|---|---|---|
| Benchmark | [-] | 80.0 | |||||||||||||||
| CLM4.5SP | [-] | 69.9 | 69.8 | 79.8 | 82.9 | -11.4 | 20.0 | 0.0984 | 0.836 | 0.758 | 0.993 | 0.917 | 0.738 | 0.833 | |||
| CLM4SP | [-] | 69.4 | 69.2 | 79.8 | 82.9 | -11.9 | 21.4 | 0.153 | 0.828 | 0.751 | 0.990 | 0.830 | 0.768 | 0.820 | |||
| CLM5SP | [-] | 69.1 | 69.0 | 79.8 | 82.9 | -12.2 | 20.7 | 0.0842 | 0.827 | 0.753 | 0.994 | 0.910 | 0.736 | 0.829 |
Download Data |
Period Mean (original grids) [Watt m-2] |
Model Period Mean (intersection) [Watt m-2] |
Model Period Mean (complement) [Watt m-2] |
Benchmark Period Mean (intersection) [Watt m-2] |
Benchmark Period Mean (complement) [Watt m-2] |
Bias [Watt m-2] |
RMSE [Watt m-2] |
Phase Shift [months] |
Bias Score [1] |
RMSE Score [1] |
Seasonal Cycle Score [1] |
Spatial Distribution Score [1] |
Interannual Variability Score [1] |
Overall Score [1] |
|||
|---|---|---|---|---|---|---|---|---|---|---|---|---|---|---|---|---|---|
| Benchmark | [-] | 205. | |||||||||||||||
| CLM4.5SP | [-] | 191. | 192. | 200. | 227. | -6.62 | 20.2 | 0.238 | 0.765 | 0.639 | 0.975 | 0.902 | 0.623 | 0.757 | |||
| CLM4SP | [-] | 193. | 193. | 200. | 227. | -4.70 | 19.6 | 0.221 | 0.770 | 0.640 | 0.977 | 0.922 | 0.627 | 0.763 | |||
| CLM5SP | [-] | 192. | 192. | 200. | 227. | -6.02 | 20.0 | 0.221 | 0.770 | 0.638 | 0.977 | 0.896 | 0.625 | 0.757 |
Download Data |
Period Mean (original grids) [Watt m-2] |
Model Period Mean (intersection) [Watt m-2] |
Model Period Mean (complement) [Watt m-2] |
Benchmark Period Mean (intersection) [Watt m-2] |
Benchmark Period Mean (complement) [Watt m-2] |
Bias [Watt m-2] |
RMSE [Watt m-2] |
Phase Shift [months] |
Bias Score [1] |
RMSE Score [1] |
Seasonal Cycle Score [1] |
Spatial Distribution Score [1] |
Interannual Variability Score [1] |
Overall Score [1] |
|||
|---|---|---|---|---|---|---|---|---|---|---|---|---|---|---|---|---|---|
| Benchmark | [-] | 153. | |||||||||||||||
| CLM4.5SP | [-] | 144. | 144. | 151. | 194. | -4.96 | 16.1 | 0.128 | 0.909 | 0.770 | 0.991 | 0.999 | 0.619 | 0.843 | |||
| CLM4SP | [-] | 146. | 146. | 151. | 194. | -2.55 | 15.6 | 0.130 | 0.932 | 0.771 | 0.991 | 0.999 | 0.618 | 0.847 | |||
| CLM5SP | [-] | 144. | 144. | 151. | 194. | -4.68 | 15.8 | 0.124 | 0.913 | 0.772 | 0.992 | 0.999 | 0.618 | 0.844 |
Download Data |
Period Mean (original grids) [Watt m-2] |
Model Period Mean (intersection) [Watt m-2] |
Model Period Mean (complement) [Watt m-2] |
Benchmark Period Mean (intersection) [Watt m-2] |
Benchmark Period Mean (complement) [Watt m-2] |
Bias [Watt m-2] |
RMSE [Watt m-2] |
Phase Shift [months] |
Bias Score [1] |
RMSE Score [1] |
Seasonal Cycle Score [1] |
Spatial Distribution Score [1] |
Interannual Variability Score [1] |
Overall Score [1] |
|||
|---|---|---|---|---|---|---|---|---|---|---|---|---|---|---|---|---|---|
| Benchmark | [-] | 115. | |||||||||||||||
| CLM4.5SP | [-] | 112. | 112. | 114. | 123. | -2.49 | 14.7 | 0.0936 | 0.926 | 0.825 | 0.994 | 0.997 | 0.628 | 0.866 | |||
| CLM4SP | [-] | 114. | 114. | 114. | 123. | -0.329 | 15.0 | 0.0991 | 0.922 | 0.822 | 0.993 | 0.992 | 0.636 | 0.865 | |||
| CLM5SP | [-] | 112. | 112. | 114. | 123. | -2.84 | 14.6 | 0.0871 | 0.926 | 0.826 | 0.994 | 0.999 | 0.637 | 0.868 |
Download Data |
Period Mean (original grids) [Watt m-2] |
Model Period Mean (intersection) [Watt m-2] |
Model Period Mean (complement) [Watt m-2] |
Benchmark Period Mean (intersection) [Watt m-2] |
Benchmark Period Mean (complement) [Watt m-2] |
Bias [Watt m-2] |
RMSE [Watt m-2] |
Phase Shift [months] |
Bias Score [1] |
RMSE Score [1] |
Seasonal Cycle Score [1] |
Spatial Distribution Score [1] |
Interannual Variability Score [1] |
Overall Score [1] |
|||
|---|---|---|---|---|---|---|---|---|---|---|---|---|---|---|---|---|---|
| Benchmark | [-] | 162. | |||||||||||||||
| CLM4.5SP | [-] | 157. | 157. | 162. | 171. | -4.35 | 15.5 | 0.144 | 0.911 | 0.812 | 0.990 | 1.00 | 0.647 | 0.862 | |||
| CLM4SP | [-] | 159. | 159. | 162. | 171. | -2.56 | 15.3 | 0.150 | 0.927 | 0.808 | 0.990 | 1.00 | 0.639 | 0.862 | |||
| CLM5SP | [-] | 160. | 160. | 162. | 171. | -1.80 | 14.7 | 0.134 | 0.934 | 0.813 | 0.991 | 1.00 | 0.649 | 0.867 |
Download Data |
Period Mean (original grids) [Watt m-2] |
Model Period Mean (intersection) [Watt m-2] |
Model Period Mean (complement) [Watt m-2] |
Benchmark Period Mean (intersection) [Watt m-2] |
Benchmark Period Mean (complement) [Watt m-2] |
Bias [Watt m-2] |
RMSE [Watt m-2] |
Phase Shift [months] |
Bias Score [1] |
RMSE Score [1] |
Seasonal Cycle Score [1] |
Spatial Distribution Score [1] |
Interannual Variability Score [1] |
Overall Score [1] |
|||
|---|---|---|---|---|---|---|---|---|---|---|---|---|---|---|---|---|---|
| Benchmark | [-] | 176. | |||||||||||||||
| CLM4.5SP | [-] | 174. | 174. | 174. | 226. | 0.766 | 17.1 | 0.479 | 0.830 | 0.468 | 0.939 | 0.945 | 0.646 | 0.716 | |||
| CLM4SP | [-] | 175. | 175. | 174. | 226. | 1.34 | 17.2 | 0.480 | 0.822 | 0.468 | 0.939 | 0.956 | 0.647 | 0.717 | |||
| CLM5SP | [-] | 174. | 174. | 174. | 226. | 0.816 | 17.1 | 0.475 | 0.829 | 0.468 | 0.940 | 0.948 | 0.646 | 0.716 |
Download Data |
Period Mean (original grids) [Watt m-2] |
Model Period Mean (intersection) [Watt m-2] |
Model Period Mean (complement) [Watt m-2] |
Benchmark Period Mean (intersection) [Watt m-2] |
Benchmark Period Mean (complement) [Watt m-2] |
Bias [Watt m-2] |
RMSE [Watt m-2] |
Phase Shift [months] |
Bias Score [1] |
RMSE Score [1] |
Seasonal Cycle Score [1] |
Spatial Distribution Score [1] |
Interannual Variability Score [1] |
Overall Score [1] |
|||
|---|---|---|---|---|---|---|---|---|---|---|---|---|---|---|---|---|---|
| Benchmark | [-] | 182. | |||||||||||||||
| CLM4.5SP | [-] | 181. | 181. | 181. | 201. | -0.323 | 19.1 | 0.305 | 0.888 | 0.574 | 0.963 | 0.999 | 0.611 | 0.768 | |||
| CLM4SP | [-] | 182. | 182. | 181. | 201. | 0.873 | 19.0 | 0.260 | 0.887 | 0.574 | 0.971 | 0.999 | 0.614 | 0.770 | |||
| CLM5SP | [-] | 181. | 182. | 181. | 201. | 0.0675 | 19.0 | 0.293 | 0.888 | 0.574 | 0.965 | 0.999 | 0.613 | 0.769 |
Download Data |
Period Mean (original grids) [Watt m-2] |
Model Period Mean (intersection) [Watt m-2] |
Model Period Mean (complement) [Watt m-2] |
Benchmark Period Mean (intersection) [Watt m-2] |
Benchmark Period Mean (complement) [Watt m-2] |
Bias [Watt m-2] |
RMSE [Watt m-2] |
Phase Shift [months] |
Bias Score [1] |
RMSE Score [1] |
Seasonal Cycle Score [1] |
Spatial Distribution Score [1] |
Interannual Variability Score [1] |
Overall Score [1] |
|||
|---|---|---|---|---|---|---|---|---|---|---|---|---|---|---|---|---|---|
| Benchmark | [-] | 176. | |||||||||||||||
| CLM4.5SP | [-] | 175. | 174. | 176. | 178. | -5.05 | 20.8 | 0.294 | 0.842 | 0.698 | 0.971 | 0.999 | 0.602 | 0.801 | |||
| CLM4SP | [-] | 176. | 175. | 176. | 178. | -3.62 | 20.5 | 0.285 | 0.845 | 0.698 | 0.971 | 0.999 | 0.607 | 0.803 | |||
| CLM5SP | [-] | 178. | 176. | 176. | 178. | -2.72 | 20.8 | 0.309 | 0.840 | 0.697 | 0.970 | 0.998 | 0.605 | 0.801 |
Temporally integrated period mean