Mean State
Download Data |
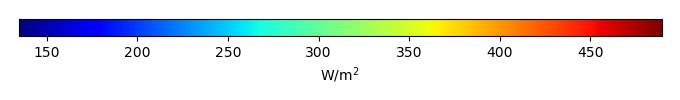
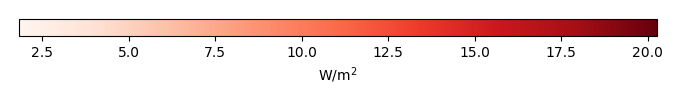
Period Mean (original grids) [W/m2] |
Model Period Mean (intersection) [W/m2] |
Model Period Mean (complement) [W/m2] |
Benchmark Period Mean (intersection) [W/m2] |
Benchmark Period Mean (complement) [W/m2] |
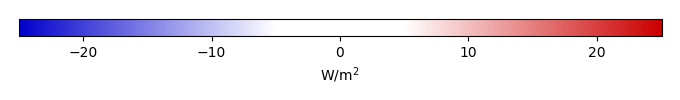
Bias [W/m2] |
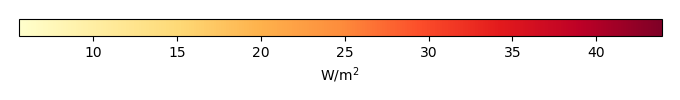
RMSE [W/m2] |
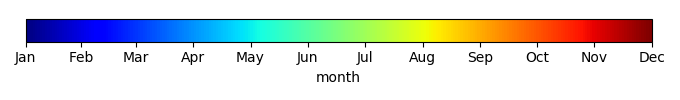
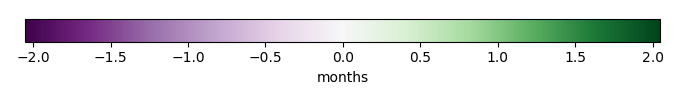
Phase Shift [months] |
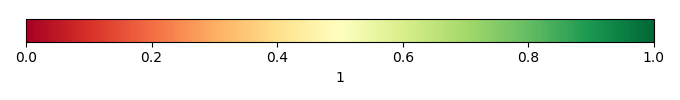
Bias Score [1] |
RMSE Score [1] |
Seasonal Cycle Score [1] |
Spatial Distribution Score [1] |
Interannual Variability Score [1] |
Overall Score [1] |
|||
|---|---|---|---|---|---|---|---|---|---|---|---|---|---|---|---|---|---|
| Benchmark | [-] | 457. | |||||||||||||||
| CLM4.5SP | [-] | 459. | 459. | 456. | 465. | 3.90 | 14.3 | 1.45 | 0.500 | 0.395 | 0.794 | 0.990 | 0.612 | 0.614 | |||
| CLM4SP | [-] | 457. | 457. | 456. | 465. | 1.98 | 13.8 | 1.32 | 0.516 | 0.394 | 0.810 | 0.997 | 0.608 | 0.620 | |||
| CLM5SP | [-] | 461. | 461. | 456. | 465. | 5.39 | 14.8 | 1.43 | 0.498 | 0.387 | 0.801 | 0.995 | 0.601 | 0.612 |
Download Data |
Period Mean (original grids) [W/m2] |
Model Period Mean (intersection) [W/m2] |
Model Period Mean (complement) [W/m2] |
Benchmark Period Mean (intersection) [W/m2] |
Benchmark Period Mean (complement) [W/m2] |
Bias [W/m2] |
RMSE [W/m2] |
Phase Shift [months] |
Bias Score [1] |
RMSE Score [1] |
Seasonal Cycle Score [1] |
Spatial Distribution Score [1] |
Interannual Variability Score [1] |
Overall Score [1] |
|||
|---|---|---|---|---|---|---|---|---|---|---|---|---|---|---|---|---|---|
| Benchmark | [-] | 466. | |||||||||||||||
| CLM4.5SP | [-] | 476. | 477. | 467. | 458. | 10.1 | 18.3 | 0.511 | 0.600 | 0.529 | 0.955 | 0.973 | 0.615 | 0.700 | |||
| CLM4SP | [-] | 476. | 476. | 467. | 458. | 9.34 | 18.2 | 0.553 | 0.618 | 0.517 | 0.951 | 0.983 | 0.618 | 0.701 | |||
| CLM5SP | [-] | 478. | 478. | 467. | 458. | 11.5 | 19.5 | 0.566 | 0.575 | 0.514 | 0.950 | 0.974 | 0.613 | 0.690 |
Download Data |
Period Mean (original grids) [W/m2] |
Model Period Mean (intersection) [W/m2] |
Model Period Mean (complement) [W/m2] |
Benchmark Period Mean (intersection) [W/m2] |
Benchmark Period Mean (complement) [W/m2] |
Bias [W/m2] |
RMSE [W/m2] |
Phase Shift [months] |
Bias Score [1] |
RMSE Score [1] |
Seasonal Cycle Score [1] |
Spatial Distribution Score [1] |
Interannual Variability Score [1] |
Overall Score [1] |
|||
|---|---|---|---|---|---|---|---|---|---|---|---|---|---|---|---|---|---|
| Benchmark | [-] | 443. | |||||||||||||||
| CLM4.5SP | [-] | 446. | 446. | 443. | 446. | 3.36 | 15.0 | 1.01 | 0.688 | 0.512 | 0.864 | 0.991 | 0.611 | 0.696 | |||
| CLM4SP | [-] | 444. | 444. | 443. | 446. | 1.31 | 15.2 | 1.07 | 0.702 | 0.498 | 0.861 | 0.986 | 0.607 | 0.692 | |||
| CLM5SP | [-] | 447. | 447. | 443. | 446. | 4.28 | 15.8 | 1.12 | 0.674 | 0.494 | 0.854 | 0.987 | 0.599 | 0.684 |
Download Data |
Period Mean (original grids) [W/m2] |
Model Period Mean (intersection) [W/m2] |
Model Period Mean (complement) [W/m2] |
Benchmark Period Mean (intersection) [W/m2] |
Benchmark Period Mean (complement) [W/m2] |
Bias [W/m2] |
RMSE [W/m2] |
Phase Shift [months] |
Bias Score [1] |
RMSE Score [1] |
Seasonal Cycle Score [1] |
Spatial Distribution Score [1] |
Interannual Variability Score [1] |
Overall Score [1] |
|||
|---|---|---|---|---|---|---|---|---|---|---|---|---|---|---|---|---|---|
| Benchmark | [-] | 279. | |||||||||||||||
| CLM4.5SP | [-] | 276. | 276. | 278. | 296. | 0.332 | 15.0 | 0.126 | 0.913 | 0.808 | 0.990 | 0.997 | 0.763 | 0.880 | |||
| CLM4SP | [-] | 275. | 275. | 278. | 296. | -0.533 | 14.9 | 0.126 | 0.913 | 0.809 | 0.990 | 0.995 | 0.771 | 0.881 | |||
| CLM5SP | [-] | 277. | 277. | 278. | 296. | 2.04 | 15.4 | 0.131 | 0.907 | 0.807 | 0.990 | 0.999 | 0.744 | 0.876 |
Download Data |
Period Mean (original grids) [W/m2] |
Model Period Mean (intersection) [W/m2] |
Model Period Mean (complement) [W/m2] |
Benchmark Period Mean (intersection) [W/m2] |
Benchmark Period Mean (complement) [W/m2] |
Bias [W/m2] |
RMSE [W/m2] |
Phase Shift [months] |
Bias Score [1] |
RMSE Score [1] |
Seasonal Cycle Score [1] |
Spatial Distribution Score [1] |
Interannual Variability Score [1] |
Overall Score [1] |
|||
|---|---|---|---|---|---|---|---|---|---|---|---|---|---|---|---|---|---|
| Benchmark | [-] | 457. | |||||||||||||||
| CLM4.5SP | [-] | 455. | 455. | 454. | 467. | 2.33 | 13.8 | 1.56 | 0.315 | 0.381 | 0.762 | 0.564 | 0.575 | 0.496 | |||
| CLM4SP | [-] | 454. | 454. | 454. | 467. | 1.55 | 13.7 | 1.66 | 0.328 | 0.380 | 0.745 | 0.576 | 0.582 | 0.498 | |||
| CLM5SP | [-] | 457. | 457. | 454. | 467. | 3.88 | 14.0 | 1.70 | 0.300 | 0.387 | 0.734 | 0.581 | 0.565 | 0.492 |
Download Data |
Period Mean (original grids) [W/m2] |
Model Period Mean (intersection) [W/m2] |
Model Period Mean (complement) [W/m2] |
Benchmark Period Mean (intersection) [W/m2] |
Benchmark Period Mean (complement) [W/m2] |
Bias [W/m2] |
RMSE [W/m2] |
Phase Shift [months] |
Bias Score [1] |
RMSE Score [1] |
Seasonal Cycle Score [1] |
Spatial Distribution Score [1] |
Interannual Variability Score [1] |
Overall Score [1] |
|||
|---|---|---|---|---|---|---|---|---|---|---|---|---|---|---|---|---|---|
| Benchmark | [-] | 312. | |||||||||||||||
| CLM4.5SP | [-] | 314. | 314. | 311. | 334. | 2.44 | 10.1 | 0.0396 | 0.939 | 0.883 | 0.997 | 1.00 | 0.865 | 0.928 | |||
| CLM4SP | [-] | 313. | 313. | 311. | 334. | 1.91 | 9.98 | 0.0356 | 0.938 | 0.884 | 0.998 | 1.00 | 0.870 | 0.929 | |||
| CLM5SP | [-] | 316. | 316. | 311. | 334. | 5.08 | 11.3 | 0.0416 | 0.914 | 0.885 | 0.997 | 1.00 | 0.856 | 0.923 |
Download Data |
Period Mean (original grids) [W/m2] |
Model Period Mean (intersection) [W/m2] |
Model Period Mean (complement) [W/m2] |
Benchmark Period Mean (intersection) [W/m2] |
Benchmark Period Mean (complement) [W/m2] |
Bias [W/m2] |
RMSE [W/m2] |
Phase Shift [months] |
Bias Score [1] |
RMSE Score [1] |
Seasonal Cycle Score [1] |
Spatial Distribution Score [1] |
Interannual Variability Score [1] |
Overall Score [1] |
|||
|---|---|---|---|---|---|---|---|---|---|---|---|---|---|---|---|---|---|
| Benchmark | [-] | 364. | |||||||||||||||
| CLM4.5SP | [-] | 364. | 363. | 363. | 399. | 2.27 | 13.4 | 0.105 | 0.865 | 0.829 | 0.992 | 0.995 | 0.770 | 0.880 | |||
| CLM4SP | [-] | 363. | 363. | 363. | 399. | 1.83 | 13.2 | 0.103 | 0.869 | 0.829 | 0.992 | 0.997 | 0.776 | 0.882 | |||
| CLM5SP | [-] | 366. | 366. | 363. | 399. | 4.67 | 14.4 | 0.103 | 0.848 | 0.826 | 0.992 | 0.993 | 0.755 | 0.873 |
Download Data |
Period Mean (original grids) [W/m2] |
Model Period Mean (intersection) [W/m2] |
Model Period Mean (complement) [W/m2] |
Benchmark Period Mean (intersection) [W/m2] |
Benchmark Period Mean (complement) [W/m2] |
Bias [W/m2] |
RMSE [W/m2] |
Phase Shift [months] |
Bias Score [1] |
RMSE Score [1] |
Seasonal Cycle Score [1] |
Spatial Distribution Score [1] |
Interannual Variability Score [1] |
Overall Score [1] |
|||
|---|---|---|---|---|---|---|---|---|---|---|---|---|---|---|---|---|---|
| Benchmark | [-] | 448. | |||||||||||||||
| CLM4.5SP | [-] | 449. | 450. | 446. | 467. | 5.58 | 16.3 | 0.660 | 0.656 | 0.579 | 0.932 | 0.977 | 0.632 | 0.726 | |||
| CLM4SP | [-] | 450. | 450. | 446. | 467. | 5.80 | 16.6 | 0.658 | 0.649 | 0.573 | 0.932 | 0.982 | 0.635 | 0.724 | |||
| CLM5SP | [-] | 451. | 451. | 446. | 467. | 7.04 | 17.1 | 0.677 | 0.643 | 0.573 | 0.931 | 0.965 | 0.621 | 0.717 |
Download Data |
Period Mean (original grids) [W/m2] |
Model Period Mean (intersection) [W/m2] |
Model Period Mean (complement) [W/m2] |
Benchmark Period Mean (intersection) [W/m2] |
Benchmark Period Mean (complement) [W/m2] |
Bias [W/m2] |
RMSE [W/m2] |
Phase Shift [months] |
Bias Score [1] |
RMSE Score [1] |
Seasonal Cycle Score [1] |
Spatial Distribution Score [1] |
Interannual Variability Score [1] |
Overall Score [1] |
|||
|---|---|---|---|---|---|---|---|---|---|---|---|---|---|---|---|---|---|
| Benchmark | [-] | 281. | |||||||||||||||
| CLM4.5SP | [-] | 282. | 282. | 281. | 288. | 1.95 | 12.8 | 0.0824 | 0.933 | 0.822 | 0.993 | 1.00 | 0.767 | 0.889 | |||
| CLM4SP | [-] | 281. | 281. | 281. | 288. | 1.39 | 12.7 | 0.0844 | 0.935 | 0.821 | 0.993 | 0.999 | 0.777 | 0.891 | |||
| CLM5SP | [-] | 283. | 283. | 281. | 288. | 3.53 | 13.2 | 0.0829 | 0.921 | 0.824 | 0.993 | 0.999 | 0.762 | 0.887 |
Download Data |
Period Mean (original grids) [W/m2] |
Model Period Mean (intersection) [W/m2] |
Model Period Mean (complement) [W/m2] |
Benchmark Period Mean (intersection) [W/m2] |
Benchmark Period Mean (complement) [W/m2] |
Bias [W/m2] |
RMSE [W/m2] |
Phase Shift [months] |
Bias Score [1] |
RMSE Score [1] |
Seasonal Cycle Score [1] |
Spatial Distribution Score [1] |
Interannual Variability Score [1] |
Overall Score [1] |
|||
|---|---|---|---|---|---|---|---|---|---|---|---|---|---|---|---|---|---|
| Benchmark | [-] | 441. | |||||||||||||||
| CLM4.5SP | [-] | 445. | 445. | 443. | 426. | -0.532 | 11.7 | 0.348 | 0.834 | 0.710 | 0.971 | 0.998 | 0.745 | 0.828 | |||
| CLM4SP | [-] | 444. | 444. | 443. | 426. | -1.33 | 11.6 | 0.356 | 0.844 | 0.710 | 0.970 | 1.00 | 0.748 | 0.830 | |||
| CLM5SP | [-] | 446. | 446. | 443. | 426. | 0.648 | 12.3 | 0.382 | 0.835 | 0.696 | 0.969 | 0.998 | 0.717 | 0.818 |
Download Data |
Period Mean (original grids) [W/m2] |
Model Period Mean (intersection) [W/m2] |
Model Period Mean (complement) [W/m2] |
Benchmark Period Mean (intersection) [W/m2] |
Benchmark Period Mean (complement) [W/m2] |
Bias [W/m2] |
RMSE [W/m2] |
Phase Shift [months] |
Bias Score [1] |
RMSE Score [1] |
Seasonal Cycle Score [1] |
Spatial Distribution Score [1] |
Interannual Variability Score [1] |
Overall Score [1] |
|||
|---|---|---|---|---|---|---|---|---|---|---|---|---|---|---|---|---|---|
| Benchmark | [-] | 368. | |||||||||||||||
| CLM4.5SP | [-] | 362. | 362. | 366. | 389. | -0.632 | 11.4 | 0.207 | 0.856 | 0.775 | 0.986 | 0.999 | 0.795 | 0.865 | |||
| CLM4SP | [-] | 362. | 362. | 366. | 389. | -0.658 | 11.4 | 0.196 | 0.859 | 0.775 | 0.987 | 1.00 | 0.789 | 0.864 | |||
| CLM5SP | [-] | 364. | 364. | 366. | 389. | 1.15 | 11.6 | 0.230 | 0.859 | 0.776 | 0.985 | 0.997 | 0.774 | 0.861 |
Download Data |
Period Mean (original grids) [W/m2] |
Model Period Mean (intersection) [W/m2] |
Model Period Mean (complement) [W/m2] |
Benchmark Period Mean (intersection) [W/m2] |
Benchmark Period Mean (complement) [W/m2] |
Bias [W/m2] |
RMSE [W/m2] |
Phase Shift [months] |
Bias Score [1] |
RMSE Score [1] |
Seasonal Cycle Score [1] |
Spatial Distribution Score [1] |
Interannual Variability Score [1] |
Overall Score [1] |
|||
|---|---|---|---|---|---|---|---|---|---|---|---|---|---|---|---|---|---|
| Benchmark | [-] | 399. | |||||||||||||||
| CLM4.5SP | [-] | 377. | 377. | 376. | 409. | 3.05 | 14.3 | 0.485 | 0.763 | 0.679 | 0.945 | 1.00 | 0.707 | 0.795 | |||
| CLM4SP | [-] | 377. | 377. | 376. | 409. | 2.37 | 14.3 | 0.487 | 0.769 | 0.676 | 0.945 | 1.00 | 0.710 | 0.796 | |||
| CLM5SP | [-] | 380. | 380. | 376. | 409. | 5.23 | 15.4 | 0.494 | 0.742 | 0.672 | 0.944 | 0.999 | 0.687 | 0.786 |
Download Data |
Period Mean (original grids) [W/m2] |
Model Period Mean (intersection) [W/m2] |
Model Period Mean (complement) [W/m2] |
Benchmark Period Mean (intersection) [W/m2] |
Benchmark Period Mean (complement) [W/m2] |
Bias [W/m2] |
RMSE [W/m2] |
Phase Shift [months] |
Bias Score [1] |
RMSE Score [1] |
Seasonal Cycle Score [1] |
Spatial Distribution Score [1] |
Interannual Variability Score [1] |
Overall Score [1] |
|||
|---|---|---|---|---|---|---|---|---|---|---|---|---|---|---|---|---|---|
| Benchmark | [-] | 450. | |||||||||||||||
| CLM4.5SP | [-] | 451. | 451. | 450. | 446. | 0.992 | 14.7 | 0.336 | 0.848 | 0.764 | 0.975 | 1.00 | 0.736 | 0.848 | |||
| CLM4SP | [-] | 451. | 451. | 450. | 446. | 1.18 | 14.7 | 0.333 | 0.845 | 0.764 | 0.975 | 1.00 | 0.741 | 0.848 | |||
| CLM5SP | [-] | 452. | 452. | 450. | 446. | 2.34 | 15.0 | 0.322 | 0.844 | 0.761 | 0.976 | 0.999 | 0.714 | 0.843 |
Download Data |
Period Mean (original grids) [W/m2] |
Model Period Mean (intersection) [W/m2] |
Model Period Mean (complement) [W/m2] |
Benchmark Period Mean (intersection) [W/m2] |
Benchmark Period Mean (complement) [W/m2] |
Bias [W/m2] |
RMSE [W/m2] |
Phase Shift [months] |
Bias Score [1] |
RMSE Score [1] |
Seasonal Cycle Score [1] |
Spatial Distribution Score [1] |
Interannual Variability Score [1] |
Overall Score [1] |
|||
|---|---|---|---|---|---|---|---|---|---|---|---|---|---|---|---|---|---|
| Benchmark | [-] | 281. | |||||||||||||||
| CLM4.5SP | [-] | 284. | 284. | 281. | 293. | 3.63 | 15.0 | 0.161 | 0.907 | 0.803 | 0.987 | 1.00 | 0.783 | 0.880 | |||
| CLM4SP | [-] | 284. | 284. | 281. | 293. | 3.10 | 14.6 | 0.170 | 0.910 | 0.807 | 0.986 | 1.00 | 0.789 | 0.883 | |||
| CLM5SP | [-] | 287. | 287. | 281. | 293. | 6.28 | 16.8 | 0.170 | 0.886 | 0.791 | 0.986 | 1.00 | 0.764 | 0.870 |
Download Data |
Period Mean (original grids) [W/m2] |
Model Period Mean (intersection) [W/m2] |
Model Period Mean (complement) [W/m2] |
Benchmark Period Mean (intersection) [W/m2] |
Benchmark Period Mean (complement) [W/m2] |
Bias [W/m2] |
RMSE [W/m2] |
Phase Shift [months] |
Bias Score [1] |
RMSE Score [1] |
Seasonal Cycle Score [1] |
Spatial Distribution Score [1] |
Interannual Variability Score [1] |
Overall Score [1] |
|||
|---|---|---|---|---|---|---|---|---|---|---|---|---|---|---|---|---|---|
| Benchmark | [-] | 442. | |||||||||||||||
| CLM4.5SP | [-] | 442. | 442. | 439. | 459. | 7.62 | 15.8 | 0.842 | 0.582 | 0.571 | 0.892 | 0.963 | 0.688 | 0.711 | |||
| CLM4SP | [-] | 441. | 441. | 439. | 459. | 6.34 | 15.4 | 0.829 | 0.592 | 0.573 | 0.894 | 0.965 | 0.689 | 0.714 | |||
| CLM5SP | [-] | 444. | 444. | 439. | 459. | 8.98 | 16.4 | 0.854 | 0.562 | 0.573 | 0.894 | 0.961 | 0.667 | 0.705 |
Download Data |
Period Mean (original grids) [W/m2] |
Model Period Mean (intersection) [W/m2] |
Model Period Mean (complement) [W/m2] |
Benchmark Period Mean (intersection) [W/m2] |
Benchmark Period Mean (complement) [W/m2] |
Bias [W/m2] |
RMSE [W/m2] |
Phase Shift [months] |
Bias Score [1] |
RMSE Score [1] |
Seasonal Cycle Score [1] |
Spatial Distribution Score [1] |
Interannual Variability Score [1] |
Overall Score [1] |
|||
|---|---|---|---|---|---|---|---|---|---|---|---|---|---|---|---|---|---|
| Benchmark | [-] | 386. | |||||||||||||||
| CLM4.5SP | [-] | 388. | 388. | 384. | 429. | 5.80 | 10.5 | 0.101 | 0.872 | 0.861 | 0.993 | 0.998 | 0.863 | 0.908 | |||
| CLM4SP | [-] | 387. | 387. | 384. | 429. | 5.24 | 10.4 | 0.0715 | 0.876 | 0.858 | 0.995 | 0.998 | 0.863 | 0.908 | |||
| CLM5SP | [-] | 390. | 390. | 384. | 429. | 7.99 | 11.9 | 0.0700 | 0.839 | 0.861 | 0.995 | 0.998 | 0.851 | 0.901 |
Download Data |
Period Mean (original grids) [W/m2] |
Model Period Mean (intersection) [W/m2] |
Model Period Mean (complement) [W/m2] |
Benchmark Period Mean (intersection) [W/m2] |
Benchmark Period Mean (complement) [W/m2] |
Bias [W/m2] |
RMSE [W/m2] |
Phase Shift [months] |
Bias Score [1] |
RMSE Score [1] |
Seasonal Cycle Score [1] |
Spatial Distribution Score [1] |
Interannual Variability Score [1] |
Overall Score [1] |
|||
|---|---|---|---|---|---|---|---|---|---|---|---|---|---|---|---|---|---|
| Benchmark | [-] | 324. | |||||||||||||||
| CLM4.5SP | [-] | 327. | 327. | 323. | 347. | 4.28 | 12.2 | 0.0532 | 0.897 | 0.834 | 0.996 | 0.971 | 0.788 | 0.887 | |||
| CLM4SP | [-] | 325. | 326. | 323. | 347. | 3.12 | 11.9 | 0.0527 | 0.906 | 0.832 | 0.996 | 0.971 | 0.795 | 0.889 | |||
| CLM5SP | [-] | 329. | 329. | 323. | 347. | 6.71 | 13.5 | 0.0540 | 0.872 | 0.833 | 0.996 | 0.966 | 0.779 | 0.880 |
Download Data |
Period Mean (original grids) [W/m2] |
Model Period Mean (intersection) [W/m2] |
Model Period Mean (complement) [W/m2] |
Benchmark Period Mean (intersection) [W/m2] |
Benchmark Period Mean (complement) [W/m2] |
Bias [W/m2] |
RMSE [W/m2] |
Phase Shift [months] |
Bias Score [1] |
RMSE Score [1] |
Seasonal Cycle Score [1] |
Spatial Distribution Score [1] |
Interannual Variability Score [1] |
Overall Score [1] |
|||
|---|---|---|---|---|---|---|---|---|---|---|---|---|---|---|---|---|---|
| Benchmark | [-] | 377. | |||||||||||||||
| CLM4.5SP | [-] | 378. | 379. | 377. | 378. | 2.27 | 12.6 | 0.0867 | 0.858 | 0.826 | 0.994 | 0.999 | 0.773 | 0.879 | |||
| CLM4SP | [-] | 378. | 379. | 377. | 378. | 2.17 | 12.7 | 0.0910 | 0.860 | 0.822 | 0.993 | 0.999 | 0.767 | 0.877 | |||
| CLM5SP | [-] | 380. | 381. | 377. | 378. | 4.28 | 13.6 | 0.0956 | 0.851 | 0.817 | 0.993 | 1.00 | 0.730 | 0.868 |
Download Data |
Period Mean (original grids) [W/m2] |
Model Period Mean (intersection) [W/m2] |
Model Period Mean (complement) [W/m2] |
Benchmark Period Mean (intersection) [W/m2] |
Benchmark Period Mean (complement) [W/m2] |
Bias [W/m2] |
RMSE [W/m2] |
Phase Shift [months] |
Bias Score [1] |
RMSE Score [1] |
Seasonal Cycle Score [1] |
Spatial Distribution Score [1] |
Interannual Variability Score [1] |
Overall Score [1] |
|||
|---|---|---|---|---|---|---|---|---|---|---|---|---|---|---|---|---|---|
| Benchmark | [-] | 449. | |||||||||||||||
| CLM4.5SP | [-] | 455. | 455. | 449. | 463. | 6.41 | 13.1 | 1.19 | 0.394 | 0.394 | 0.846 | 0.998 | 0.623 | 0.608 | |||
| CLM4SP | [-] | 454. | 454. | 449. | 463. | 5.36 | 12.6 | 1.16 | 0.420 | 0.398 | 0.847 | 0.997 | 0.626 | 0.614 | |||
| CLM5SP | [-] | 457. | 457. | 449. | 463. | 8.33 | 14.2 | 1.22 | 0.342 | 0.398 | 0.837 | 0.999 | 0.623 | 0.600 |
Download Data |
Period Mean (original grids) [W/m2] |
Model Period Mean (intersection) [W/m2] |
Model Period Mean (complement) [W/m2] |
Benchmark Period Mean (intersection) [W/m2] |
Benchmark Period Mean (complement) [W/m2] |
Bias [W/m2] |
RMSE [W/m2] |
Phase Shift [months] |
Bias Score [1] |
RMSE Score [1] |
Seasonal Cycle Score [1] |
Spatial Distribution Score [1] |
Interannual Variability Score [1] |
Overall Score [1] |
|||
|---|---|---|---|---|---|---|---|---|---|---|---|---|---|---|---|---|---|
| Benchmark | [-] | 443. | |||||||||||||||
| CLM4.5SP | [-] | 446. | 445. | 443. | 434. | 1.75 | 12.4 | 0.834 | 0.772 | 0.575 | 0.877 | 1.00 | 0.657 | 0.743 | |||
| CLM4SP | [-] | 445. | 444. | 443. | 434. | 1.01 | 12.4 | 0.769 | 0.770 | 0.577 | 0.890 | 0.999 | 0.652 | 0.744 | |||
| CLM5SP | [-] | 447. | 447. | 443. | 434. | 3.23 | 12.7 | 0.810 | 0.756 | 0.573 | 0.885 | 0.999 | 0.646 | 0.739 |
Download Data |
Period Mean (original grids) [W/m2] |
Model Period Mean (intersection) [W/m2] |
Model Period Mean (complement) [W/m2] |
Benchmark Period Mean (intersection) [W/m2] |
Benchmark Period Mean (complement) [W/m2] |
Bias [W/m2] |
RMSE [W/m2] |
Phase Shift [months] |
Bias Score [1] |
RMSE Score [1] |
Seasonal Cycle Score [1] |
Spatial Distribution Score [1] |
Interannual Variability Score [1] |
Overall Score [1] |
|||
|---|---|---|---|---|---|---|---|---|---|---|---|---|---|---|---|---|---|
| Benchmark | [-] | 383. | |||||||||||||||
| CLM4.5SP | [-] | 385. | 384. | 381. | 396. | 4.05 | 19.6 | 0.905 | 0.639 | 0.570 | 0.887 | 0.997 | 0.647 | 0.718 | |||
| CLM4SP | [-] | 384. | 383. | 381. | 396. | 2.97 | 19.3 | 0.900 | 0.650 | 0.574 | 0.888 | 0.996 | 0.649 | 0.722 | |||
| CLM5SP | [-] | 388. | 387. | 381. | 396. | 6.19 | 20.3 | 0.938 | 0.621 | 0.567 | 0.881 | 0.993 | 0.620 | 0.708 |
Temporally integrated period mean