Mean State
Download Data |
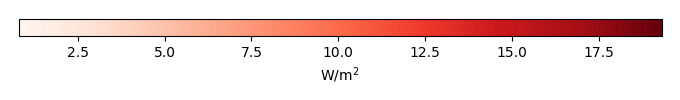
Period Mean (original grids) [W/m2] |
Model Period Mean (intersection) [W/m2] |
Model Period Mean (complement) [W/m2] |
Benchmark Period Mean (intersection) [W/m2] |
Benchmark Period Mean (complement) [W/m2] |
Bias [W/m2] |
RMSE [W/m2] |
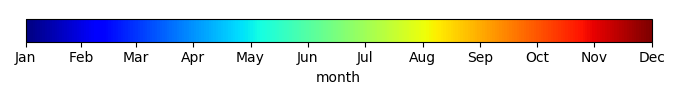
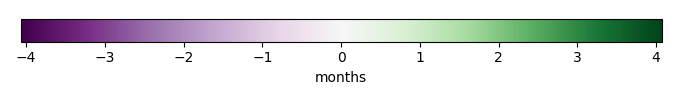
Phase Shift [months] |
Bias Score [1] |
RMSE Score [1] |
Seasonal Cycle Score [1] |
Spatial Distribution Score [1] |
Interannual Variability Score [1] |
Overall Score [1] |
|||
|---|---|---|---|---|---|---|---|---|---|---|---|---|---|---|---|---|---|
| Benchmark | [-] | 31.3 | |||||||||||||||
| CLM4.5SP | [-] | 34.1 | 33.8 | 32.3 | 12.4 | 2.13 | 7.06 | 1.83 | 0.461 | 0.348 | 0.737 | 0.966 | 0.658 | 0.587 | |||
| CLM4SP | [-] | 32.6 | 32.3 | 32.3 | 12.4 | 0.405 | 7.02 | 1.82 | 0.468 | 0.358 | 0.737 | 0.916 | 0.646 | 0.580 | |||
| CLM5SP | [-] | 33.6 | 33.3 | 32.3 | 12.4 | 1.64 | 7.15 | 1.87 | 0.459 | 0.342 | 0.730 | 0.948 | 0.660 | 0.580 |
Download Data |
Period Mean (original grids) [W/m2] |
Model Period Mean (intersection) [W/m2] |
Model Period Mean (complement) [W/m2] |
Benchmark Period Mean (intersection) [W/m2] |
Benchmark Period Mean (complement) [W/m2] |
Bias [W/m2] |
RMSE [W/m2] |
Phase Shift [months] |
Bias Score [1] |
RMSE Score [1] |
Seasonal Cycle Score [1] |
Spatial Distribution Score [1] |
Interannual Variability Score [1] |
Overall Score [1] |
|||
|---|---|---|---|---|---|---|---|---|---|---|---|---|---|---|---|---|---|
| Benchmark | [-] | 44.7 | |||||||||||||||
| CLM4.5SP | [-] | 46.3 | 46.8 | 45.1 | 13.9 | 1.48 | 8.13 | 1.07 | 0.522 | 0.373 | 0.868 | 0.988 | 0.624 | 0.625 | |||
| CLM4SP | [-] | 44.7 | 45.2 | 45.1 | 13.9 | -0.285 | 8.04 | 1.06 | 0.497 | 0.394 | 0.863 | 0.949 | 0.617 | 0.619 | |||
| CLM5SP | [-] | 45.8 | 46.4 | 45.1 | 13.9 | 0.978 | 8.24 | 1.01 | 0.530 | 0.361 | 0.878 | 0.984 | 0.640 | 0.626 |
Download Data |
Period Mean (original grids) [W/m2] |
Model Period Mean (intersection) [W/m2] |
Model Period Mean (complement) [W/m2] |
Benchmark Period Mean (intersection) [W/m2] |
Benchmark Period Mean (complement) [W/m2] |
Bias [W/m2] |
RMSE [W/m2] |
Phase Shift [months] |
Bias Score [1] |
RMSE Score [1] |
Seasonal Cycle Score [1] |
Spatial Distribution Score [1] |
Interannual Variability Score [1] |
Overall Score [1] |
|||
|---|---|---|---|---|---|---|---|---|---|---|---|---|---|---|---|---|---|
| Benchmark | [-] | 33.4 | |||||||||||||||
| CLM4.5SP | [-] | 36.4 | 36.4 | 34.3 | 15.0 | 2.21 | 7.84 | 1.41 | 0.590 | 0.427 | 0.807 | 0.935 | 0.637 | 0.637 | |||
| CLM4SP | [-] | 35.6 | 35.6 | 34.3 | 15.0 | 1.08 | 7.47 | 1.36 | 0.576 | 0.434 | 0.813 | 0.895 | 0.629 | 0.630 | |||
| CLM5SP | [-] | 35.9 | 35.9 | 34.3 | 15.0 | 1.64 | 7.77 | 1.43 | 0.596 | 0.430 | 0.803 | 0.920 | 0.655 | 0.639 |
Download Data |
Period Mean (original grids) [W/m2] |
Model Period Mean (intersection) [W/m2] |
Model Period Mean (complement) [W/m2] |
Benchmark Period Mean (intersection) [W/m2] |
Benchmark Period Mean (complement) [W/m2] |
Bias [W/m2] |
RMSE [W/m2] |
Phase Shift [months] |
Bias Score [1] |
RMSE Score [1] |
Seasonal Cycle Score [1] |
Spatial Distribution Score [1] |
Interannual Variability Score [1] |
Overall Score [1] |
|||
|---|---|---|---|---|---|---|---|---|---|---|---|---|---|---|---|---|---|
| Benchmark | [-] | 40.8 | |||||||||||||||
| CLM4.5SP | [-] | 35.4 | 35.3 | 41.2 | 35.6 | -5.40 | 20.5 | 0.190 | 0.839 | 0.671 | 0.987 | 0.746 | 0.699 | 0.769 | |||
| CLM4SP | [-] | 36.5 | 36.4 | 41.2 | 35.6 | -4.56 | 23.0 | 0.275 | 0.832 | 0.638 | 0.982 | 0.959 | 0.761 | 0.802 | |||
| CLM5SP | [-] | 36.2 | 36.2 | 41.2 | 35.6 | -4.63 | 19.4 | 0.186 | 0.848 | 0.686 | 0.987 | 0.766 | 0.700 | 0.779 |
Download Data |
Period Mean (original grids) [W/m2] |
Model Period Mean (intersection) [W/m2] |
Model Period Mean (complement) [W/m2] |
Benchmark Period Mean (intersection) [W/m2] |
Benchmark Period Mean (complement) [W/m2] |
Bias [W/m2] |
RMSE [W/m2] |
Phase Shift [months] |
Bias Score [1] |
RMSE Score [1] |
Seasonal Cycle Score [1] |
Spatial Distribution Score [1] |
Interannual Variability Score [1] |
Overall Score [1] |
|||
|---|---|---|---|---|---|---|---|---|---|---|---|---|---|---|---|---|---|
| Benchmark | [-] | 17.7 | |||||||||||||||
| CLM4.5SP | [-] | 26.6 | 26.6 | 19.3 | 12.3 | 7.99 | 9.96 | 1.49 | 0.286 | 0.371 | 0.773 | 0.377 | 0.685 | 0.477 | |||
| CLM4SP | [-] | 26.0 | 26.0 | 19.3 | 12.3 | 7.13 | 9.23 | 1.45 | 0.298 | 0.375 | 0.779 | 0.242 | 0.681 | 0.458 | |||
| CLM5SP | [-] | 26.6 | 26.5 | 19.3 | 12.3 | 7.96 | 9.93 | 1.49 | 0.287 | 0.372 | 0.772 | 0.360 | 0.684 | 0.475 |
Download Data |
Period Mean (original grids) [W/m2] |
Model Period Mean (intersection) [W/m2] |
Model Period Mean (complement) [W/m2] |
Benchmark Period Mean (intersection) [W/m2] |
Benchmark Period Mean (complement) [W/m2] |
Bias [W/m2] |
RMSE [W/m2] |
Phase Shift [months] |
Bias Score [1] |
RMSE Score [1] |
Seasonal Cycle Score [1] |
Spatial Distribution Score [1] |
Interannual Variability Score [1] |
Overall Score [1] |
|||
|---|---|---|---|---|---|---|---|---|---|---|---|---|---|---|---|---|---|
| Benchmark | [-] | 28.1 | |||||||||||||||
| CLM4.5SP | [-] | 23.0 | 22.8 | 28.2 | 21.3 | -5.33 | 13.0 | 0.366 | 0.763 | 0.593 | 0.967 | 0.933 | 0.621 | 0.745 | |||
| CLM4SP | [-] | 20.6 | 20.4 | 28.2 | 21.3 | -7.65 | 15.9 | 0.768 | 0.680 | 0.537 | 0.904 | 0.963 | 0.586 | 0.701 | |||
| CLM5SP | [-] | 23.7 | 23.6 | 28.2 | 21.3 | -4.57 | 11.7 | 0.267 | 0.787 | 0.623 | 0.982 | 0.927 | 0.650 | 0.765 |
Download Data |
Period Mean (original grids) [W/m2] |
Model Period Mean (intersection) [W/m2] |
Model Period Mean (complement) [W/m2] |
Benchmark Period Mean (intersection) [W/m2] |
Benchmark Period Mean (complement) [W/m2] |
Bias [W/m2] |
RMSE [W/m2] |
Phase Shift [months] |
Bias Score [1] |
RMSE Score [1] |
Seasonal Cycle Score [1] |
Spatial Distribution Score [1] |
Interannual Variability Score [1] |
Overall Score [1] |
|||
|---|---|---|---|---|---|---|---|---|---|---|---|---|---|---|---|---|---|
| Benchmark | [-] | 35.8 | |||||||||||||||
| CLM4.5SP | [-] | 36.7 | 36.6 | 36.5 | 15.2 | -0.644 | 10.7 | 0.872 | 0.713 | 0.541 | 0.889 | 0.966 | 0.667 | 0.719 | |||
| CLM4SP | [-] | 36.4 | 36.3 | 36.5 | 15.2 | -0.986 | 10.8 | 0.972 | 0.715 | 0.536 | 0.873 | 0.983 | 0.658 | 0.717 | |||
| CLM5SP | [-] | 34.7 | 34.7 | 36.5 | 15.2 | -2.49 | 11.0 | 0.929 | 0.692 | 0.542 | 0.880 | 0.909 | 0.679 | 0.707 |
Download Data |
Period Mean (original grids) [W/m2] |
Model Period Mean (intersection) [W/m2] |
Model Period Mean (complement) [W/m2] |
Benchmark Period Mean (intersection) [W/m2] |
Benchmark Period Mean (complement) [W/m2] |
Bias [W/m2] |
RMSE [W/m2] |
Phase Shift [months] |
Bias Score [1] |
RMSE Score [1] |
Seasonal Cycle Score [1] |
Spatial Distribution Score [1] |
Interannual Variability Score [1] |
Overall Score [1] |
|||
|---|---|---|---|---|---|---|---|---|---|---|---|---|---|---|---|---|---|
| Benchmark | [-] | 29.2 | |||||||||||||||
| CLM4.5SP | [-] | 33.3 | 33.3 | 30.4 | 12.7 | 2.31 | 9.33 | 1.04 | 0.550 | 0.430 | 0.877 | 0.900 | 0.638 | 0.637 | |||
| CLM4SP | [-] | 32.8 | 32.7 | 30.4 | 12.7 | 1.65 | 8.94 | 1.04 | 0.554 | 0.439 | 0.878 | 0.936 | 0.631 | 0.646 | |||
| CLM5SP | [-] | 32.5 | 32.5 | 30.4 | 12.7 | 1.55 | 9.29 | 1.01 | 0.553 | 0.432 | 0.880 | 0.829 | 0.648 | 0.629 |
Download Data |
Period Mean (original grids) [W/m2] |
Model Period Mean (intersection) [W/m2] |
Model Period Mean (complement) [W/m2] |
Benchmark Period Mean (intersection) [W/m2] |
Benchmark Period Mean (complement) [W/m2] |
Bias [W/m2] |
RMSE [W/m2] |
Phase Shift [months] |
Bias Score [1] |
RMSE Score [1] |
Seasonal Cycle Score [1] |
Spatial Distribution Score [1] |
Interannual Variability Score [1] |
Overall Score [1] |
|||
|---|---|---|---|---|---|---|---|---|---|---|---|---|---|---|---|---|---|
| Benchmark | [-] | 36.1 | |||||||||||||||
| CLM4.5SP | [-] | 34.3 | 34.1 | 36.1 | 36.1 | -1.65 | 17.2 | 0.168 | 0.898 | 0.704 | 0.989 | 0.827 | 0.729 | 0.808 | |||
| CLM4SP | [-] | 33.8 | 33.7 | 36.1 | 36.1 | -2.28 | 18.6 | 0.218 | 0.894 | 0.679 | 0.985 | 0.908 | 0.765 | 0.819 | |||
| CLM5SP | [-] | 34.8 | 34.6 | 36.1 | 36.1 | -1.12 | 16.8 | 0.180 | 0.901 | 0.711 | 0.988 | 0.835 | 0.734 | 0.813 |
Download Data |
Period Mean (original grids) [W/m2] |
Model Period Mean (intersection) [W/m2] |
Model Period Mean (complement) [W/m2] |
Benchmark Period Mean (intersection) [W/m2] |
Benchmark Period Mean (complement) [W/m2] |
Bias [W/m2] |
RMSE [W/m2] |
Phase Shift [months] |
Bias Score [1] |
RMSE Score [1] |
Seasonal Cycle Score [1] |
Spatial Distribution Score [1] |
Interannual Variability Score [1] |
Overall Score [1] |
|||
|---|---|---|---|---|---|---|---|---|---|---|---|---|---|---|---|---|---|
| Benchmark | [-] | 36.6 | |||||||||||||||
| CLM4.5SP | [-] | 42.5 | 42.5 | 38.5 | 12.8 | 2.79 | 8.24 | 0.613 | 0.649 | 0.584 | 0.946 | 0.928 | 0.616 | 0.718 | |||
| CLM4SP | [-] | 38.5 | 38.5 | 38.5 | 12.8 | -1.07 | 8.58 | 0.619 | 0.612 | 0.586 | 0.945 | 0.831 | 0.588 | 0.692 | |||
| CLM5SP | [-] | 41.1 | 41.2 | 38.5 | 12.8 | 1.47 | 8.23 | 0.639 | 0.659 | 0.579 | 0.940 | 0.905 | 0.685 | 0.724 |
Download Data |
Period Mean (original grids) [W/m2] |
Model Period Mean (intersection) [W/m2] |
Model Period Mean (complement) [W/m2] |
Benchmark Period Mean (intersection) [W/m2] |
Benchmark Period Mean (complement) [W/m2] |
Bias [W/m2] |
RMSE [W/m2] |
Phase Shift [months] |
Bias Score [1] |
RMSE Score [1] |
Seasonal Cycle Score [1] |
Spatial Distribution Score [1] |
Interannual Variability Score [1] |
Overall Score [1] |
|||
|---|---|---|---|---|---|---|---|---|---|---|---|---|---|---|---|---|---|
| Benchmark | [-] | 19.6 | |||||||||||||||
| CLM4.5SP | [-] | 21.8 | 21.8 | 20.5 | 10.1 | 1.19 | 8.80 | 0.856 | 0.687 | 0.571 | 0.893 | 0.835 | 0.646 | 0.700 | |||
| CLM4SP | [-] | 20.0 | 20.1 | 20.5 | 10.1 | -0.647 | 8.83 | 0.601 | 0.654 | 0.579 | 0.934 | 0.909 | 0.607 | 0.710 | |||
| CLM5SP | [-] | 21.5 | 21.5 | 20.5 | 10.1 | 0.863 | 8.58 | 0.775 | 0.684 | 0.580 | 0.906 | 0.794 | 0.635 | 0.696 |
Download Data |
Period Mean (original grids) [W/m2] |
Model Period Mean (intersection) [W/m2] |
Model Period Mean (complement) [W/m2] |
Benchmark Period Mean (intersection) [W/m2] |
Benchmark Period Mean (complement) [W/m2] |
Bias [W/m2] |
RMSE [W/m2] |
Phase Shift [months] |
Bias Score [1] |
RMSE Score [1] |
Seasonal Cycle Score [1] |
Spatial Distribution Score [1] |
Interannual Variability Score [1] |
Overall Score [1] |
|||
|---|---|---|---|---|---|---|---|---|---|---|---|---|---|---|---|---|---|
| Benchmark | [-] | 24.0 | |||||||||||||||
| CLM4.5SP | [-] | 45.4 | 45.4 | 44.8 | 14.0 | -0.430 | 12.4 | 0.759 | 0.656 | 0.556 | 0.906 | 0.990 | 0.663 | 0.721 | |||
| CLM4SP | [-] | 44.6 | 44.6 | 44.8 | 14.0 | -1.33 | 12.4 | 0.795 | 0.639 | 0.554 | 0.901 | 0.992 | 0.652 | 0.715 | |||
| CLM5SP | [-] | 44.8 | 44.8 | 44.8 | 14.0 | -0.878 | 12.3 | 0.759 | 0.654 | 0.557 | 0.907 | 0.991 | 0.671 | 0.723 |
Download Data |
Period Mean (original grids) [W/m2] |
Model Period Mean (intersection) [W/m2] |
Model Period Mean (complement) [W/m2] |
Benchmark Period Mean (intersection) [W/m2] |
Benchmark Period Mean (complement) [W/m2] |
Bias [W/m2] |
RMSE [W/m2] |
Phase Shift [months] |
Bias Score [1] |
RMSE Score [1] |
Seasonal Cycle Score [1] |
Spatial Distribution Score [1] |
Interannual Variability Score [1] |
Overall Score [1] |
|||
|---|---|---|---|---|---|---|---|---|---|---|---|---|---|---|---|---|---|
| Benchmark | [-] | 72.5 | |||||||||||||||
| CLM4.5SP | [-] | 79.8 | 79.6 | 74.7 | 16.4 | 3.07 | 13.5 | 0.655 | 0.597 | 0.584 | 0.933 | 0.978 | 0.646 | 0.720 | |||
| CLM4SP | [-] | 77.9 | 77.7 | 74.7 | 16.4 | 0.832 | 13.0 | 0.647 | 0.588 | 0.593 | 0.935 | 0.971 | 0.643 | 0.720 | |||
| CLM5SP | [-] | 78.5 | 78.3 | 74.7 | 16.4 | 1.72 | 13.9 | 0.707 | 0.592 | 0.561 | 0.928 | 0.982 | 0.704 | 0.721 |
Download Data |
Period Mean (original grids) [W/m2] |
Model Period Mean (intersection) [W/m2] |
Model Period Mean (complement) [W/m2] |
Benchmark Period Mean (intersection) [W/m2] |
Benchmark Period Mean (complement) [W/m2] |
Bias [W/m2] |
RMSE [W/m2] |
Phase Shift [months] |
Bias Score [1] |
RMSE Score [1] |
Seasonal Cycle Score [1] |
Spatial Distribution Score [1] |
Interannual Variability Score [1] |
Overall Score [1] |
|||
|---|---|---|---|---|---|---|---|---|---|---|---|---|---|---|---|---|---|
| Benchmark | [-] | 46.1 | |||||||||||||||
| CLM4.5SP | [-] | 37.9 | 37.9 | 46.3 | 43.2 | -7.34 | 23.4 | 0.185 | 0.843 | 0.664 | 0.985 | 0.919 | 0.701 | 0.796 | |||
| CLM4SP | [-] | 38.4 | 38.5 | 46.3 | 43.2 | -6.84 | 25.3 | 0.233 | 0.841 | 0.640 | 0.982 | 0.986 | 0.736 | 0.804 | |||
| CLM5SP | [-] | 38.7 | 38.7 | 46.3 | 43.2 | -6.61 | 22.0 | 0.202 | 0.852 | 0.680 | 0.984 | 0.931 | 0.700 | 0.804 |
Download Data |
Period Mean (original grids) [W/m2] |
Model Period Mean (intersection) [W/m2] |
Model Period Mean (complement) [W/m2] |
Benchmark Period Mean (intersection) [W/m2] |
Benchmark Period Mean (complement) [W/m2] |
Bias [W/m2] |
RMSE [W/m2] |
Phase Shift [months] |
Bias Score [1] |
RMSE Score [1] |
Seasonal Cycle Score [1] |
Spatial Distribution Score [1] |
Interannual Variability Score [1] |
Overall Score [1] |
|||
|---|---|---|---|---|---|---|---|---|---|---|---|---|---|---|---|---|---|
| Benchmark | [-] | 26.3 | |||||||||||||||
| CLM4.5SP | [-] | 34.5 | 34.5 | 28.9 | 13.2 | 4.90 | 10.2 | 0.739 | 0.459 | 0.498 | 0.907 | 0.737 | 0.645 | 0.624 | |||
| CLM4SP | [-] | 33.0 | 32.9 | 28.9 | 13.2 | 2.98 | 9.21 | 0.748 | 0.460 | 0.508 | 0.907 | 0.738 | 0.632 | 0.625 | |||
| CLM5SP | [-] | 33.8 | 33.8 | 28.9 | 13.2 | 4.32 | 10.3 | 0.711 | 0.446 | 0.500 | 0.912 | 0.684 | 0.672 | 0.619 |
Download Data |
Period Mean (original grids) [W/m2] |
Model Period Mean (intersection) [W/m2] |
Model Period Mean (complement) [W/m2] |
Benchmark Period Mean (intersection) [W/m2] |
Benchmark Period Mean (complement) [W/m2] |
Bias [W/m2] |
RMSE [W/m2] |
Phase Shift [months] |
Bias Score [1] |
RMSE Score [1] |
Seasonal Cycle Score [1] |
Spatial Distribution Score [1] |
Interannual Variability Score [1] |
Overall Score [1] |
|||
|---|---|---|---|---|---|---|---|---|---|---|---|---|---|---|---|---|---|
| Benchmark | [-] | 26.9 | |||||||||||||||
| CLM4.5SP | [-] | 27.3 | 27.1 | 27.6 | 12.3 | -0.644 | 8.48 | 1.05 | 0.694 | 0.537 | 0.837 | 0.876 | 0.650 | 0.689 | |||
| CLM4SP | [-] | 25.0 | 24.8 | 27.6 | 12.3 | -3.09 | 8.75 | 0.679 | 0.608 | 0.557 | 0.914 | 0.898 | 0.596 | 0.688 | |||
| CLM5SP | [-] | 27.0 | 26.8 | 27.6 | 12.3 | -0.918 | 8.37 | 0.999 | 0.687 | 0.542 | 0.848 | 0.832 | 0.643 | 0.682 |
Download Data |
Period Mean (original grids) [W/m2] |
Model Period Mean (intersection) [W/m2] |
Model Period Mean (complement) [W/m2] |
Benchmark Period Mean (intersection) [W/m2] |
Benchmark Period Mean (complement) [W/m2] |
Bias [W/m2] |
RMSE [W/m2] |
Phase Shift [months] |
Bias Score [1] |
RMSE Score [1] |
Seasonal Cycle Score [1] |
Spatial Distribution Score [1] |
Interannual Variability Score [1] |
Overall Score [1] |
|||
|---|---|---|---|---|---|---|---|---|---|---|---|---|---|---|---|---|---|
| Benchmark | [-] | 26.3 | |||||||||||||||
| CLM4.5SP | [-] | 23.0 | 23.2 | 26.9 | 10.9 | -3.81 | 13.2 | 0.512 | 0.715 | 0.550 | 0.936 | 0.973 | 0.592 | 0.719 | |||
| CLM4SP | [-] | 21.1 | 21.1 | 26.9 | 10.9 | -5.91 | 16.0 | 1.06 | 0.658 | 0.500 | 0.846 | 0.970 | 0.565 | 0.673 | |||
| CLM5SP | [-] | 23.4 | 23.6 | 26.9 | 10.9 | -3.43 | 12.3 | 0.404 | 0.727 | 0.573 | 0.953 | 0.955 | 0.613 | 0.732 |
Download Data |
Period Mean (original grids) [W/m2] |
Model Period Mean (intersection) [W/m2] |
Model Period Mean (complement) [W/m2] |
Benchmark Period Mean (intersection) [W/m2] |
Benchmark Period Mean (complement) [W/m2] |
Bias [W/m2] |
RMSE [W/m2] |
Phase Shift [months] |
Bias Score [1] |
RMSE Score [1] |
Seasonal Cycle Score [1] |
Spatial Distribution Score [1] |
Interannual Variability Score [1] |
Overall Score [1] |
|||
|---|---|---|---|---|---|---|---|---|---|---|---|---|---|---|---|---|---|
| Benchmark | [-] | 38.3 | |||||||||||||||
| CLM4.5SP | [-] | 36.1 | 36.0 | 38.7 | 12.8 | -3.06 | 9.45 | 0.886 | 0.719 | 0.594 | 0.867 | 0.989 | 0.711 | 0.746 | |||
| CLM4SP | [-] | 34.2 | 34.2 | 38.7 | 12.8 | -4.90 | 10.7 | 1.09 | 0.675 | 0.569 | 0.824 | 0.993 | 0.652 | 0.714 | |||
| CLM5SP | [-] | 33.6 | 33.7 | 38.7 | 12.8 | -5.41 | 10.3 | 0.981 | 0.657 | 0.589 | 0.851 | 0.989 | 0.723 | 0.733 |
Download Data |
Period Mean (original grids) [W/m2] |
Model Period Mean (intersection) [W/m2] |
Model Period Mean (complement) [W/m2] |
Benchmark Period Mean (intersection) [W/m2] |
Benchmark Period Mean (complement) [W/m2] |
Bias [W/m2] |
RMSE [W/m2] |
Phase Shift [months] |
Bias Score [1] |
RMSE Score [1] |
Seasonal Cycle Score [1] |
Spatial Distribution Score [1] |
Interannual Variability Score [1] |
Overall Score [1] |
|||
|---|---|---|---|---|---|---|---|---|---|---|---|---|---|---|---|---|---|
| Benchmark | [-] | 27.6 | |||||||||||||||
| CLM4.5SP | [-] | 26.4 | 26.4 | 28.0 | 11.7 | -1.37 | 5.26 | 1.15 | 0.491 | 0.454 | 0.856 | 0.738 | 0.621 | 0.602 | |||
| CLM4SP | [-] | 25.9 | 25.9 | 28.0 | 11.7 | -1.95 | 5.47 | 1.16 | 0.455 | 0.454 | 0.856 | 0.656 | 0.614 | 0.582 | |||
| CLM5SP | [-] | 26.4 | 26.4 | 28.0 | 11.7 | -1.43 | 5.27 | 1.14 | 0.488 | 0.454 | 0.860 | 0.711 | 0.619 | 0.598 |
Download Data |
Period Mean (original grids) [W/m2] |
Model Period Mean (intersection) [W/m2] |
Model Period Mean (complement) [W/m2] |
Benchmark Period Mean (intersection) [W/m2] |
Benchmark Period Mean (complement) [W/m2] |
Bias [W/m2] |
RMSE [W/m2] |
Phase Shift [months] |
Bias Score [1] |
RMSE Score [1] |
Seasonal Cycle Score [1] |
Spatial Distribution Score [1] |
Interannual Variability Score [1] |
Overall Score [1] |
|||
|---|---|---|---|---|---|---|---|---|---|---|---|---|---|---|---|---|---|
| Benchmark | [-] | 31.2 | |||||||||||||||
| CLM4.5SP | [-] | 30.9 | 31.0 | 31.8 | 11.7 | -0.851 | 6.38 | 1.17 | 0.650 | 0.509 | 0.853 | 0.709 | 0.635 | 0.644 | |||
| CLM4SP | [-] | 29.7 | 29.8 | 31.8 | 11.7 | -2.09 | 6.67 | 1.10 | 0.584 | 0.511 | 0.865 | 0.617 | 0.616 | 0.617 | |||
| CLM5SP | [-] | 30.6 | 30.6 | 31.8 | 11.7 | -1.25 | 6.35 | 1.08 | 0.634 | 0.515 | 0.864 | 0.658 | 0.631 | 0.636 |
Download Data |
Period Mean (original grids) [W/m2] |
Model Period Mean (intersection) [W/m2] |
Model Period Mean (complement) [W/m2] |
Benchmark Period Mean (intersection) [W/m2] |
Benchmark Period Mean (complement) [W/m2] |
Bias [W/m2] |
RMSE [W/m2] |
Phase Shift [months] |
Bias Score [1] |
RMSE Score [1] |
Seasonal Cycle Score [1] |
Spatial Distribution Score [1] |
Interannual Variability Score [1] |
Overall Score [1] |
|||
|---|---|---|---|---|---|---|---|---|---|---|---|---|---|---|---|---|---|
| Benchmark | [-] | 30.1 | |||||||||||||||
| CLM4.5SP | [-] | 34.7 | 34.7 | 32.0 | 13.9 | 2.06 | 9.77 | 0.788 | 0.564 | 0.533 | 0.909 | 0.975 | 0.675 | 0.698 | |||
| CLM4SP | [-] | 33.4 | 33.4 | 32.0 | 13.9 | 0.626 | 9.35 | 0.799 | 0.572 | 0.546 | 0.907 | 0.978 | 0.643 | 0.699 | |||
| CLM5SP | [-] | 32.2 | 32.2 | 32.0 | 13.9 | -0.193 | 9.94 | 0.876 | 0.555 | 0.534 | 0.902 | 0.958 | 0.712 | 0.699 |
Temporally integrated period mean