Mean State
Download Data |
Period Mean (original grids) [Pg] |
Model Period Mean (intersection) [Pg] |
Model Period Mean (complement) [Pg] |
Benchmark Period Mean (intersection) [Pg] |
Benchmark Period Mean (complement) [Pg] |
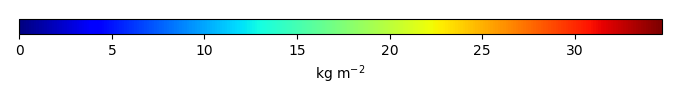
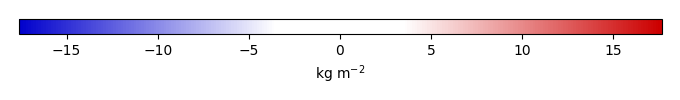
Bias [kg m-2] |
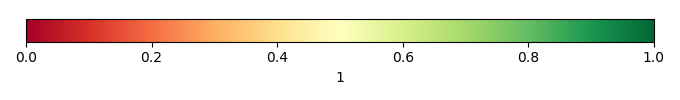
Bias Score [1] |
Spatial Distribution Score [1] |
Overall Score [1] |
|||
|---|---|---|---|---|---|---|---|---|---|---|---|---|
| Benchmark | [-] | 64.0 | ||||||||||
| CRUNCEPv7 | [-] | 42.9 | 43.1 | 0.424 | 63.9 | 0.0663 | -5.75 | 0.673 | 0.674 | 0.674 | ||
| GSWP3v1 | [-] | 38.4 | 38.4 | 0.429 | 63.9 | 0.0663 | -7.15 | 0.634 | 0.580 | 0.607 | ||
| WATCH | [-] | 39.0 | 39.4 | 0.457 | 63.9 | 0.0663 | -6.86 | 0.638 | 0.550 | 0.594 |
Download Data |
Period Mean (original grids) [Pg] |
Model Period Mean (intersection) [Pg] |
Model Period Mean (complement) [Pg] |
Benchmark Period Mean (intersection) [Pg] |
Benchmark Period Mean (complement) [Pg] |
Bias [kg m-2] |
Bias Score [1] |
Spatial Distribution Score [1] |
Overall Score [1] |
|||
|---|---|---|---|---|---|---|---|---|---|---|---|---|
| Benchmark | [-] | 3.34 | ||||||||||
| CRUNCEPv7 | [-] | 3.63 | 2.48 | 0.742 | 3.34 | 0.00700 | -0.242 | 0.530 | 0.584 | 0.557 | ||
| GSWP3v1 | [-] | 3.30 | 2.21 | 0.738 | 3.34 | 0.00700 | -0.331 | 0.497 | 0.570 | 0.533 | ||
| WATCH | [-] | 6.16 | 4.63 | 0.862 | 3.34 | 0.00700 | 0.480 | 0.522 | 0.803 | 0.663 |
Download Data |
Period Mean (original grids) [Pg] |
Model Period Mean (intersection) [Pg] |
Model Period Mean (complement) [Pg] |
Benchmark Period Mean (intersection) [Pg] |
Benchmark Period Mean (complement) [Pg] |
Bias [kg m-2] |
Bias Score [1] |
Spatial Distribution Score [1] |
Overall Score [1] |
|||
|---|---|---|---|---|---|---|---|---|---|---|---|---|
| Benchmark | [-] | 14.1 | ||||||||||
| CRUNCEPv7 | [-] | 17.0 | 15.6 | 1.11 | 14.1 | 0.0194 | 0.409 | 0.565 | 0.833 | 0.699 | ||
| GSWP3v1 | [-] | 12.3 | 11.1 | 0.996 | 14.1 | 0.0194 | -0.223 | 0.547 | 0.791 | 0.669 | ||
| WATCH | [-] | 20.7 | 19.2 | 1.13 | 14.1 | 0.0194 | 0.926 | 0.539 | 0.839 | 0.689 |
Download Data |
Period Mean (original grids) [Pg] |
Model Period Mean (intersection) [Pg] |
Model Period Mean (complement) [Pg] |
Benchmark Period Mean (intersection) [Pg] |
Benchmark Period Mean (complement) [Pg] |
Bias [kg m-2] |
Bias Score [1] |
Spatial Distribution Score [1] |
Overall Score [1] |
|||
|---|---|---|---|---|---|---|---|---|---|---|---|---|
| Benchmark | [-] | 1.22 | ||||||||||
| CRUNCEPv7 | [-] | 5.09 | 4.27 | 0.836 | 1.22 | 0.00453 | 1.36 | 0.373 | 0.449 | 0.411 | ||
| GSWP3v1 | [-] | 4.18 | 3.37 | 0.817 | 1.22 | 0.00453 | 0.991 | 0.469 | 0.503 | 0.486 | ||
| WATCH | [-] | 5.42 | 4.62 | 0.834 | 1.22 | 0.00453 | 1.50 | 0.347 | 0.639 | 0.493 |
Download Data |
Period Mean (original grids) [Pg] |
Model Period Mean (intersection) [Pg] |
Model Period Mean (complement) [Pg] |
Benchmark Period Mean (intersection) [Pg] |
Benchmark Period Mean (complement) [Pg] |
Bias [kg m-2] |
Bias Score [1] |
Spatial Distribution Score [1] |
Overall Score [1] |
|||
|---|---|---|---|---|---|---|---|---|---|---|---|---|
| Benchmark | [-] | 47.3 | ||||||||||
| CRUNCEPv7 | [-] | 49.6 | 47.1 | 2.28 | 45.9 | 1.37 | 5.89 | 0.713 | 0.643 | 0.678 | ||
| GSWP3v1 | [-] | 40.1 | 38.1 | 1.81 | 45.9 | 1.37 | 2.33 | 0.683 | 0.514 | 0.598 | ||
| WATCH | [-] | 39.0 | 36.9 | 1.88 | 45.9 | 1.37 | 1.96 | 0.660 | 0.427 | 0.543 |
Download Data |
Period Mean (original grids) [Pg] |
Model Period Mean (intersection) [Pg] |
Model Period Mean (complement) [Pg] |
Benchmark Period Mean (intersection) [Pg] |
Benchmark Period Mean (complement) [Pg] |
Bias [kg m-2] |
Bias Score [1] |
Spatial Distribution Score [1] |
Overall Score [1] |
|||
|---|---|---|---|---|---|---|---|---|---|---|---|---|
| Benchmark | [-] | 41.6 | ||||||||||
| CRUNCEPv7 | [-] | 73.2 | 71.5 | 0.536 | 41.6 | 0.0303 | 3.57 | 0.495 | 0.669 | 0.582 | ||
| GSWP3v1 | [-] | 52.3 | 51.1 | 0.450 | 41.6 | 0.0303 | 1.23 | 0.552 | 0.742 | 0.647 | ||
| WATCH | [-] | 50.2 | 49.0 | 0.389 | 41.6 | 0.0303 | 0.955 | 0.712 | 0.937 | 0.825 |
Download Data |
Period Mean (original grids) [Pg] |
Model Period Mean (intersection) [Pg] |
Model Period Mean (complement) [Pg] |
Benchmark Period Mean (intersection) [Pg] |
Benchmark Period Mean (complement) [Pg] |
Bias [kg m-2] |
Bias Score [1] |
Spatial Distribution Score [1] |
Overall Score [1] |
|||
|---|---|---|---|---|---|---|---|---|---|---|---|---|
| Benchmark | [-] | 15.6 | ||||||||||
| CRUNCEPv7 | [-] | 36.3 | 33.8 | 3.32 | 15.6 | 0.0349 | 2.50 | 0.453 | 0.586 | 0.520 | ||
| GSWP3v1 | [-] | 31.8 | 29.6 | 2.96 | 15.6 | 0.0349 | 1.93 | 0.506 | 0.676 | 0.591 | ||
| WATCH | [-] | 33.4 | 30.3 | 3.72 | 15.6 | 0.0349 | 2.00 | 0.536 | 0.757 | 0.647 |
Download Data |
Period Mean (original grids) [Pg] |
Model Period Mean (intersection) [Pg] |
Model Period Mean (complement) [Pg] |
Benchmark Period Mean (intersection) [Pg] |
Benchmark Period Mean (complement) [Pg] |
Bias [kg m-2] |
Bias Score [1] |
Spatial Distribution Score [1] |
Overall Score [1] |
|||
|---|---|---|---|---|---|---|---|---|---|---|---|---|
| Benchmark | [-] | 14.8 | ||||||||||
| CRUNCEPv7 | [-] | 25.5 | 23.4 | 1.50 | 14.6 | 0.136 | 2.67 | 0.533 | 0.691 | 0.612 | ||
| GSWP3v1 | [-] | 24.9 | 22.6 | 1.43 | 14.6 | 0.136 | 2.37 | 0.529 | 0.734 | 0.632 | ||
| WATCH | [-] | 25.6 | 23.4 | 1.53 | 14.6 | 0.136 | 2.50 | 0.546 | 0.769 | 0.657 |
Download Data |
Period Mean (original grids) [Pg] |
Model Period Mean (intersection) [Pg] |
Model Period Mean (complement) [Pg] |
Benchmark Period Mean (intersection) [Pg] |
Benchmark Period Mean (complement) [Pg] |
Bias [kg m-2] |
Bias Score [1] |
Spatial Distribution Score [1] |
Overall Score [1] |
|||
|---|---|---|---|---|---|---|---|---|---|---|---|---|
| Benchmark | [-] | 1.78 | ||||||||||
| CRUNCEPv7 | [-] | 8.91 | 7.07 | 2.32 | 1.78 | 2.69 | 0.306 | 0.542 | 0.424 | |||
| GSWP3v1 | [-] | 6.90 | 5.31 | 1.98 | 1.78 | 1.79 | 0.402 | 0.575 | 0.489 | |||
| WATCH | [-] | 5.09 | 4.34 | 1.01 | 1.78 | 1.29 | 0.532 | 0.864 | 0.698 |
Download Data |
Period Mean (original grids) [Pg] |
Model Period Mean (intersection) [Pg] |
Model Period Mean (complement) [Pg] |
Benchmark Period Mean (intersection) [Pg] |
Benchmark Period Mean (complement) [Pg] |
Bias [kg m-2] |
Bias Score [1] |
Spatial Distribution Score [1] |
Overall Score [1] |
|||
|---|---|---|---|---|---|---|---|---|---|---|---|---|
| Benchmark | [-] | 15.3 | ||||||||||
| CRUNCEPv7 | [-] | 11.8 | 9.77 | 1.81 | 14.8 | 0.505 | -0.0658 | 0.552 | 0.795 | 0.674 | ||
| GSWP3v1 | [-] | 11.3 | 9.25 | 1.86 | 14.8 | 0.505 | -0.174 | 0.552 | 0.810 | 0.681 | ||
| WATCH | [-] | 12.1 | 9.98 | 1.90 | 14.8 | 0.505 | -0.0371 | 0.562 | 0.821 | 0.692 |
Download Data |
Period Mean (original grids) [Pg] |
Model Period Mean (intersection) [Pg] |
Model Period Mean (complement) [Pg] |
Benchmark Period Mean (intersection) [Pg] |
Benchmark Period Mean (complement) [Pg] |
Bias [kg m-2] |
Bias Score [1] |
Spatial Distribution Score [1] |
Overall Score [1] |
|||
|---|---|---|---|---|---|---|---|---|---|---|---|---|
| Benchmark | [-] | 13.1 | ||||||||||
| CRUNCEPv7 | [-] | 26.8 | 25.2 | 1.18 | 13.1 | 0.0236 | 3.21 | 0.498 | 0.593 | 0.545 | ||
| GSWP3v1 | [-] | 18.2 | 17.0 | 0.899 | 13.1 | 0.0236 | 1.50 | 0.498 | 0.694 | 0.596 | ||
| WATCH | [-] | 13.4 | 12.3 | 0.812 | 13.1 | 0.0236 | 0.547 | 0.542 | 0.797 | 0.669 |
Download Data |
Period Mean (original grids) [Pg] |
Model Period Mean (intersection) [Pg] |
Model Period Mean (complement) [Pg] |
Benchmark Period Mean (intersection) [Pg] |
Benchmark Period Mean (complement) [Pg] |
Bias [kg m-2] |
Bias Score [1] |
Spatial Distribution Score [1] |
Overall Score [1] |
|||
|---|---|---|---|---|---|---|---|---|---|---|---|---|
| Benchmark | [-] | 455. | ||||||||||
| CRUNCEPv7 | [-] | 590. | 564. | 26.5 | 449. | 5.38 | 1.95 | 0.646 | 0.887 | 0.767 | ||
| GSWP3v1 | [-] | 487. | 464. | 23.3 | 449. | 5.38 | 0.776 | 0.637 | 0.859 | 0.748 | ||
| WATCH | [-] | 507. | 484. | 23.4 | 449. | 5.38 | 0.972 | 0.675 | 0.871 | 0.773 |
Download Data |
Period Mean (original grids) [Pg] |
Model Period Mean (intersection) [Pg] |
Model Period Mean (complement) [Pg] |
Benchmark Period Mean (intersection) [Pg] |
Benchmark Period Mean (complement) [Pg] |
Bias [kg m-2] |
Bias Score [1] |
Spatial Distribution Score [1] |
Overall Score [1] |
|||
|---|---|---|---|---|---|---|---|---|---|---|---|---|
| Benchmark | [-] | 0.854 | ||||||||||
| CRUNCEPv7 | [-] | 1.62 | 0.656 | 0.960 | 0.849 | 0.00531 | 0.00552 | 0.479 | 0.638 | 0.558 | ||
| GSWP3v1 | [-] | 1.51 | 0.664 | 0.856 | 0.849 | 0.00531 | 0.0462 | 0.484 | 0.722 | 0.603 | ||
| WATCH | [-] | 2.22 | 1.14 | 1.06 | 0.849 | 0.00531 | 0.389 | 0.511 | 0.761 | 0.636 |
Download Data |
Period Mean (original grids) [Pg] |
Model Period Mean (intersection) [Pg] |
Model Period Mean (complement) [Pg] |
Benchmark Period Mean (intersection) [Pg] |
Benchmark Period Mean (complement) [Pg] |
Bias [kg m-2] |
Bias Score [1] |
Spatial Distribution Score [1] |
Overall Score [1] |
|||
|---|---|---|---|---|---|---|---|---|---|---|---|---|
| Benchmark | [-] | 2.82 | ||||||||||
| CRUNCEPv7 | [-] | 16.4 | 13.6 | 2.63 | 2.82 | 0.00299 | 3.44 | 0.272 | 0.311 | 0.292 | ||
| GSWP3v1 | [-] | 14.5 | 12.3 | 2.08 | 2.82 | 0.00299 | 3.01 | 0.268 | 0.346 | 0.307 | ||
| WATCH | [-] | 11.4 | 9.42 | 1.85 | 2.82 | 0.00299 | 2.11 | 0.365 | 0.477 | 0.421 |
Download Data |
Period Mean (original grids) [Pg] |
Model Period Mean (intersection) [Pg] |
Model Period Mean (complement) [Pg] |
Benchmark Period Mean (intersection) [Pg] |
Benchmark Period Mean (complement) [Pg] |
Bias [kg m-2] |
Bias Score [1] |
Spatial Distribution Score [1] |
Overall Score [1] |
|||
|---|---|---|---|---|---|---|---|---|---|---|---|---|
| Benchmark | [-] | 4.95 | ||||||||||
| CRUNCEPv7 | [-] | 12.0 | 10.8 | 0.884 | 4.88 | 0.0615 | 3.93 | 0.383 | 0.418 | 0.401 | ||
| GSWP3v1 | [-] | 10.2 | 9.16 | 0.789 | 4.88 | 0.0615 | 3.11 | 0.449 | 0.515 | 0.482 | ||
| WATCH | [-] | 10.8 | 9.81 | 0.800 | 4.88 | 0.0615 | 3.42 | 0.438 | 0.544 | 0.491 |
Download Data |
Period Mean (original grids) [Pg] |
Model Period Mean (intersection) [Pg] |
Model Period Mean (complement) [Pg] |
Benchmark Period Mean (intersection) [Pg] |
Benchmark Period Mean (complement) [Pg] |
Bias [kg m-2] |
Bias Score [1] |
Spatial Distribution Score [1] |
Overall Score [1] |
|||
|---|---|---|---|---|---|---|---|---|---|---|---|---|
| Benchmark | [-] | 13.0 | ||||||||||
| CRUNCEPv7 | [-] | 17.6 | 17.1 | 0.407 | 13.0 | 0.00854 | 1.40 | 0.643 | 0.886 | 0.764 | ||
| GSWP3v1 | [-] | 11.8 | 11.4 | 0.332 | 13.0 | 0.00854 | -0.100 | 0.652 | 0.874 | 0.763 | ||
| WATCH | [-] | 14.0 | 13.6 | 0.317 | 13.0 | 0.00854 | 0.422 | 0.691 | 0.888 | 0.789 |
Download Data |
Period Mean (original grids) [Pg] |
Model Period Mean (intersection) [Pg] |
Model Period Mean (complement) [Pg] |
Benchmark Period Mean (intersection) [Pg] |
Benchmark Period Mean (complement) [Pg] |
Bias [kg m-2] |
Bias Score [1] |
Spatial Distribution Score [1] |
Overall Score [1] |
|||
|---|---|---|---|---|---|---|---|---|---|---|---|---|
| Benchmark | [-] | 21.4 | ||||||||||
| CRUNCEPv7 | [-] | 57.0 | 56.6 | 0.599 | 21.3 | 0.128 | 7.37 | 0.369 | 0.705 | 0.537 | ||
| GSWP3v1 | [-] | 43.8 | 43.5 | 0.471 | 21.3 | 0.128 | 4.72 | 0.474 | 0.788 | 0.631 | ||
| WATCH | [-] | 39.2 | 38.9 | 0.429 | 21.3 | 0.128 | 3.78 | 0.542 | 0.876 | 0.709 |
Download Data |
Period Mean (original grids) [Pg] |
Model Period Mean (intersection) [Pg] |
Model Period Mean (complement) [Pg] |
Benchmark Period Mean (intersection) [Pg] |
Benchmark Period Mean (complement) [Pg] |
Bias [kg m-2] |
Bias Score [1] |
Spatial Distribution Score [1] |
Overall Score [1] |
|||
|---|---|---|---|---|---|---|---|---|---|---|---|---|
| Benchmark | [-] | 9.57 | ||||||||||
| CRUNCEPv7 | [-] | 3.52 | 3.30 | 0.245 | 9.53 | 0.0397 | -1.79 | 0.500 | 0.650 | 0.575 | ||
| GSWP3v1 | [-] | 3.09 | 2.90 | 0.233 | 9.53 | 0.0397 | -1.92 | 0.486 | 0.493 | 0.489 | ||
| WATCH | [-] | 3.38 | 3.16 | 0.245 | 9.53 | 0.0397 | -1.85 | 0.489 | 0.518 | 0.504 |
Download Data |
Period Mean (original grids) [Pg] |
Model Period Mean (intersection) [Pg] |
Model Period Mean (complement) [Pg] |
Benchmark Period Mean (intersection) [Pg] |
Benchmark Period Mean (complement) [Pg] |
Bias [kg m-2] |
Bias Score [1] |
Spatial Distribution Score [1] |
Overall Score [1] |
|||
|---|---|---|---|---|---|---|---|---|---|---|---|---|
| Benchmark | [-] | 151. | ||||||||||
| CRUNCEPv7 | [-] | 152. | 151. | 0.651 | 151. | 0.0403 | 0.381 | 0.805 | 0.872 | 0.839 | ||
| GSWP3v1 | [-] | 129. | 128. | 0.570 | 151. | 0.0403 | -2.41 | 0.765 | 0.777 | 0.771 | ||
| WATCH | [-] | 145. | 144. | 0.555 | 151. | 0.0403 | -0.517 | 0.812 | 0.858 | 0.835 |
Download Data |
Period Mean (original grids) [Pg] |
Model Period Mean (intersection) [Pg] |
Model Period Mean (complement) [Pg] |
Benchmark Period Mean (intersection) [Pg] |
Benchmark Period Mean (complement) [Pg] |
Bias [kg m-2] |
Bias Score [1] |
Spatial Distribution Score [1] |
Overall Score [1] |
|||
|---|---|---|---|---|---|---|---|---|---|---|---|---|
| Benchmark | [-] | 10.7 | ||||||||||
| CRUNCEPv7 | [-] | 21.4 | 21.3 | 0.571 | 10.7 | 0.0170 | 1.85 | 0.508 | 0.812 | 0.660 | ||
| GSWP3v1 | [-] | 21.5 | 21.4 | 0.512 | 10.7 | 0.0170 | 1.83 | 0.517 | 0.807 | 0.662 | ||
| WATCH | [-] | 23.6 | 23.5 | 0.530 | 10.7 | 0.0170 | 2.14 | 0.524 | 0.830 | 0.677 |
Download Data |
Period Mean (original grids) [Pg] |
Model Period Mean (intersection) [Pg] |
Model Period Mean (complement) [Pg] |
Benchmark Period Mean (intersection) [Pg] |
Benchmark Period Mean (complement) [Pg] |
Bias [kg m-2] |
Bias Score [1] |
Spatial Distribution Score [1] |
Overall Score [1] |
|||
|---|---|---|---|---|---|---|---|---|---|---|---|---|
| Benchmark | [-] | 4.41 | ||||||||||
| CRUNCEPv7 | [-] | 5.25 | 4.84 | 0.454 | 4.31 | 0.102 | 1.14 | 0.588 | 0.767 | 0.678 | ||
| GSWP3v1 | [-] | 6.25 | 5.78 | 0.493 | 4.31 | 0.102 | 1.41 | 0.590 | 0.801 | 0.695 | ||
| WATCH | [-] | 5.95 | 5.52 | 0.476 | 4.31 | 0.102 | 1.20 | 0.619 | 0.837 | 0.728 |
Temporally integrated period mean