Mean State
Download Data |
Period Mean (original grids) [Pg] |
Model Period Mean (intersection) [Pg] |
Model Period Mean (complement) [Pg] |
Benchmark Period Mean (intersection) [Pg] |
Benchmark Period Mean (complement) [Pg] |
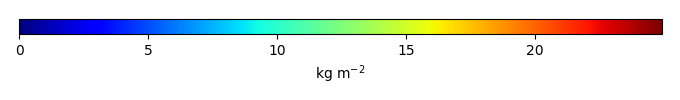
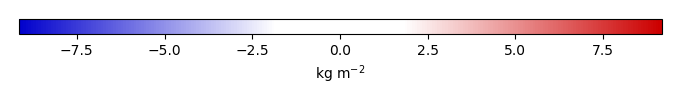
Bias [kg m-2] |
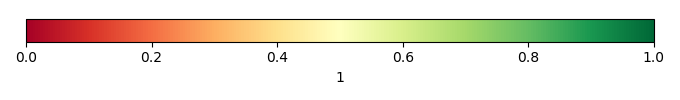
Bias Score [1] |
Spatial Distribution Score [1] |
Overall Score [1] |
|||
|---|---|---|---|---|---|---|---|---|---|---|---|---|
| Benchmark | [-] | 38.7 | ||||||||||
| CRUNCEPv7 | [-] | 42.9 | 43.3 | 0.201 | 38.7 | 0.0457 | 1.34 | 0.709 | 0.904 | 0.807 | ||
| GSWP3v1 | [-] | 38.5 | 38.7 | 0.202 | 38.7 | 0.0457 | 0.293 | 0.774 | 0.952 | 0.863 | ||
| WATCH | [-] | 38.8 | 39.5 | 0.189 | 38.7 | 0.0457 | 0.454 | 0.786 | 0.962 | 0.874 |
Download Data |
Period Mean (original grids) [Pg] |
Model Period Mean (intersection) [Pg] |
Model Period Mean (complement) [Pg] |
Benchmark Period Mean (intersection) [Pg] |
Benchmark Period Mean (complement) [Pg] |
Bias [kg m-2] |
Bias Score [1] |
Spatial Distribution Score [1] |
Overall Score [1] |
|||
|---|---|---|---|---|---|---|---|---|---|---|---|---|
| Benchmark | [-] | 11.9 | ||||||||||
| CRUNCEPv7 | [-] | 3.54 | 3.10 | 0.0369 | 11.9 | 0.0196 | -1.31 | 0.465 | 0.623 | 0.544 | ||
| GSWP3v1 | [-] | 3.25 | 2.85 | 0.0430 | 11.9 | 0.0196 | -1.35 | 0.454 | 0.594 | 0.524 | ||
| WATCH | [-] | 6.17 | 5.45 | 0.0493 | 11.9 | 0.0196 | -0.954 | 0.516 | 0.841 | 0.678 |
Download Data |
Period Mean (original grids) [Pg] |
Model Period Mean (intersection) [Pg] |
Model Period Mean (complement) [Pg] |
Benchmark Period Mean (intersection) [Pg] |
Benchmark Period Mean (complement) [Pg] |
Bias [kg m-2] |
Bias Score [1] |
Spatial Distribution Score [1] |
Overall Score [1] |
|||
|---|---|---|---|---|---|---|---|---|---|---|---|---|
| Benchmark | [-] | 24.6 | ||||||||||
| CRUNCEPv7 | [-] | 17.0 | 16.3 | 0.393 | 24.5 | 0.0612 | -0.721 | 0.558 | 0.788 | 0.673 | ||
| GSWP3v1 | [-] | 12.3 | 11.7 | 0.367 | 24.5 | 0.0612 | -1.21 | 0.507 | 0.799 | 0.653 | ||
| WATCH | [-] | 20.7 | 20.0 | 0.395 | 24.5 | 0.0612 | -0.328 | 0.552 | 0.734 | 0.643 |
Download Data |
Period Mean (original grids) [Pg] |
Model Period Mean (intersection) [Pg] |
Model Period Mean (complement) [Pg] |
Benchmark Period Mean (intersection) [Pg] |
Benchmark Period Mean (complement) [Pg] |
Bias [kg m-2] |
Bias Score [1] |
Spatial Distribution Score [1] |
Overall Score [1] |
|||
|---|---|---|---|---|---|---|---|---|---|---|---|---|
| Benchmark | [-] | 36.8 | ||||||||||
| CRUNCEPv7 | [-] | 49.4 | 46.8 | 2.28 | 35.7 | 1.10 | 8.69 | 0.616 | 0.935 | 0.776 | ||
| GSWP3v1 | [-] | 39.9 | 37.9 | 1.80 | 35.7 | 1.10 | 5.14 | 0.715 | 0.918 | 0.817 | ||
| WATCH | [-] | 38.9 | 36.8 | 1.87 | 35.7 | 1.10 | 4.82 | 0.738 | 0.869 | 0.803 |
Download Data |
Period Mean (original grids) [Pg] |
Model Period Mean (intersection) [Pg] |
Model Period Mean (complement) [Pg] |
Benchmark Period Mean (intersection) [Pg] |
Benchmark Period Mean (complement) [Pg] |
Bias [kg m-2] |
Bias Score [1] |
Spatial Distribution Score [1] |
Overall Score [1] |
|||
|---|---|---|---|---|---|---|---|---|---|---|---|---|
| Benchmark | [-] | 38.4 | ||||||||||
| CRUNCEPv7 | [-] | 36.1 | 23.9 | 13.0 | 38.3 | 0.0891 | -1.35 | 0.543 | 0.685 | 0.614 | ||
| GSWP3v1 | [-] | 31.6 | 23.2 | 9.15 | 38.3 | 0.0891 | -1.53 | 0.586 | 0.801 | 0.694 | ||
| WATCH | [-] | 33.2 | 21.8 | 11.9 | 38.3 | 0.0891 | -1.75 | 0.598 | 0.862 | 0.730 |
Download Data |
Period Mean (original grids) [Pg] |
Model Period Mean (intersection) [Pg] |
Model Period Mean (complement) [Pg] |
Benchmark Period Mean (intersection) [Pg] |
Benchmark Period Mean (complement) [Pg] |
Bias [kg m-2] |
Bias Score [1] |
Spatial Distribution Score [1] |
Overall Score [1] |
|||
|---|---|---|---|---|---|---|---|---|---|---|---|---|
| Benchmark | [-] | 43.7 | ||||||||||
| CRUNCEPv7 | [-] | 25.4 | 24.0 | 0.749 | 43.4 | 0.257 | -1.74 | 0.587 | 0.855 | 0.721 | ||
| GSWP3v1 | [-] | 24.8 | 23.2 | 0.670 | 43.4 | 0.257 | -1.98 | 0.606 | 0.890 | 0.748 | ||
| WATCH | [-] | 25.6 | 24.3 | 0.656 | 43.4 | 0.257 | -1.84 | 0.616 | 0.899 | 0.758 |
Download Data |
Period Mean (original grids) [Pg] |
Model Period Mean (intersection) [Pg] |
Model Period Mean (complement) [Pg] |
Benchmark Period Mean (intersection) [Pg] |
Benchmark Period Mean (complement) [Pg] |
Bias [kg m-2] |
Bias Score [1] |
Spatial Distribution Score [1] |
Overall Score [1] |
|||
|---|---|---|---|---|---|---|---|---|---|---|---|---|
| Benchmark | [-] | 13.7 | ||||||||||
| CRUNCEPv7 | [-] | 11.5 | 4.26 | 7.02 | 13.5 | 0.139 | -1.29 | 0.463 | 0.617 | 0.540 | ||
| GSWP3v1 | [-] | 11.0 | 3.66 | 7.16 | 13.5 | 0.139 | -1.38 | 0.445 | 0.638 | 0.541 | ||
| WATCH | [-] | 11.8 | 4.29 | 7.29 | 13.5 | 0.139 | -1.26 | 0.454 | 0.590 | 0.522 |
Download Data |
Period Mean (original grids) [Pg] |
Model Period Mean (intersection) [Pg] |
Model Period Mean (complement) [Pg] |
Benchmark Period Mean (intersection) [Pg] |
Benchmark Period Mean (complement) [Pg] |
Bias [kg m-2] |
Bias Score [1] |
Spatial Distribution Score [1] |
Overall Score [1] |
|||
|---|---|---|---|---|---|---|---|---|---|---|---|---|
| Benchmark | [-] | 352. | ||||||||||
| CRUNCEPv7 | [-] | 589. | 355. | 233. | 348. | 3.81 | 0.826 | 0.590 | 0.766 | 0.678 | ||
| GSWP3v1 | [-] | 486. | 309. | 178. | 348. | 3.81 | 0.0653 | 0.638 | 0.854 | 0.746 | ||
| WATCH | [-] | 505. | 339. | 166. | 348. | 3.81 | 0.488 | 0.629 | 0.841 | 0.735 |
Download Data |
Period Mean (original grids) [Pg] |
Model Period Mean (intersection) [Pg] |
Model Period Mean (complement) [Pg] |
Benchmark Period Mean (intersection) [Pg] |
Benchmark Period Mean (complement) [Pg] |
Bias [kg m-2] |
Bias Score [1] |
Spatial Distribution Score [1] |
Overall Score [1] |
|||
|---|---|---|---|---|---|---|---|---|---|---|---|---|
| Benchmark | [-] | 2.53 | ||||||||||
| CRUNCEPv7 | [-] | 1.68 | 0.229 | 1.44 | 2.53 | 0.00250 | -1.04 | 0.396 | 0.0230 | 0.210 | ||
| GSWP3v1 | [-] | 1.55 | 0.211 | 1.35 | 2.53 | 0.00250 | -1.04 | 0.395 | 0.0211 | 0.208 | ||
| WATCH | [-] | 2.26 | 0.303 | 1.93 | 2.53 | 0.00250 | -1.00 | 0.402 | 0.0428 | 0.222 |
Download Data |
Period Mean (original grids) [Pg] |
Model Period Mean (intersection) [Pg] |
Model Period Mean (complement) [Pg] |
Benchmark Period Mean (intersection) [Pg] |
Benchmark Period Mean (complement) [Pg] |
Bias [kg m-2] |
Bias Score [1] |
Spatial Distribution Score [1] |
Overall Score [1] |
|||
|---|---|---|---|---|---|---|---|---|---|---|---|---|
| Benchmark | [-] | 11.1 | ||||||||||
| CRUNCEPv7 | [-] | 11.9 | 11.0 | 0.602 | 10.9 | 0.149 | 1.49 | 0.573 | 0.684 | 0.628 | ||
| GSWP3v1 | [-] | 10.2 | 9.38 | 0.547 | 10.9 | 0.149 | 0.813 | 0.607 | 0.775 | 0.691 | ||
| WATCH | [-] | 10.8 | 10.1 | 0.526 | 10.9 | 0.149 | 1.07 | 0.611 | 0.795 | 0.703 |
Download Data |
Period Mean (original grids) [Pg] |
Model Period Mean (intersection) [Pg] |
Model Period Mean (complement) [Pg] |
Benchmark Period Mean (intersection) [Pg] |
Benchmark Period Mean (complement) [Pg] |
Bias [kg m-2] |
Bias Score [1] |
Spatial Distribution Score [1] |
Overall Score [1] |
|||
|---|---|---|---|---|---|---|---|---|---|---|---|---|
| Benchmark | [-] | 1.55 | ||||||||||
| CRUNCEPv7 | [-] | 17.7 | 3.58 | 14.0 | 1.52 | 0.0247 | 3.61 | 0.472 | 0.490 | 0.481 | ||
| GSWP3v1 | [-] | 11.9 | 1.32 | 10.5 | 1.52 | 0.0247 | 0.434 | 0.550 | 0.683 | 0.617 | ||
| WATCH | [-] | 13.8 | 2.67 | 11.1 | 1.52 | 0.0247 | 2.23 | 0.562 | 0.638 | 0.600 |
Download Data |
Period Mean (original grids) [Pg] |
Model Period Mean (intersection) [Pg] |
Model Period Mean (complement) [Pg] |
Benchmark Period Mean (intersection) [Pg] |
Benchmark Period Mean (complement) [Pg] |
Bias [kg m-2] |
Bias Score [1] |
Spatial Distribution Score [1] |
Overall Score [1] |
|||
|---|---|---|---|---|---|---|---|---|---|---|---|---|
| Benchmark | [-] | 0.219 | ||||||||||
| CRUNCEPv7 | [-] | 3.48 | 0.0759 | 3.42 | 0.219 | -0.459 | 0.463 | 0.0991 | 0.281 | |||
| GSWP3v1 | [-] | 3.04 | 0.0844 | 2.99 | 0.219 | -0.433 | 0.468 | 0.0819 | 0.275 | |||
| WATCH | [-] | 3.34 | 0.0966 | 3.27 | 0.219 | -0.404 | 0.472 | 0.142 | 0.307 |
Download Data |
Period Mean (original grids) [Pg] |
Model Period Mean (intersection) [Pg] |
Model Period Mean (complement) [Pg] |
Benchmark Period Mean (intersection) [Pg] |
Benchmark Period Mean (complement) [Pg] |
Bias [kg m-2] |
Bias Score [1] |
Spatial Distribution Score [1] |
Overall Score [1] |
|||
|---|---|---|---|---|---|---|---|---|---|---|---|---|
| Benchmark | [-] | 100. | ||||||||||
| CRUNCEPv7 | [-] | 152. | 151. | 0.453 | 100. | 0.0690 | 6.40 | 0.602 | 0.843 | 0.722 | ||
| GSWP3v1 | [-] | 128. | 128. | 0.396 | 100. | 0.0690 | 3.63 | 0.709 | 0.919 | 0.814 | ||
| WATCH | [-] | 144. | 143. | 0.384 | 100. | 0.0690 | 5.46 | 0.630 | 0.864 | 0.747 |
Download Data |
Period Mean (original grids) [Pg] |
Model Period Mean (intersection) [Pg] |
Model Period Mean (complement) [Pg] |
Benchmark Period Mean (intersection) [Pg] |
Benchmark Period Mean (complement) [Pg] |
Bias [kg m-2] |
Bias Score [1] |
Spatial Distribution Score [1] |
Overall Score [1] |
|||
|---|---|---|---|---|---|---|---|---|---|---|---|---|
| Benchmark | [-] | 18.4 | ||||||||||
| CRUNCEPv7 | [-] | 21.7 | 21.7 | 0.382 | 18.4 | 0.0281 | 0.759 | 0.617 | 0.725 | 0.671 | ||
| GSWP3v1 | [-] | 21.8 | 21.8 | 0.347 | 18.4 | 0.0281 | 0.735 | 0.546 | 0.579 | 0.563 | ||
| WATCH | [-] | 23.9 | 23.9 | 0.319 | 18.4 | 0.0281 | 1.04 | 0.571 | 0.670 | 0.621 |
Download Data |
Period Mean (original grids) [Pg] |
Model Period Mean (intersection) [Pg] |
Model Period Mean (complement) [Pg] |
Benchmark Period Mean (intersection) [Pg] |
Benchmark Period Mean (complement) [Pg] |
Bias [kg m-2] |
Bias Score [1] |
Spatial Distribution Score [1] |
Overall Score [1] |
|||
|---|---|---|---|---|---|---|---|---|---|---|---|---|
| Benchmark | [-] | 7.28 | ||||||||||
| CRUNCEPv7 | [-] | 5.25 | 5.14 | 0.150 | 7.15 | 0.128 | 0.169 | 0.530 | 0.533 | 0.532 | ||
| GSWP3v1 | [-] | 6.25 | 6.14 | 0.145 | 7.15 | 0.128 | 0.387 | 0.524 | 0.568 | 0.546 | ||
| WATCH | [-] | 5.85 | 5.77 | 0.133 | 7.15 | 0.128 | 0.183 | 0.555 | 0.675 | 0.615 |
Temporally integrated period mean