Mean State
Download Data |
Period Mean (original grids) [Pg yr-1] |
Model Period Mean (intersection) [Pg yr-1] |
Model Period Mean (complement) [Pg yr-1] |
Benchmark Period Mean (intersection) [Pg yr-1] |
Benchmark Period Mean (complement) [Pg yr-1] |
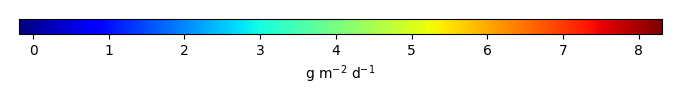
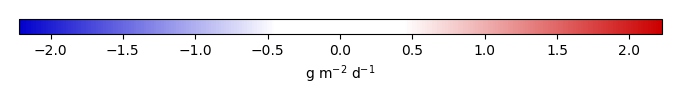
Bias [g m-2 d-1] |
RMSE [g m-2 d-1] |
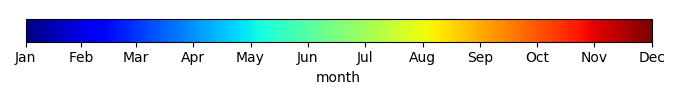
Phase Shift [months] |
Bias Score [1] |
RMSE Score [1] |
Seasonal Cycle Score [1] |
Spatial Distribution Score [1] |
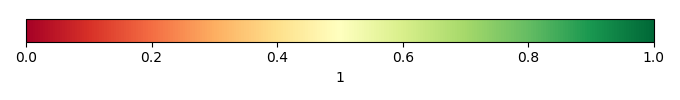
Overall Score [1] |
|||
|---|---|---|---|---|---|---|---|---|---|---|---|---|---|---|---|---|
| Benchmark | [-] | 6.03 | ||||||||||||||
| CRUNCEPv7 | [-] | 6.90 | 6.97 | 0.203 | 6.02 | 0.00530 | 0.742 | 1.62 | 1.88 | 0.240 | 0.234 | 0.652 | 0.901 | 0.452 | ||
| GSWP3v1 | [-] | 6.67 | 6.68 | 0.214 | 6.02 | 0.00530 | 0.551 | 1.30 | 2.09 | 0.371 | 0.257 | 0.610 | 0.949 | 0.489 | ||
| WATCH | [-] | 6.56 | 6.67 | 0.178 | 6.00 | 0.00528 | 0.543 | 1.25 | 2.09 | 0.303 | 0.294 | 0.653 | 0.983 | 0.505 |
Download Data |
Period Mean (original grids) [Pg yr-1] |
Model Period Mean (intersection) [Pg yr-1] |
Model Period Mean (complement) [Pg yr-1] |
Benchmark Period Mean (intersection) [Pg yr-1] |
Benchmark Period Mean (complement) [Pg yr-1] |
Bias [g m-2 d-1] |
RMSE [g m-2 d-1] |
Phase Shift [months] |
Bias Score [1] |
RMSE Score [1] |
Seasonal Cycle Score [1] |
Spatial Distribution Score [1] |
Overall Score [1] |
|||
|---|---|---|---|---|---|---|---|---|---|---|---|---|---|---|---|---|
| Benchmark | [-] | 4.84 | ||||||||||||||
| CRUNCEPv7 | [-] | 4.89 | 4.64 | 0.0194 | 4.83 | 0.00451 | -0.0606 | 1.37 | 1.07 | 0.561 | 0.356 | 0.847 | 0.954 | 0.615 | ||
| GSWP3v1 | [-] | 5.02 | 4.77 | 0.0253 | 4.83 | 0.00451 | -0.00221 | 1.35 | 1.17 | 0.553 | 0.375 | 0.800 | 0.950 | 0.611 | ||
| WATCH | [-] | 5.22 | 4.92 | 0.0277 | 4.79 | 0.00451 | 0.0737 | 1.50 | 1.90 | 0.520 | 0.332 | 0.621 | 0.948 | 0.551 |
Download Data |
Period Mean (original grids) [Pg yr-1] |
Model Period Mean (intersection) [Pg yr-1] |
Model Period Mean (complement) [Pg yr-1] |
Benchmark Period Mean (intersection) [Pg yr-1] |
Benchmark Period Mean (complement) [Pg yr-1] |
Bias [g m-2 d-1] |
RMSE [g m-2 d-1] |
Phase Shift [months] |
Bias Score [1] |
RMSE Score [1] |
Seasonal Cycle Score [1] |
Spatial Distribution Score [1] |
Overall Score [1] |
|||
|---|---|---|---|---|---|---|---|---|---|---|---|---|---|---|---|---|
| Benchmark | [-] | 7.67 | ||||||||||||||
| CRUNCEPv7 | [-] | 8.24 | 7.78 | 0.374 | 7.65 | 0.0194 | 0.187 | 1.59 | 1.06 | 0.388 | 0.301 | 0.872 | 0.731 | 0.519 | ||
| GSWP3v1 | [-] | 6.46 | 6.06 | 0.338 | 7.65 | 0.0194 | -0.337 | 1.56 | 1.32 | 0.356 | 0.336 | 0.823 | 0.856 | 0.541 | ||
| WATCH | [-] | 7.45 | 7.01 | 0.361 | 7.65 | 0.0195 | -0.0499 | 1.50 | 1.53 | 0.349 | 0.359 | 0.789 | 0.798 | 0.531 |
Download Data |
Period Mean (original grids) [Pg yr-1] |
Model Period Mean (intersection) [Pg yr-1] |
Model Period Mean (complement) [Pg yr-1] |
Benchmark Period Mean (intersection) [Pg yr-1] |
Benchmark Period Mean (complement) [Pg yr-1] |
Bias [g m-2 d-1] |
RMSE [g m-2 d-1] |
Phase Shift [months] |
Bias Score [1] |
RMSE Score [1] |
Seasonal Cycle Score [1] |
Spatial Distribution Score [1] |
Overall Score [1] |
|||
|---|---|---|---|---|---|---|---|---|---|---|---|---|---|---|---|---|
| Benchmark | [-] | 0.268 | ||||||||||||||
| CRUNCEPv7 | [-] | 1.59 | 1.54 | 0.0528 | 0.266 | 0.00214 | 1.19 | 2.20 | 0.562 | 0.554 | 0.425 | 0.952 | 0.386 | 0.549 | ||
| GSWP3v1 | [-] | 1.54 | 1.50 | 0.0503 | 0.266 | 0.00214 | 1.14 | 1.91 | 0.446 | 0.569 | 0.470 | 0.962 | 0.479 | 0.590 | ||
| WATCH | [-] | 1.64 | 1.59 | 0.0539 | 0.247 | 0.00210 | 1.26 | 1.92 | 0.255 | 0.675 | 0.528 | 0.974 | 0.478 | 0.637 |
Download Data |
Period Mean (original grids) [Pg yr-1] |
Model Period Mean (intersection) [Pg yr-1] |
Model Period Mean (complement) [Pg yr-1] |
Benchmark Period Mean (intersection) [Pg yr-1] |
Benchmark Period Mean (complement) [Pg yr-1] |
Bias [g m-2 d-1] |
RMSE [g m-2 d-1] |
Phase Shift [months] |
Bias Score [1] |
RMSE Score [1] |
Seasonal Cycle Score [1] |
Spatial Distribution Score [1] |
Overall Score [1] |
|||
|---|---|---|---|---|---|---|---|---|---|---|---|---|---|---|---|---|
| Benchmark | [-] | 5.87 | ||||||||||||||
| CRUNCEPv7 | [-] | 6.75 | 5.66 | 1.05 | 5.72 | 0.154 | 1.78 | 2.16 | 2.35 | 0.239 | 0.242 | 0.626 | 0.389 | 0.347 | ||
| GSWP3v1 | [-] | 5.91 | 4.93 | 0.936 | 5.72 | 0.154 | 0.871 | 1.97 | 2.33 | 0.162 | 0.266 | 0.633 | 0.373 | 0.340 | ||
| WATCH | [-] | 5.59 | 4.64 | 0.910 | 5.70 | 0.154 | 0.564 | 1.97 | 2.69 | 0.151 | 0.252 | 0.563 | 0.492 | 0.342 |
Download Data |
Period Mean (original grids) [Pg yr-1] |
Model Period Mean (intersection) [Pg yr-1] |
Model Period Mean (complement) [Pg yr-1] |
Benchmark Period Mean (intersection) [Pg yr-1] |
Benchmark Period Mean (complement) [Pg yr-1] |
Bias [g m-2 d-1] |
RMSE [g m-2 d-1] |
Phase Shift [months] |
Bias Score [1] |
RMSE Score [1] |
Seasonal Cycle Score [1] |
Spatial Distribution Score [1] |
Overall Score [1] |
|||
|---|---|---|---|---|---|---|---|---|---|---|---|---|---|---|---|---|
| Benchmark | [-] | 4.81 | ||||||||||||||
| CRUNCEPv7 | [-] | 8.80 | 8.50 | 0.0917 | 4.80 | 0.00239 | 1.17 | 1.83 | 0.465 | 0.581 | 0.539 | 0.967 | 0.835 | 0.692 | ||
| GSWP3v1 | [-] | 6.98 | 6.73 | 0.0799 | 4.80 | 0.00239 | 0.619 | 1.37 | 0.361 | 0.688 | 0.629 | 0.975 | 0.828 | 0.750 | ||
| WATCH | [-] | 6.67 | 6.42 | 0.0681 | 4.77 | 0.00237 | 0.529 | 1.14 | 0.0507 | 0.753 | 0.673 | 0.997 | 0.822 | 0.784 |
Download Data |
Period Mean (original grids) [Pg yr-1] |
Model Period Mean (intersection) [Pg yr-1] |
Model Period Mean (complement) [Pg yr-1] |
Benchmark Period Mean (intersection) [Pg yr-1] |
Benchmark Period Mean (complement) [Pg yr-1] |
Bias [g m-2 d-1] |
RMSE [g m-2 d-1] |
Phase Shift [months] |
Bias Score [1] |
RMSE Score [1] |
Seasonal Cycle Score [1] |
Spatial Distribution Score [1] |
Overall Score [1] |
|||
|---|---|---|---|---|---|---|---|---|---|---|---|---|---|---|---|---|
| Benchmark | [-] | 8.54 | ||||||||||||||
| CRUNCEPv7 | [-] | 10.1 | 9.90 | 0.352 | 8.50 | 0.0389 | 0.311 | 0.922 | 0.892 | 0.658 | 0.523 | 0.918 | 0.932 | 0.711 | ||
| GSWP3v1 | [-] | 9.61 | 9.44 | 0.303 | 8.50 | 0.0389 | 0.225 | 0.876 | 0.880 | 0.658 | 0.558 | 0.914 | 0.955 | 0.729 | ||
| WATCH | [-] | 9.91 | 9.76 | 0.280 | 8.43 | 0.0382 | 0.279 | 1.01 | 0.946 | 0.609 | 0.542 | 0.910 | 0.937 | 0.708 |
Download Data |
Period Mean (original grids) [Pg yr-1] |
Model Period Mean (intersection) [Pg yr-1] |
Model Period Mean (complement) [Pg yr-1] |
Benchmark Period Mean (intersection) [Pg yr-1] |
Benchmark Period Mean (complement) [Pg yr-1] |
Bias [g m-2 d-1] |
RMSE [g m-2 d-1] |
Phase Shift [months] |
Bias Score [1] |
RMSE Score [1] |
Seasonal Cycle Score [1] |
Spatial Distribution Score [1] |
Overall Score [1] |
|||
|---|---|---|---|---|---|---|---|---|---|---|---|---|---|---|---|---|
| Benchmark | [-] | 6.81 | ||||||||||||||
| CRUNCEPv7 | [-] | 6.85 | 6.24 | 0.492 | 6.77 | 0.0385 | 0.230 | 1.41 | 1.68 | 0.391 | 0.347 | 0.739 | 0.881 | 0.541 | ||
| GSWP3v1 | [-] | 6.61 | 6.00 | 0.460 | 6.77 | 0.0385 | 0.0965 | 1.35 | 2.16 | 0.401 | 0.365 | 0.635 | 0.915 | 0.536 | ||
| WATCH | [-] | 6.52 | 5.96 | 0.445 | 6.75 | 0.0385 | 0.0816 | 1.30 | 2.61 | 0.445 | 0.358 | 0.529 | 0.947 | 0.528 |
Download Data |
Period Mean (original grids) [Pg yr-1] |
Model Period Mean (intersection) [Pg yr-1] |
Model Period Mean (complement) [Pg yr-1] |
Benchmark Period Mean (intersection) [Pg yr-1] |
Benchmark Period Mean (complement) [Pg yr-1] |
Bias [g m-2 d-1] |
RMSE [g m-2 d-1] |
Phase Shift [months] |
Bias Score [1] |
RMSE Score [1] |
Seasonal Cycle Score [1] |
Spatial Distribution Score [1] |
Overall Score [1] |
|||
|---|---|---|---|---|---|---|---|---|---|---|---|---|---|---|---|---|
| Benchmark | [-] | 0.433 | ||||||||||||||
| CRUNCEPv7 | [-] | 2.27 | 2.30 | 0.0386 | 0.432 | 0.000674 | 1.53 | 2.52 | 0.413 | 0.508 | 0.385 | 0.985 | 0.493 | 0.551 | ||
| GSWP3v1 | [-] | 1.95 | 1.97 | 0.0325 | 0.432 | 0.000674 | 1.27 | 1.92 | 0.258 | 0.574 | 0.503 | 0.987 | 0.641 | 0.642 | ||
| WATCH | [-] | 1.36 | 1.38 | 0.0256 | 0.417 | 0.000648 | 0.797 | 1.49 | 0.277 | 0.819 | 0.579 | 0.987 | 0.591 | 0.711 |
Download Data |
Period Mean (original grids) [Pg yr-1] |
Model Period Mean (intersection) [Pg yr-1] |
Model Period Mean (complement) [Pg yr-1] |
Benchmark Period Mean (intersection) [Pg yr-1] |
Benchmark Period Mean (complement) [Pg yr-1] |
Bias [g m-2 d-1] |
RMSE [g m-2 d-1] |
Phase Shift [months] |
Bias Score [1] |
RMSE Score [1] |
Seasonal Cycle Score [1] |
Spatial Distribution Score [1] |
Overall Score [1] |
|||
|---|---|---|---|---|---|---|---|---|---|---|---|---|---|---|---|---|
| Benchmark | [-] | 3.22 | ||||||||||||||
| CRUNCEPv7 | [-] | 4.86 | 4.32 | 0.498 | 3.19 | 0.0315 | 0.634 | 1.18 | 1.34 | 0.355 | 0.201 | 0.848 | 0.587 | 0.438 | ||
| GSWP3v1 | [-] | 4.76 | 4.21 | 0.516 | 3.19 | 0.0315 | 0.605 | 1.11 | 1.50 | 0.359 | 0.227 | 0.834 | 0.614 | 0.452 | ||
| WATCH | [-] | 4.94 | 4.40 | 0.503 | 3.23 | 0.0318 | 0.651 | 1.13 | 1.57 | 0.358 | 0.223 | 0.814 | 0.630 | 0.449 |
Download Data |
Period Mean (original grids) [Pg yr-1] |
Model Period Mean (intersection) [Pg yr-1] |
Model Period Mean (complement) [Pg yr-1] |
Benchmark Period Mean (intersection) [Pg yr-1] |
Benchmark Period Mean (complement) [Pg yr-1] |
Bias [g m-2 d-1] |
RMSE [g m-2 d-1] |
Phase Shift [months] |
Bias Score [1] |
RMSE Score [1] |
Seasonal Cycle Score [1] |
Spatial Distribution Score [1] |
Overall Score [1] |
|||
|---|---|---|---|---|---|---|---|---|---|---|---|---|---|---|---|---|
| Benchmark | [-] | 4.41 | ||||||||||||||
| CRUNCEPv7 | [-] | 5.63 | 5.29 | 0.257 | 4.39 | 0.0266 | 0.877 | 1.65 | 0.443 | 0.607 | 0.455 | 0.967 | 0.949 | 0.687 | ||
| GSWP3v1 | [-] | 4.67 | 4.39 | 0.211 | 4.39 | 0.0266 | 0.354 | 1.28 | 0.400 | 0.621 | 0.534 | 0.971 | 0.926 | 0.717 | ||
| WATCH | [-] | 3.71 | 3.47 | 0.185 | 4.35 | 0.0264 | -0.141 | 1.14 | 0.415 | 0.584 | 0.573 | 0.970 | 0.855 | 0.711 |
Download Data |
Period Mean (original grids) [Pg yr-1] |
Model Period Mean (intersection) [Pg yr-1] |
Model Period Mean (complement) [Pg yr-1] |
Benchmark Period Mean (intersection) [Pg yr-1] |
Benchmark Period Mean (complement) [Pg yr-1] |
Bias [g m-2 d-1] |
RMSE [g m-2 d-1] |
Phase Shift [months] |
Bias Score [1] |
RMSE Score [1] |
Seasonal Cycle Score [1] |
Spatial Distribution Score [1] |
Overall Score [1] |
|||
|---|---|---|---|---|---|---|---|---|---|---|---|---|---|---|---|---|
| Benchmark | [-] | 94.3 | ||||||||||||||
| CRUNCEPv7 | [-] | 120. | 115. | 5.57 | 93.6 | 0.649 | 0.665 | 1.47 | 1.10 | 0.414 | 0.335 | 0.828 | 0.918 | 0.566 | ||
| GSWP3v1 | [-] | 109. | 104. | 5.19 | 93.6 | 0.649 | 0.408 | 1.30 | 1.14 | 0.398 | 0.370 | 0.807 | 0.941 | 0.577 | ||
| WATCH | [-] | 108. | 103. | 4.98 | 93.3 | 0.648 | 0.402 | 1.23 | 1.27 | 0.428 | 0.389 | 0.754 | 0.948 | 0.582 |
Download Data |
Period Mean (original grids) [Pg yr-1] |
Model Period Mean (intersection) [Pg yr-1] |
Model Period Mean (complement) [Pg yr-1] |
Benchmark Period Mean (intersection) [Pg yr-1] |
Benchmark Period Mean (complement) [Pg yr-1] |
Bias [g m-2 d-1] |
RMSE [g m-2 d-1] |
Phase Shift [months] |
Bias Score [1] |
RMSE Score [1] |
Seasonal Cycle Score [1] |
Spatial Distribution Score [1] |
Overall Score [1] |
|||
|---|---|---|---|---|---|---|---|---|---|---|---|---|---|---|---|---|
| Benchmark | [-] | 0.942 | ||||||||||||||
| CRUNCEPv7 | [-] | 1.54 | 1.48 | 0.0715 | 0.937 | 0.00548 | 0.230 | 0.495 | 1.79 | 0.370 | 0.169 | 0.896 | 0.863 | 0.494 | ||
| GSWP3v1 | [-] | 1.43 | 1.39 | 0.0703 | 0.937 | 0.00548 | 0.204 | 0.451 | 1.78 | 0.380 | 0.207 | 0.901 | 0.874 | 0.514 | ||
| WATCH | [-] | 1.67 | 1.61 | 0.0746 | 0.930 | 0.00543 | 0.280 | 0.524 | 1.84 | 0.338 | 0.194 | 0.888 | 0.830 | 0.489 |
Download Data |
Period Mean (original grids) [Pg yr-1] |
Model Period Mean (intersection) [Pg yr-1] |
Model Period Mean (complement) [Pg yr-1] |
Benchmark Period Mean (intersection) [Pg yr-1] |
Benchmark Period Mean (complement) [Pg yr-1] |
Bias [g m-2 d-1] |
RMSE [g m-2 d-1] |
Phase Shift [months] |
Bias Score [1] |
RMSE Score [1] |
Seasonal Cycle Score [1] |
Spatial Distribution Score [1] |
Overall Score [1] |
|||
|---|---|---|---|---|---|---|---|---|---|---|---|---|---|---|---|---|
| Benchmark | [-] | 1.28 | ||||||||||||||
| CRUNCEPv7 | [-] | 3.03 | 2.92 | 0.0889 | 1.28 | 0.00304 | 0.774 | 1.68 | 0.713 | 0.392 | 0.239 | 0.944 | 0.427 | 0.448 | ||
| GSWP3v1 | [-] | 2.88 | 2.77 | 0.0828 | 1.28 | 0.00304 | 0.702 | 1.43 | 0.555 | 0.413 | 0.303 | 0.960 | 0.466 | 0.489 | ||
| WATCH | [-] | 2.45 | 2.36 | 0.0796 | 1.26 | 0.00300 | 0.538 | 1.25 | 0.515 | 0.506 | 0.345 | 0.972 | 0.561 | 0.546 |
Download Data |
Period Mean (original grids) [Pg yr-1] |
Model Period Mean (intersection) [Pg yr-1] |
Model Period Mean (complement) [Pg yr-1] |
Benchmark Period Mean (intersection) [Pg yr-1] |
Benchmark Period Mean (complement) [Pg yr-1] |
Bias [g m-2 d-1] |
RMSE [g m-2 d-1] |
Phase Shift [months] |
Bias Score [1] |
RMSE Score [1] |
Seasonal Cycle Score [1] |
Spatial Distribution Score [1] |
Overall Score [1] |
|||
|---|---|---|---|---|---|---|---|---|---|---|---|---|---|---|---|---|
| Benchmark | [-] | 2.84 | ||||||||||||||
| CRUNCEPv7 | [-] | 3.24 | 2.75 | 0.420 | 2.81 | 0.0214 | 0.764 | 1.74 | 1.46 | 0.265 | 0.264 | 0.759 | 0.822 | 0.475 | ||
| GSWP3v1 | [-] | 3.10 | 2.61 | 0.413 | 2.81 | 0.0214 | 0.587 | 1.56 | 1.56 | 0.322 | 0.289 | 0.745 | 0.879 | 0.505 | ||
| WATCH | [-] | 2.98 | 2.52 | 0.390 | 2.80 | 0.0214 | 0.493 | 1.47 | 1.70 | 0.317 | 0.310 | 0.692 | 0.912 | 0.508 |
Download Data |
Period Mean (original grids) [Pg yr-1] |
Model Period Mean (intersection) [Pg yr-1] |
Model Period Mean (complement) [Pg yr-1] |
Benchmark Period Mean (intersection) [Pg yr-1] |
Benchmark Period Mean (complement) [Pg yr-1] |
Bias [g m-2 d-1] |
RMSE [g m-2 d-1] |
Phase Shift [months] |
Bias Score [1] |
RMSE Score [1] |
Seasonal Cycle Score [1] |
Spatial Distribution Score [1] |
Overall Score [1] |
|||
|---|---|---|---|---|---|---|---|---|---|---|---|---|---|---|---|---|
| Benchmark | [-] | 3.76 | ||||||||||||||
| CRUNCEPv7 | [-] | 4.96 | 4.72 | 0.153 | 3.75 | 0.00457 | 0.846 | 1.40 | 0.761 | 0.587 | 0.528 | 0.942 | 0.921 | 0.701 | ||
| GSWP3v1 | [-] | 4.34 | 4.11 | 0.137 | 3.75 | 0.00457 | 0.405 | 1.21 | 0.654 | 0.632 | 0.588 | 0.947 | 0.969 | 0.745 | ||
| WATCH | [-] | 4.36 | 4.16 | 0.118 | 3.75 | 0.00457 | 0.418 | 1.00 | 0.598 | 0.718 | 0.619 | 0.952 | 0.984 | 0.778 |
Download Data |
Period Mean (original grids) [Pg yr-1] |
Model Period Mean (intersection) [Pg yr-1] |
Model Period Mean (complement) [Pg yr-1] |
Benchmark Period Mean (intersection) [Pg yr-1] |
Benchmark Period Mean (complement) [Pg yr-1] |
Bias [g m-2 d-1] |
RMSE [g m-2 d-1] |
Phase Shift [months] |
Bias Score [1] |
RMSE Score [1] |
Seasonal Cycle Score [1] |
Spatial Distribution Score [1] |
Overall Score [1] |
|||
|---|---|---|---|---|---|---|---|---|---|---|---|---|---|---|---|---|
| Benchmark | [-] | 2.78 | ||||||||||||||
| CRUNCEPv7 | [-] | 5.64 | 5.59 | 0.0869 | 2.76 | 0.0181 | 1.61 | 2.26 | 0.582 | 0.342 | 0.360 | 0.950 | 0.695 | 0.541 | ||
| GSWP3v1 | [-] | 4.83 | 4.78 | 0.0718 | 2.76 | 0.0181 | 1.16 | 1.66 | 0.337 | 0.466 | 0.474 | 0.975 | 0.766 | 0.631 | ||
| WATCH | [-] | 4.43 | 4.38 | 0.0672 | 2.76 | 0.0181 | 0.949 | 1.44 | 0.165 | 0.517 | 0.502 | 0.989 | 0.915 | 0.685 |
Download Data |
Period Mean (original grids) [Pg yr-1] |
Model Period Mean (intersection) [Pg yr-1] |
Model Period Mean (complement) [Pg yr-1] |
Benchmark Period Mean (intersection) [Pg yr-1] |
Benchmark Period Mean (complement) [Pg yr-1] |
Bias [g m-2 d-1] |
RMSE [g m-2 d-1] |
Phase Shift [months] |
Bias Score [1] |
RMSE Score [1] |
Seasonal Cycle Score [1] |
Spatial Distribution Score [1] |
Overall Score [1] |
|||
|---|---|---|---|---|---|---|---|---|---|---|---|---|---|---|---|---|
| Benchmark | [-] | 1.53 | ||||||||||||||
| CRUNCEPv7 | [-] | 1.45 | 1.51 | 0.0167 | 1.52 | 0.00362 | 0.0408 | 0.831 | 0.749 | 0.465 | 0.407 | 0.937 | 0.804 | 0.604 | ||
| GSWP3v1 | [-] | 1.51 | 1.59 | 0.0124 | 1.52 | 0.00362 | 0.0974 | 0.841 | 0.770 | 0.469 | 0.402 | 0.932 | 0.853 | 0.611 | ||
| WATCH | [-] | 1.62 | 1.69 | 0.0147 | 1.52 | 0.00364 | 0.162 | 0.866 | 0.792 | 0.455 | 0.411 | 0.933 | 0.850 | 0.612 |
Download Data |
Period Mean (original grids) [Pg yr-1] |
Model Period Mean (intersection) [Pg yr-1] |
Model Period Mean (complement) [Pg yr-1] |
Benchmark Period Mean (intersection) [Pg yr-1] |
Benchmark Period Mean (complement) [Pg yr-1] |
Bias [g m-2 d-1] |
RMSE [g m-2 d-1] |
Phase Shift [months] |
Bias Score [1] |
RMSE Score [1] |
Seasonal Cycle Score [1] |
Spatial Distribution Score [1] |
Overall Score [1] |
|||
|---|---|---|---|---|---|---|---|---|---|---|---|---|---|---|---|---|
| Benchmark | [-] | 18.7 | ||||||||||||||
| CRUNCEPv7 | [-] | 21.2 | 20.9 | 0.170 | 18.7 | 0.0172 | 0.930 | 1.57 | 1.66 | 0.377 | 0.266 | 0.760 | 0.967 | 0.527 | ||
| GSWP3v1 | [-] | 18.7 | 18.4 | 0.164 | 18.7 | 0.0172 | 0.0893 | 1.52 | 1.83 | 0.195 | 0.268 | 0.738 | 0.968 | 0.487 | ||
| WATCH | [-] | 19.3 | 19.0 | 0.156 | 18.7 | 0.0173 | 0.292 | 1.22 | 2.46 | 0.332 | 0.311 | 0.609 | 0.957 | 0.504 |
Download Data |
Period Mean (original grids) [Pg yr-1] |
Model Period Mean (intersection) [Pg yr-1] |
Model Period Mean (complement) [Pg yr-1] |
Benchmark Period Mean (intersection) [Pg yr-1] |
Benchmark Period Mean (complement) [Pg yr-1] |
Bias [g m-2 d-1] |
RMSE [g m-2 d-1] |
Phase Shift [months] |
Bias Score [1] |
RMSE Score [1] |
Seasonal Cycle Score [1] |
Spatial Distribution Score [1] |
Overall Score [1] |
|||
|---|---|---|---|---|---|---|---|---|---|---|---|---|---|---|---|---|
| Benchmark | [-] | 8.12 | ||||||||||||||
| CRUNCEPv7 | [-] | 10.4 | 10.2 | 0.336 | 8.11 | 0.00281 | 1.01 | 2.16 | 1.10 | 0.284 | 0.274 | 0.883 | 0.567 | 0.456 | ||
| GSWP3v1 | [-] | 9.80 | 9.62 | 0.313 | 8.11 | 0.00281 | 0.762 | 1.82 | 1.19 | 0.344 | 0.331 | 0.875 | 0.671 | 0.510 | ||
| WATCH | [-] | 10.1 | 9.95 | 0.287 | 8.13 | 0.00282 | 0.881 | 1.67 | 1.47 | 0.371 | 0.377 | 0.816 | 0.761 | 0.540 |
Download Data |
Period Mean (original grids) [Pg yr-1] |
Model Period Mean (intersection) [Pg yr-1] |
Model Period Mean (complement) [Pg yr-1] |
Benchmark Period Mean (intersection) [Pg yr-1] |
Benchmark Period Mean (complement) [Pg yr-1] |
Bias [g m-2 d-1] |
RMSE [g m-2 d-1] |
Phase Shift [months] |
Bias Score [1] |
RMSE Score [1] |
Seasonal Cycle Score [1] |
Spatial Distribution Score [1] |
Overall Score [1] |
|||
|---|---|---|---|---|---|---|---|---|---|---|---|---|---|---|---|---|
| Benchmark | [-] | 1.01 | ||||||||||||||
| CRUNCEPv7 | [-] | 1.27 | 1.16 | 0.0647 | 0.996 | 0.0112 | 0.390 | 0.952 | 1.32 | 0.280 | 0.224 | 0.876 | 0.766 | 0.474 | ||
| GSWP3v1 | [-] | 1.52 | 1.40 | 0.0698 | 0.996 | 0.0112 | 0.586 | 0.994 | 1.40 | 0.245 | 0.280 | 0.877 | 0.793 | 0.495 | ||
| WATCH | [-] | 1.38 | 1.28 | 0.0591 | 0.998 | 0.0112 | 0.450 | 0.980 | 1.43 | 0.267 | 0.266 | 0.877 | 0.832 | 0.502 |
Temporally integrated period mean