Mean State
Download Data |
Period Mean (original grids) [Pg yr-1] |
Model Period Mean (intersection) [Pg yr-1] |
Model Period Mean (complement) [Pg yr-1] |
Benchmark Period Mean (intersection) [Pg yr-1] |
Benchmark Period Mean (complement) [Pg yr-1] |
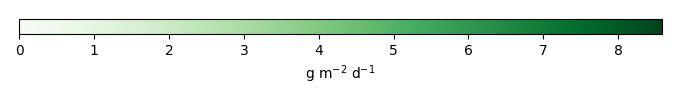
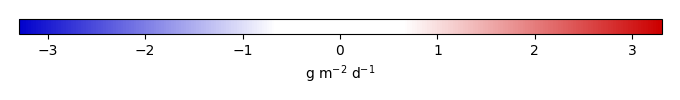
Bias [g m-2 d-1] |
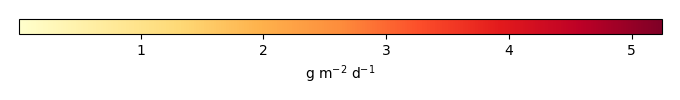
RMSE [g m-2 d-1] |
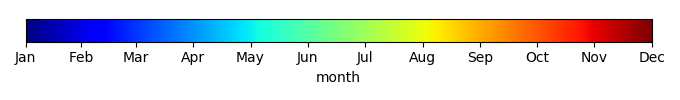
Phase Shift [months] |
Bias Score [1] |
RMSE Score [1] |
Seasonal Cycle Score [1] |
Spatial Distribution Score [1] |
Overall Score [1] |
|||
|---|---|---|---|---|---|---|---|---|---|---|---|---|---|---|---|---|
| Benchmark | [-] | 8.19 | ||||||||||||||
| CRUNCEPv7 | [-] | 7.22 | 7.30 | 0.207 | 8.18 | 0.00755 | -0.403 | 1.71 | 2.07 | 0.316 | 0.270 | 0.588 | 0.981 | 0.485 | ||
| GSWP3v1 | [-] | 6.96 | 6.98 | 0.219 | 8.18 | 0.00755 | -0.618 | 1.70 | 2.16 | 0.291 | 0.276 | 0.590 | 0.966 | 0.480 | ||
| WATCH | [-] | 6.85 | 6.96 | 0.182 | 8.16 | 0.00756 | -0.631 | 1.81 | 2.72 | 0.277 | 0.241 | 0.468 | 0.914 | 0.428 |
Download Data |
Period Mean (original grids) [Pg yr-1] |
Model Period Mean (intersection) [Pg yr-1] |
Model Period Mean (complement) [Pg yr-1] |
Benchmark Period Mean (intersection) [Pg yr-1] |
Benchmark Period Mean (complement) [Pg yr-1] |
Bias [g m-2 d-1] |
RMSE [g m-2 d-1] |
Phase Shift [months] |
Bias Score [1] |
RMSE Score [1] |
Seasonal Cycle Score [1] |
Spatial Distribution Score [1] |
Overall Score [1] |
|||
|---|---|---|---|---|---|---|---|---|---|---|---|---|---|---|---|---|
| Benchmark | [-] | 5.55 | ||||||||||||||
| CRUNCEPv7 | [-] | 5.26 | 4.98 | 0.0202 | 5.55 | 0.00508 | -0.213 | 1.75 | 1.18 | 0.585 | 0.405 | 0.815 | 0.889 | 0.620 | ||
| GSWP3v1 | [-] | 5.36 | 5.09 | 0.0260 | 5.55 | 0.00508 | -0.166 | 1.76 | 1.52 | 0.575 | 0.417 | 0.742 | 0.834 | 0.597 | ||
| WATCH | [-] | 5.51 | 5.20 | 0.0283 | 5.49 | 0.00506 | -0.0980 | 1.99 | 2.26 | 0.560 | 0.346 | 0.501 | 0.886 | 0.528 |
Download Data |
Period Mean (original grids) [Pg yr-1] |
Model Period Mean (intersection) [Pg yr-1] |
Model Period Mean (complement) [Pg yr-1] |
Benchmark Period Mean (intersection) [Pg yr-1] |
Benchmark Period Mean (complement) [Pg yr-1] |
Bias [g m-2 d-1] |
RMSE [g m-2 d-1] |
Phase Shift [months] |
Bias Score [1] |
RMSE Score [1] |
Seasonal Cycle Score [1] |
Spatial Distribution Score [1] |
Overall Score [1] |
|||
|---|---|---|---|---|---|---|---|---|---|---|---|---|---|---|---|---|
| Benchmark | [-] | 9.94 | ||||||||||||||
| CRUNCEPv7 | [-] | 8.89 | 8.42 | 0.383 | 9.92 | 0.0215 | -0.301 | 1.99 | 1.07 | 0.460 | 0.355 | 0.884 | 0.901 | 0.591 | ||
| GSWP3v1 | [-] | 7.00 | 6.60 | 0.346 | 9.92 | 0.0215 | -0.858 | 2.08 | 1.35 | 0.391 | 0.375 | 0.822 | 0.914 | 0.575 | ||
| WATCH | [-] | 7.88 | 7.44 | 0.369 | 9.95 | 0.0217 | -0.614 | 1.98 | 1.72 | 0.419 | 0.373 | 0.751 | 0.925 | 0.568 |
Download Data |
Period Mean (original grids) [Pg yr-1] |
Model Period Mean (intersection) [Pg yr-1] |
Model Period Mean (complement) [Pg yr-1] |
Benchmark Period Mean (intersection) [Pg yr-1] |
Benchmark Period Mean (complement) [Pg yr-1] |
Bias [g m-2 d-1] |
RMSE [g m-2 d-1] |
Phase Shift [months] |
Bias Score [1] |
RMSE Score [1] |
Seasonal Cycle Score [1] |
Spatial Distribution Score [1] |
Overall Score [1] |
|||
|---|---|---|---|---|---|---|---|---|---|---|---|---|---|---|---|---|
| Benchmark | [-] | 1.03 | ||||||||||||||
| CRUNCEPv7 | [-] | 1.63 | 1.58 | 0.0533 | 1.03 | 0.00296 | 0.571 | 2.18 | 0.311 | 0.529 | 0.306 | 0.969 | 0.512 | 0.524 | ||
| GSWP3v1 | [-] | 1.61 | 1.56 | 0.0509 | 1.03 | 0.00296 | 0.549 | 1.85 | 0.240 | 0.592 | 0.393 | 0.981 | 0.623 | 0.596 | ||
| WATCH | [-] | 1.66 | 1.62 | 0.0545 | 1.02 | 0.00295 | 0.623 | 1.88 | 0.174 | 0.564 | 0.362 | 0.985 | 0.658 | 0.586 |
Download Data |
Period Mean (original grids) [Pg yr-1] |
Model Period Mean (intersection) [Pg yr-1] |
Model Period Mean (complement) [Pg yr-1] |
Benchmark Period Mean (intersection) [Pg yr-1] |
Benchmark Period Mean (complement) [Pg yr-1] |
Bias [g m-2 d-1] |
RMSE [g m-2 d-1] |
Phase Shift [months] |
Bias Score [1] |
RMSE Score [1] |
Seasonal Cycle Score [1] |
Spatial Distribution Score [1] |
Overall Score [1] |
|||
|---|---|---|---|---|---|---|---|---|---|---|---|---|---|---|---|---|
| Benchmark | [-] | 7.13 | ||||||||||||||
| CRUNCEPv7 | [-] | 7.05 | 5.92 | 1.09 | 6.94 | 0.197 | 0.910 | 2.10 | 1.59 | 0.191 | 0.193 | 0.804 | 0.299 | 0.336 | ||
| GSWP3v1 | [-] | 6.19 | 5.16 | 0.976 | 6.94 | 0.197 | -0.0181 | 2.32 | 1.99 | 0.0902 | 0.187 | 0.712 | 0.283 | 0.292 | ||
| WATCH | [-] | 5.81 | 4.82 | 0.940 | 6.93 | 0.197 | -0.409 | 2.45 | 2.21 | 0.0584 | 0.187 | 0.679 | 0.424 | 0.307 |
Download Data |
Period Mean (original grids) [Pg yr-1] |
Model Period Mean (intersection) [Pg yr-1] |
Model Period Mean (complement) [Pg yr-1] |
Benchmark Period Mean (intersection) [Pg yr-1] |
Benchmark Period Mean (complement) [Pg yr-1] |
Bias [g m-2 d-1] |
RMSE [g m-2 d-1] |
Phase Shift [months] |
Bias Score [1] |
RMSE Score [1] |
Seasonal Cycle Score [1] |
Spatial Distribution Score [1] |
Overall Score [1] |
|||
|---|---|---|---|---|---|---|---|---|---|---|---|---|---|---|---|---|
| Benchmark | [-] | 6.86 | ||||||||||||||
| CRUNCEPv7 | [-] | 9.43 | 9.11 | 0.0917 | 6.85 | 0.00296 | 0.730 | 1.79 | 0.472 | 0.734 | 0.576 | 0.967 | 0.863 | 0.743 | ||
| GSWP3v1 | [-] | 7.45 | 7.19 | 0.0801 | 6.85 | 0.00296 | 0.132 | 1.38 | 0.512 | 0.792 | 0.649 | 0.964 | 0.822 | 0.775 | ||
| WATCH | [-] | 7.04 | 6.78 | 0.0687 | 6.87 | 0.00295 | -0.00494 | 1.21 | 0.364 | 0.813 | 0.681 | 0.974 | 0.856 | 0.801 |
Download Data |
Period Mean (original grids) [Pg yr-1] |
Model Period Mean (intersection) [Pg yr-1] |
Model Period Mean (complement) [Pg yr-1] |
Benchmark Period Mean (intersection) [Pg yr-1] |
Benchmark Period Mean (complement) [Pg yr-1] |
Bias [g m-2 d-1] |
RMSE [g m-2 d-1] |
Phase Shift [months] |
Bias Score [1] |
RMSE Score [1] |
Seasonal Cycle Score [1] |
Spatial Distribution Score [1] |
Overall Score [1] |
|||
|---|---|---|---|---|---|---|---|---|---|---|---|---|---|---|---|---|
| Benchmark | [-] | 10.1 | ||||||||||||||
| CRUNCEPv7 | [-] | 11.1 | 10.9 | 0.370 | 10.0 | 0.0375 | 0.232 | 1.29 | 1.07 | 0.763 | 0.521 | 0.928 | 0.970 | 0.740 | ||
| GSWP3v1 | [-] | 10.5 | 10.3 | 0.320 | 10.0 | 0.0375 | 0.128 | 1.24 | 1.04 | 0.706 | 0.547 | 0.926 | 0.950 | 0.735 | ||
| WATCH | [-] | 10.7 | 10.5 | 0.296 | 9.99 | 0.0366 | 0.163 | 1.42 | 1.18 | 0.654 | 0.528 | 0.901 | 0.881 | 0.698 |
Download Data |
Period Mean (original grids) [Pg yr-1] |
Model Period Mean (intersection) [Pg yr-1] |
Model Period Mean (complement) [Pg yr-1] |
Benchmark Period Mean (intersection) [Pg yr-1] |
Benchmark Period Mean (complement) [Pg yr-1] |
Bias [g m-2 d-1] |
RMSE [g m-2 d-1] |
Phase Shift [months] |
Bias Score [1] |
RMSE Score [1] |
Seasonal Cycle Score [1] |
Spatial Distribution Score [1] |
Overall Score [1] |
|||
|---|---|---|---|---|---|---|---|---|---|---|---|---|---|---|---|---|
| Benchmark | [-] | 8.37 | ||||||||||||||
| CRUNCEPv7 | [-] | 7.42 | 6.79 | 0.513 | 8.32 | 0.0454 | -0.162 | 2.05 | 2.27 | 0.474 | 0.346 | 0.676 | 0.951 | 0.559 | ||
| GSWP3v1 | [-] | 7.16 | 6.53 | 0.481 | 8.32 | 0.0454 | -0.302 | 2.05 | 2.75 | 0.468 | 0.353 | 0.581 | 0.951 | 0.541 | ||
| WATCH | [-] | 7.00 | 6.42 | 0.464 | 8.26 | 0.0454 | -0.334 | 2.17 | 3.12 | 0.433 | 0.313 | 0.479 | 0.929 | 0.493 |
Download Data |
Period Mean (original grids) [Pg yr-1] |
Model Period Mean (intersection) [Pg yr-1] |
Model Period Mean (complement) [Pg yr-1] |
Benchmark Period Mean (intersection) [Pg yr-1] |
Benchmark Period Mean (complement) [Pg yr-1] |
Bias [g m-2 d-1] |
RMSE [g m-2 d-1] |
Phase Shift [months] |
Bias Score [1] |
RMSE Score [1] |
Seasonal Cycle Score [1] |
Spatial Distribution Score [1] |
Overall Score [1] |
|||
|---|---|---|---|---|---|---|---|---|---|---|---|---|---|---|---|---|
| Benchmark | [-] | 1.28 | ||||||||||||||
| CRUNCEPv7 | [-] | 2.30 | 2.33 | 0.0389 | 1.28 | 0.00137 | 0.886 | 2.61 | 0.189 | 0.554 | 0.283 | 0.991 | 0.679 | 0.558 | ||
| GSWP3v1 | [-] | 1.99 | 2.02 | 0.0328 | 1.28 | 0.00137 | 0.631 | 1.93 | 0.168 | 0.663 | 0.399 | 0.993 | 0.840 | 0.659 | ||
| WATCH | [-] | 1.38 | 1.39 | 0.0260 | 1.28 | 0.00137 | 0.123 | 1.49 | 0.190 | 0.691 | 0.460 | 0.992 | 0.823 | 0.685 |
Download Data |
Period Mean (original grids) [Pg yr-1] |
Model Period Mean (intersection) [Pg yr-1] |
Model Period Mean (complement) [Pg yr-1] |
Benchmark Period Mean (intersection) [Pg yr-1] |
Benchmark Period Mean (complement) [Pg yr-1] |
Bias [g m-2 d-1] |
RMSE [g m-2 d-1] |
Phase Shift [months] |
Bias Score [1] |
RMSE Score [1] |
Seasonal Cycle Score [1] |
Spatial Distribution Score [1] |
Overall Score [1] |
|||
|---|---|---|---|---|---|---|---|---|---|---|---|---|---|---|---|---|
| Benchmark | [-] | 3.53 | ||||||||||||||
| CRUNCEPv7 | [-] | 5.05 | 4.50 | 0.517 | 3.49 | 0.0402 | 0.601 | 1.37 | 1.71 | 0.427 | 0.229 | 0.845 | 0.793 | 0.505 | ||
| GSWP3v1 | [-] | 4.92 | 4.36 | 0.531 | 3.49 | 0.0402 | 0.562 | 1.29 | 2.04 | 0.452 | 0.258 | 0.809 | 0.817 | 0.519 | ||
| WATCH | [-] | 5.12 | 4.57 | 0.519 | 3.55 | 0.0405 | 0.606 | 1.32 | 2.15 | 0.426 | 0.258 | 0.769 | 0.833 | 0.509 |
Download Data |
Period Mean (original grids) [Pg yr-1] |
Model Period Mean (intersection) [Pg yr-1] |
Model Period Mean (complement) [Pg yr-1] |
Benchmark Period Mean (intersection) [Pg yr-1] |
Benchmark Period Mean (complement) [Pg yr-1] |
Bias [g m-2 d-1] |
RMSE [g m-2 d-1] |
Phase Shift [months] |
Bias Score [1] |
RMSE Score [1] |
Seasonal Cycle Score [1] |
Spatial Distribution Score [1] |
Overall Score [1] |
|||
|---|---|---|---|---|---|---|---|---|---|---|---|---|---|---|---|---|
| Benchmark | [-] | 5.29 | ||||||||||||||
| CRUNCEPv7 | [-] | 6.19 | 5.83 | 0.272 | 5.26 | 0.0312 | 0.738 | 2.21 | 0.322 | 0.729 | 0.499 | 0.980 | 0.903 | 0.722 | ||
| GSWP3v1 | [-] | 5.13 | 4.83 | 0.225 | 5.26 | 0.0312 | 0.164 | 1.80 | 0.315 | 0.712 | 0.576 | 0.981 | 0.799 | 0.729 | ||
| WATCH | [-] | 4.12 | 3.87 | 0.199 | 5.23 | 0.0311 | -0.363 | 1.69 | 0.405 | 0.672 | 0.607 | 0.973 | 0.716 | 0.715 |
Download Data |
Period Mean (original grids) [Pg yr-1] |
Model Period Mean (intersection) [Pg yr-1] |
Model Period Mean (complement) [Pg yr-1] |
Benchmark Period Mean (intersection) [Pg yr-1] |
Benchmark Period Mean (complement) [Pg yr-1] |
Bias [g m-2 d-1] |
RMSE [g m-2 d-1] |
Phase Shift [months] |
Bias Score [1] |
RMSE Score [1] |
Seasonal Cycle Score [1] |
Spatial Distribution Score [1] |
Overall Score [1] |
|||
|---|---|---|---|---|---|---|---|---|---|---|---|---|---|---|---|---|
| Benchmark | [-] | 119. | ||||||||||||||
| CRUNCEPv7 | [-] | 128. | 122. | 5.76 | 118. | 0.802 | 0.298 | 1.74 | 1.22 | 0.457 | 0.366 | 0.815 | 0.953 | 0.591 | ||
| GSWP3v1 | [-] | 115. | 110. | 5.38 | 118. | 0.802 | 0.0236 | 1.62 | 1.33 | 0.434 | 0.384 | 0.786 | 0.933 | 0.584 | ||
| WATCH | [-] | 114. | 109. | 5.15 | 118. | 0.801 | -0.00747 | 1.59 | 1.48 | 0.432 | 0.397 | 0.733 | 0.928 | 0.577 |
Download Data |
Period Mean (original grids) [Pg yr-1] |
Model Period Mean (intersection) [Pg yr-1] |
Model Period Mean (complement) [Pg yr-1] |
Benchmark Period Mean (intersection) [Pg yr-1] |
Benchmark Period Mean (complement) [Pg yr-1] |
Bias [g m-2 d-1] |
RMSE [g m-2 d-1] |
Phase Shift [months] |
Bias Score [1] |
RMSE Score [1] |
Seasonal Cycle Score [1] |
Spatial Distribution Score [1] |
Overall Score [1] |
|||
|---|---|---|---|---|---|---|---|---|---|---|---|---|---|---|---|---|
| Benchmark | [-] | 0.864 | ||||||||||||||
| CRUNCEPv7 | [-] | 1.65 | 1.59 | 0.0769 | 0.859 | 0.00579 | 0.294 | 0.742 | 2.32 | 0.431 | 0.204 | 0.860 | 0.843 | 0.508 | ||
| GSWP3v1 | [-] | 1.54 | 1.49 | 0.0758 | 0.859 | 0.00579 | 0.268 | 0.681 | 2.31 | 0.453 | 0.244 | 0.866 | 0.853 | 0.532 | ||
| WATCH | [-] | 1.79 | 1.73 | 0.0798 | 0.850 | 0.00571 | 0.346 | 0.784 | 2.24 | 0.414 | 0.230 | 0.867 | 0.817 | 0.511 |
Download Data |
Period Mean (original grids) [Pg yr-1] |
Model Period Mean (intersection) [Pg yr-1] |
Model Period Mean (complement) [Pg yr-1] |
Benchmark Period Mean (intersection) [Pg yr-1] |
Benchmark Period Mean (complement) [Pg yr-1] |
Bias [g m-2 d-1] |
RMSE [g m-2 d-1] |
Phase Shift [months] |
Bias Score [1] |
RMSE Score [1] |
Seasonal Cycle Score [1] |
Spatial Distribution Score [1] |
Overall Score [1] |
|||
|---|---|---|---|---|---|---|---|---|---|---|---|---|---|---|---|---|
| Benchmark | [-] | 1.56 | ||||||||||||||
| CRUNCEPv7 | [-] | 3.09 | 2.97 | 0.0897 | 1.55 | 0.00323 | 0.684 | 1.79 | 0.557 | 0.446 | 0.261 | 0.971 | 0.513 | 0.491 | ||
| GSWP3v1 | [-] | 2.94 | 2.84 | 0.0836 | 1.55 | 0.00323 | 0.616 | 1.53 | 0.589 | 0.484 | 0.313 | 0.973 | 0.553 | 0.527 | ||
| WATCH | [-] | 2.48 | 2.38 | 0.0802 | 1.55 | 0.00321 | 0.429 | 1.32 | 0.645 | 0.576 | 0.367 | 0.972 | 0.666 | 0.590 |
Download Data |
Period Mean (original grids) [Pg yr-1] |
Model Period Mean (intersection) [Pg yr-1] |
Model Period Mean (complement) [Pg yr-1] |
Benchmark Period Mean (intersection) [Pg yr-1] |
Benchmark Period Mean (complement) [Pg yr-1] |
Bias [g m-2 d-1] |
RMSE [g m-2 d-1] |
Phase Shift [months] |
Bias Score [1] |
RMSE Score [1] |
Seasonal Cycle Score [1] |
Spatial Distribution Score [1] |
Overall Score [1] |
|||
|---|---|---|---|---|---|---|---|---|---|---|---|---|---|---|---|---|
| Benchmark | [-] | 3.62 | ||||||||||||||
| CRUNCEPv7 | [-] | 3.45 | 2.94 | 0.436 | 3.60 | 0.0267 | 0.219 | 1.97 | 1.46 | 0.401 | 0.323 | 0.789 | 0.926 | 0.552 | ||
| GSWP3v1 | [-] | 3.29 | 2.78 | 0.428 | 3.60 | 0.0267 | 0.0289 | 1.89 | 1.52 | 0.370 | 0.344 | 0.772 | 0.944 | 0.555 | ||
| WATCH | [-] | 3.16 | 2.69 | 0.403 | 3.58 | 0.0267 | -0.0765 | 1.90 | 1.72 | 0.356 | 0.338 | 0.726 | 0.944 | 0.541 |
Download Data |
Period Mean (original grids) [Pg yr-1] |
Model Period Mean (intersection) [Pg yr-1] |
Model Period Mean (complement) [Pg yr-1] |
Benchmark Period Mean (intersection) [Pg yr-1] |
Benchmark Period Mean (complement) [Pg yr-1] |
Bias [g m-2 d-1] |
RMSE [g m-2 d-1] |
Phase Shift [months] |
Bias Score [1] |
RMSE Score [1] |
Seasonal Cycle Score [1] |
Spatial Distribution Score [1] |
Overall Score [1] |
|||
|---|---|---|---|---|---|---|---|---|---|---|---|---|---|---|---|---|
| Benchmark | [-] | 5.09 | ||||||||||||||
| CRUNCEPv7 | [-] | 5.46 | 5.20 | 0.159 | 5.09 | 0.00487 | 0.264 | 1.84 | 0.759 | 0.811 | 0.582 | 0.939 | 0.981 | 0.779 | ||
| GSWP3v1 | [-] | 4.79 | 4.55 | 0.143 | 5.09 | 0.00487 | -0.209 | 1.80 | 0.672 | 0.733 | 0.617 | 0.942 | 0.930 | 0.768 | ||
| WATCH | [-] | 4.80 | 4.59 | 0.124 | 5.11 | 0.00490 | -0.218 | 1.53 | 0.580 | 0.759 | 0.653 | 0.949 | 0.903 | 0.783 |
Download Data |
Period Mean (original grids) [Pg yr-1] |
Model Period Mean (intersection) [Pg yr-1] |
Model Period Mean (complement) [Pg yr-1] |
Benchmark Period Mean (intersection) [Pg yr-1] |
Benchmark Period Mean (complement) [Pg yr-1] |
Bias [g m-2 d-1] |
RMSE [g m-2 d-1] |
Phase Shift [months] |
Bias Score [1] |
RMSE Score [1] |
Seasonal Cycle Score [1] |
Spatial Distribution Score [1] |
Overall Score [1] |
|||
|---|---|---|---|---|---|---|---|---|---|---|---|---|---|---|---|---|
| Benchmark | [-] | 3.36 | ||||||||||||||
| CRUNCEPv7 | [-] | 5.98 | 5.92 | 0.0889 | 3.34 | 0.0222 | 1.49 | 2.44 | 0.636 | 0.497 | 0.431 | 0.958 | 0.891 | 0.642 | ||
| GSWP3v1 | [-] | 5.10 | 5.05 | 0.0739 | 3.34 | 0.0222 | 1.01 | 1.85 | 0.553 | 0.604 | 0.523 | 0.964 | 0.914 | 0.705 | ||
| WATCH | [-] | 4.67 | 4.62 | 0.0692 | 3.34 | 0.0221 | 0.769 | 1.65 | 0.395 | 0.640 | 0.549 | 0.974 | 0.960 | 0.735 |
Download Data |
Period Mean (original grids) [Pg yr-1] |
Model Period Mean (intersection) [Pg yr-1] |
Model Period Mean (complement) [Pg yr-1] |
Benchmark Period Mean (intersection) [Pg yr-1] |
Benchmark Period Mean (complement) [Pg yr-1] |
Bias [g m-2 d-1] |
RMSE [g m-2 d-1] |
Phase Shift [months] |
Bias Score [1] |
RMSE Score [1] |
Seasonal Cycle Score [1] |
Spatial Distribution Score [1] |
Overall Score [1] |
|||
|---|---|---|---|---|---|---|---|---|---|---|---|---|---|---|---|---|
| Benchmark | [-] | 1.79 | ||||||||||||||
| CRUNCEPv7 | [-] | 1.58 | 1.65 | 0.0176 | 1.79 | 0.00506 | -0.0385 | 1.17 | 0.879 | 0.566 | 0.416 | 0.930 | 0.923 | 0.650 | ||
| GSWP3v1 | [-] | 1.65 | 1.74 | 0.0131 | 1.79 | 0.00506 | 0.0233 | 1.21 | 0.943 | 0.544 | 0.415 | 0.921 | 0.920 | 0.643 | ||
| WATCH | [-] | 1.76 | 1.84 | 0.0154 | 1.79 | 0.00508 | 0.0841 | 1.22 | 0.910 | 0.537 | 0.428 | 0.929 | 0.915 | 0.647 |
Download Data |
Period Mean (original grids) [Pg yr-1] |
Model Period Mean (intersection) [Pg yr-1] |
Model Period Mean (complement) [Pg yr-1] |
Benchmark Period Mean (intersection) [Pg yr-1] |
Benchmark Period Mean (complement) [Pg yr-1] |
Bias [g m-2 d-1] |
RMSE [g m-2 d-1] |
Phase Shift [months] |
Bias Score [1] |
RMSE Score [1] |
Seasonal Cycle Score [1] |
Spatial Distribution Score [1] |
Overall Score [1] |
|||
|---|---|---|---|---|---|---|---|---|---|---|---|---|---|---|---|---|
| Benchmark | [-] | 23.2 | ||||||||||||||
| CRUNCEPv7 | [-] | 22.0 | 21.7 | 0.174 | 23.2 | 0.0226 | -0.268 | 1.83 | 2.24 | 0.176 | 0.265 | 0.653 | 0.902 | 0.452 | ||
| GSWP3v1 | [-] | 19.4 | 19.1 | 0.167 | 23.2 | 0.0226 | -1.14 | 2.18 | 2.45 | 0.110 | 0.228 | 0.620 | 0.911 | 0.420 | ||
| WATCH | [-] | 19.8 | 19.6 | 0.159 | 23.1 | 0.0227 | -0.986 | 1.88 | 2.63 | 0.127 | 0.300 | 0.577 | 0.896 | 0.440 |
Download Data |
Period Mean (original grids) [Pg yr-1] |
Model Period Mean (intersection) [Pg yr-1] |
Model Period Mean (complement) [Pg yr-1] |
Benchmark Period Mean (intersection) [Pg yr-1] |
Benchmark Period Mean (complement) [Pg yr-1] |
Bias [g m-2 d-1] |
RMSE [g m-2 d-1] |
Phase Shift [months] |
Bias Score [1] |
RMSE Score [1] |
Seasonal Cycle Score [1] |
Spatial Distribution Score [1] |
Overall Score [1] |
|||
|---|---|---|---|---|---|---|---|---|---|---|---|---|---|---|---|---|
| Benchmark | [-] | 10.4 | ||||||||||||||
| CRUNCEPv7 | [-] | 10.8 | 10.7 | 0.343 | 10.4 | 0.00314 | 0.227 | 2.30 | 1.00 | 0.489 | 0.411 | 0.906 | 0.787 | 0.601 | ||
| GSWP3v1 | [-] | 10.2 | 10.0 | 0.321 | 10.4 | 0.00314 | -0.0344 | 1.98 | 1.01 | 0.545 | 0.451 | 0.906 | 0.872 | 0.645 | ||
| WATCH | [-] | 10.5 | 10.3 | 0.294 | 10.5 | 0.00314 | 0.0515 | 1.84 | 1.33 | 0.564 | 0.482 | 0.839 | 0.934 | 0.660 |
Download Data |
Period Mean (original grids) [Pg yr-1] |
Model Period Mean (intersection) [Pg yr-1] |
Model Period Mean (complement) [Pg yr-1] |
Benchmark Period Mean (intersection) [Pg yr-1] |
Benchmark Period Mean (complement) [Pg yr-1] |
Bias [g m-2 d-1] |
RMSE [g m-2 d-1] |
Phase Shift [months] |
Bias Score [1] |
RMSE Score [1] |
Seasonal Cycle Score [1] |
Spatial Distribution Score [1] |
Overall Score [1] |
|||
|---|---|---|---|---|---|---|---|---|---|---|---|---|---|---|---|---|
| Benchmark | [-] | 1.16 | ||||||||||||||
| CRUNCEPv7 | [-] | 1.36 | 1.25 | 0.0673 | 1.14 | 0.0148 | 0.343 | 1.19 | 1.36 | 0.400 | 0.310 | 0.911 | 0.899 | 0.566 | ||
| GSWP3v1 | [-] | 1.60 | 1.48 | 0.0727 | 1.14 | 0.0148 | 0.524 | 1.24 | 1.44 | 0.406 | 0.373 | 0.888 | 0.905 | 0.589 | ||
| WATCH | [-] | 1.44 | 1.33 | 0.0619 | 1.14 | 0.0148 | 0.369 | 1.23 | 1.40 | 0.405 | 0.354 | 0.902 | 0.892 | 0.581 |
Temporally integrated period mean