Mean State
Download Data |
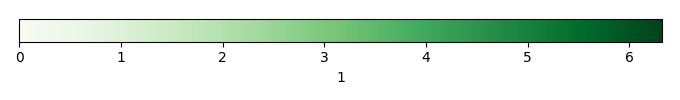
Period Mean (original grids) [1] |
Model Period Mean (intersection) [1] |
Model Period Mean (complement) [1] |
Benchmark Period Mean (intersection) [1] |
Benchmark Period Mean (complement) [1] |
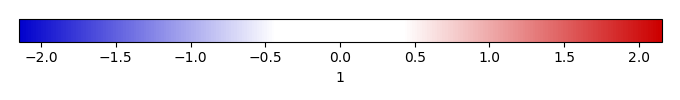
Bias [1] |
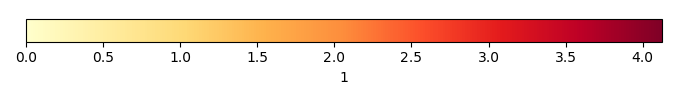
RMSE [1] |
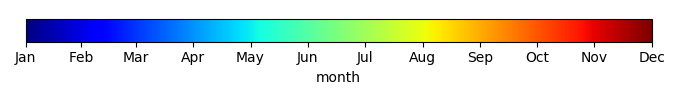
Phase Shift [months] |
Bias Score [1] |
RMSE Score [1] |
Seasonal Cycle Score [1] |
Spatial Distribution Score [1] |
Overall Score [1] |
|||
|---|---|---|---|---|---|---|---|---|---|---|---|---|---|---|---|---|
| Benchmark | [-] | 2.83 | ||||||||||||||
| CRUNCEPv7 | [-] | 3.01 | 2.98 | 2.86 | 2.83 | 1.57 | 0.137 | 1.03 | 2.89 | 0.172 | 0.218 | 0.509 | 0.946 | 0.412 | ||
| GSWP3v1 | [-] | 2.78 | 2.74 | 2.73 | 2.83 | 1.57 | -0.105 | 0.880 | 2.94 | 0.223 | 0.239 | 0.510 | 0.975 | 0.437 | ||
| WATCH | [-] | 2.80 | 2.79 | 2.50 | 2.83 | 1.57 | -0.0622 | 0.743 | 3.13 | 0.282 | 0.333 | 0.427 | 0.982 | 0.471 |
Download Data |
Period Mean (original grids) [1] |
Model Period Mean (intersection) [1] |
Model Period Mean (complement) [1] |
Benchmark Period Mean (intersection) [1] |
Benchmark Period Mean (complement) [1] |
Bias [1] |
RMSE [1] |
Phase Shift [months] |
Bias Score [1] |
RMSE Score [1] |
Seasonal Cycle Score [1] |
Spatial Distribution Score [1] |
Overall Score [1] |
|||
|---|---|---|---|---|---|---|---|---|---|---|---|---|---|---|---|---|
| Benchmark | [-] | 1.03 | ||||||||||||||
| CRUNCEPv7 | [-] | 0.615 | 0.589 | 0.533 | 1.03 | 1.90 | -0.441 | 0.783 | 2.10 | 0.311 | 0.354 | 0.554 | 0.814 | 0.477 | ||
| GSWP3v1 | [-] | 0.602 | 0.578 | 0.733 | 1.03 | 1.90 | -0.451 | 0.810 | 2.23 | 0.289 | 0.358 | 0.526 | 0.781 | 0.462 | ||
| WATCH | [-] | 0.776 | 0.748 | 0.840 | 1.03 | 1.90 | -0.280 | 0.800 | 2.52 | 0.343 | 0.347 | 0.459 | 0.907 | 0.480 |
Download Data |
Period Mean (original grids) [1] |
Model Period Mean (intersection) [1] |
Model Period Mean (complement) [1] |
Benchmark Period Mean (intersection) [1] |
Benchmark Period Mean (complement) [1] |
Bias [1] |
RMSE [1] |
Phase Shift [months] |
Bias Score [1] |
RMSE Score [1] |
Seasonal Cycle Score [1] |
Spatial Distribution Score [1] |
Overall Score [1] |
|||
|---|---|---|---|---|---|---|---|---|---|---|---|---|---|---|---|---|
| Benchmark | [-] | 1.40 | ||||||||||||||
| CRUNCEPv7 | [-] | 1.37 | 1.34 | 1.73 | 1.40 | 1.48 | -0.0427 | 0.968 | 2.82 | 0.313 | 0.268 | 0.443 | 0.758 | 0.410 | ||
| GSWP3v1 | [-] | 0.950 | 0.922 | 1.50 | 1.40 | 1.48 | -0.445 | 0.984 | 2.93 | 0.235 | 0.305 | 0.435 | 0.870 | 0.430 | ||
| WATCH | [-] | 1.23 | 1.21 | 1.56 | 1.40 | 1.48 | -0.177 | 0.850 | 3.12 | 0.317 | 0.328 | 0.415 | 0.891 | 0.456 |
Download Data |
Period Mean (original grids) [1] |
Model Period Mean (intersection) [1] |
Model Period Mean (complement) [1] |
Benchmark Period Mean (intersection) [1] |
Benchmark Period Mean (complement) [1] |
Bias [1] |
RMSE [1] |
Phase Shift [months] |
Bias Score [1] |
RMSE Score [1] |
Seasonal Cycle Score [1] |
Spatial Distribution Score [1] |
Overall Score [1] |
|||
|---|---|---|---|---|---|---|---|---|---|---|---|---|---|---|---|---|
| Benchmark | [-] | 0.602 | ||||||||||||||
| CRUNCEPv7 | [-] | 1.15 | 1.16 | 1.12 | 0.602 | 0.637 | 0.540 | 1.46 | 1.54 | 0.379 | 0.256 | 0.797 | 0.276 | 0.393 | ||
| GSWP3v1 | [-] | 1.00 | 1.00 | 1.02 | 0.602 | 0.637 | 0.392 | 1.15 | 0.821 | 0.497 | 0.344 | 0.901 | 0.379 | 0.493 | ||
| WATCH | [-] | 1.26 | 1.27 | 1.18 | 0.602 | 0.637 | 0.655 | 1.48 | 1.02 | 0.384 | 0.258 | 0.894 | 0.356 | 0.430 |
Download Data |
Period Mean (original grids) [1] |
Model Period Mean (intersection) [1] |
Model Period Mean (complement) [1] |
Benchmark Period Mean (intersection) [1] |
Benchmark Period Mean (complement) [1] |
Bias [1] |
RMSE [1] |
Phase Shift [months] |
Bias Score [1] |
RMSE Score [1] |
Seasonal Cycle Score [1] |
Spatial Distribution Score [1] |
Overall Score [1] |
|||
|---|---|---|---|---|---|---|---|---|---|---|---|---|---|---|---|---|
| Benchmark | [-] | 4.00 | ||||||||||||||
| CRUNCEPv7 | [-] | 5.39 | 5.42 | 5.21 | 4.01 | 3.77 | 1.35 | 1.60 | 3.67 | 0.0726 | 0.238 | 0.366 | 0.876 | 0.358 | ||
| GSWP3v1 | [-] | 4.41 | 4.42 | 4.37 | 4.01 | 3.77 | 0.392 | 1.03 | 3.74 | 0.126 | 0.230 | 0.354 | 0.972 | 0.382 | ||
| WATCH | [-] | 4.04 | 4.02 | 4.13 | 4.01 | 3.77 | 0.0438 | 0.877 | 3.93 | 0.138 | 0.271 | 0.325 | 0.982 | 0.397 |
Download Data |
Period Mean (original grids) [1] |
Model Period Mean (intersection) [1] |
Model Period Mean (complement) [1] |
Benchmark Period Mean (intersection) [1] |
Benchmark Period Mean (complement) [1] |
Bias [1] |
RMSE [1] |
Phase Shift [months] |
Bias Score [1] |
RMSE Score [1] |
Seasonal Cycle Score [1] |
Spatial Distribution Score [1] |
Overall Score [1] |
|||
|---|---|---|---|---|---|---|---|---|---|---|---|---|---|---|---|---|
| Benchmark | [-] | 2.00 | ||||||||||||||
| CRUNCEPv7 | [-] | 2.75 | 2.76 | 3.15 | 2.00 | 1.54 | 0.768 | 1.63 | 1.10 | 0.252 | 0.307 | 0.825 | 0.596 | 0.457 | ||
| GSWP3v1 | [-] | 2.05 | 2.05 | 2.62 | 2.00 | 1.54 | 0.0517 | 1.20 | 1.09 | 0.348 | 0.370 | 0.835 | 0.715 | 0.528 | ||
| WATCH | [-] | 1.92 | 1.91 | 2.15 | 2.00 | 1.54 | -0.0881 | 0.981 | 1.15 | 0.472 | 0.387 | 0.816 | 0.962 | 0.605 |
Download Data |
Period Mean (original grids) [1] |
Model Period Mean (intersection) [1] |
Model Period Mean (complement) [1] |
Benchmark Period Mean (intersection) [1] |
Benchmark Period Mean (complement) [1] |
Bias [1] |
RMSE [1] |
Phase Shift [months] |
Bias Score [1] |
RMSE Score [1] |
Seasonal Cycle Score [1] |
Spatial Distribution Score [1] |
Overall Score [1] |
|||
|---|---|---|---|---|---|---|---|---|---|---|---|---|---|---|---|---|
| Benchmark | [-] | 0.758 | ||||||||||||||
| CRUNCEPv7 | [-] | 1.29 | 1.27 | 2.70 | 0.761 | 0.432 | 0.548 | 0.993 | 1.60 | 0.299 | 0.319 | 0.803 | 0.746 | 0.497 | ||
| GSWP3v1 | [-] | 1.19 | 1.18 | 2.18 | 0.761 | 0.432 | 0.447 | 0.874 | 1.65 | 0.398 | 0.366 | 0.815 | 0.804 | 0.550 | ||
| WATCH | [-] | 1.31 | 1.30 | 2.03 | 0.761 | 0.432 | 0.558 | 1.02 | 1.54 | 0.418 | 0.362 | 0.819 | 0.835 | 0.559 |
Download Data |
Period Mean (original grids) [1] |
Model Period Mean (intersection) [1] |
Model Period Mean (complement) [1] |
Benchmark Period Mean (intersection) [1] |
Benchmark Period Mean (complement) [1] |
Bias [1] |
RMSE [1] |
Phase Shift [months] |
Bias Score [1] |
RMSE Score [1] |
Seasonal Cycle Score [1] |
Spatial Distribution Score [1] |
Overall Score [1] |
|||
|---|---|---|---|---|---|---|---|---|---|---|---|---|---|---|---|---|
| Benchmark | [-] | 1.71 | ||||||||||||||
| CRUNCEPv7 | [-] | 1.75 | 1.67 | 3.02 | 1.71 | 2.93 | 0.0575 | 0.884 | 3.25 | 0.212 | 0.221 | 0.428 | 0.926 | 0.401 | ||
| GSWP3v1 | [-] | 1.72 | 1.63 | 2.73 | 1.71 | 2.93 | -0.00890 | 0.919 | 3.52 | 0.209 | 0.239 | 0.382 | 0.922 | 0.398 | ||
| WATCH | [-] | 1.65 | 1.58 | 2.67 | 1.71 | 2.93 | -0.0553 | 0.826 | 3.66 | 0.227 | 0.276 | 0.338 | 0.955 | 0.414 |
Download Data |
Period Mean (original grids) [1] |
Model Period Mean (intersection) [1] |
Model Period Mean (complement) [1] |
Benchmark Period Mean (intersection) [1] |
Benchmark Period Mean (complement) [1] |
Bias [1] |
RMSE [1] |
Phase Shift [months] |
Bias Score [1] |
RMSE Score [1] |
Seasonal Cycle Score [1] |
Spatial Distribution Score [1] |
Overall Score [1] |
|||
|---|---|---|---|---|---|---|---|---|---|---|---|---|---|---|---|---|
| Benchmark | [-] | 0.648 | ||||||||||||||
| CRUNCEPv7 | [-] | 1.61 | 1.68 | 0.935 | 0.649 | 0.394 | 1.02 | 1.92 | 1.27 | 0.293 | 0.184 | 0.839 | 0.449 | 0.390 | ||
| GSWP3v1 | [-] | 1.26 | 1.31 | 0.798 | 0.649 | 0.394 | 0.655 | 1.33 | 0.997 | 0.446 | 0.292 | 0.871 | 0.634 | 0.507 | ||
| WATCH | [-] | 0.966 | 1.00 | 0.576 | 0.649 | 0.394 | 0.340 | 1.02 | 1.18 | 0.572 | 0.372 | 0.853 | 0.698 | 0.573 |
Download Data |
Period Mean (original grids) [1] |
Model Period Mean (intersection) [1] |
Model Period Mean (complement) [1] |
Benchmark Period Mean (intersection) [1] |
Benchmark Period Mean (complement) [1] |
Bias [1] |
RMSE [1] |
Phase Shift [months] |
Bias Score [1] |
RMSE Score [1] |
Seasonal Cycle Score [1] |
Spatial Distribution Score [1] |
Overall Score [1] |
|||
|---|---|---|---|---|---|---|---|---|---|---|---|---|---|---|---|---|
| Benchmark | [-] | 0.762 | ||||||||||||||
| CRUNCEPv7 | [-] | 0.961 | 0.861 | 2.92 | 0.754 | 2.06 | 0.247 | 0.672 | 2.24 | 0.275 | 0.131 | 0.616 | 0.632 | 0.357 | ||
| GSWP3v1 | [-] | 0.928 | 0.826 | 2.98 | 0.754 | 2.06 | 0.213 | 0.643 | 2.20 | 0.266 | 0.146 | 0.637 | 0.696 | 0.378 | ||
| WATCH | [-] | 1.04 | 0.949 | 2.89 | 0.754 | 2.06 | 0.328 | 0.632 | 2.48 | 0.234 | 0.212 | 0.585 | 0.696 | 0.388 |
Download Data |
Period Mean (original grids) [1] |
Model Period Mean (intersection) [1] |
Model Period Mean (complement) [1] |
Benchmark Period Mean (intersection) [1] |
Benchmark Period Mean (complement) [1] |
Bias [1] |
RMSE [1] |
Phase Shift [months] |
Bias Score [1] |
RMSE Score [1] |
Seasonal Cycle Score [1] |
Spatial Distribution Score [1] |
Overall Score [1] |
|||
|---|---|---|---|---|---|---|---|---|---|---|---|---|---|---|---|---|
| Benchmark | [-] | 1.52 | ||||||||||||||
| CRUNCEPv7 | [-] | 3.01 | 2.98 | 3.39 | 1.52 | 1.36 | 1.48 | 1.94 | 1.11 | 0.181 | 0.206 | 0.857 | 0.565 | 0.403 | ||
| GSWP3v1 | [-] | 2.34 | 2.31 | 2.66 | 1.52 | 1.36 | 0.822 | 1.34 | 1.01 | 0.290 | 0.259 | 0.878 | 0.791 | 0.495 | ||
| WATCH | [-] | 1.76 | 1.73 | 2.14 | 1.52 | 1.36 | 0.249 | 0.889 | 0.965 | 0.454 | 0.357 | 0.889 | 0.963 | 0.604 |
Download Data |
Period Mean (original grids) [1] |
Model Period Mean (intersection) [1] |
Model Period Mean (complement) [1] |
Benchmark Period Mean (intersection) [1] |
Benchmark Period Mean (complement) [1] |
Bias [1] |
RMSE [1] |
Phase Shift [months] |
Bias Score [1] |
RMSE Score [1] |
Seasonal Cycle Score [1] |
Spatial Distribution Score [1] |
Overall Score [1] |
|||
|---|---|---|---|---|---|---|---|---|---|---|---|---|---|---|---|---|
| Benchmark | [-] | 1.36 | ||||||||||||||
| CRUNCEPv7 | [-] | 1.66 | 1.80 | 0.718 | 1.36 | 1.80 | 0.481 | 1.08 | 2.02 | 0.214 | 0.257 | 0.636 | 0.829 | 0.439 | ||
| GSWP3v1 | [-] | 1.39 | 1.51 | 0.620 | 1.36 | 1.80 | 0.190 | 0.880 | 2.04 | 0.279 | 0.293 | 0.643 | 0.911 | 0.483 | ||
| WATCH | [-] | 1.41 | 1.53 | 0.583 | 1.36 | 1.80 | 0.204 | 0.828 | 2.10 | 0.304 | 0.326 | 0.606 | 0.940 | 0.500 |
Download Data |
Period Mean (original grids) [1] |
Model Period Mean (intersection) [1] |
Model Period Mean (complement) [1] |
Benchmark Period Mean (intersection) [1] |
Benchmark Period Mean (complement) [1] |
Bias [1] |
RMSE [1] |
Phase Shift [months] |
Bias Score [1] |
RMSE Score [1] |
Seasonal Cycle Score [1] |
Spatial Distribution Score [1] |
Overall Score [1] |
|||
|---|---|---|---|---|---|---|---|---|---|---|---|---|---|---|---|---|
| Benchmark | [-] | 0.0908 | ||||||||||||||
| CRUNCEPv7 | [-] | 0.196 | 0.188 | 0.540 | 0.0904 | 0.233 | 0.108 | 0.233 | 1.78 | 0.207 | 0.0840 | 0.815 | 0.701 | 0.378 | ||
| GSWP3v1 | [-] | 0.180 | 0.173 | 0.547 | 0.0904 | 0.233 | 0.0949 | 0.207 | 2.09 | 0.225 | 0.111 | 0.819 | 0.738 | 0.401 | ||
| WATCH | [-] | 0.183 | 0.175 | 0.529 | 0.0904 | 0.233 | 0.0945 | 0.203 | 1.80 | 0.230 | 0.142 | 0.790 | 0.724 | 0.405 |
Download Data |
Period Mean (original grids) [1] |
Model Period Mean (intersection) [1] |
Model Period Mean (complement) [1] |
Benchmark Period Mean (intersection) [1] |
Benchmark Period Mean (complement) [1] |
Bias [1] |
RMSE [1] |
Phase Shift [months] |
Bias Score [1] |
RMSE Score [1] |
Seasonal Cycle Score [1] |
Spatial Distribution Score [1] |
Overall Score [1] |
|||
|---|---|---|---|---|---|---|---|---|---|---|---|---|---|---|---|---|
| Benchmark | [-] | 0.650 | ||||||||||||||
| CRUNCEPv7 | [-] | 1.29 | 1.33 | 0.828 | 0.650 | 0.453 | 0.649 | 1.34 | 2.41 | 0.253 | 0.174 | 0.700 | 0.508 | 0.361 | ||
| GSWP3v1 | [-] | 1.15 | 1.19 | 0.692 | 0.650 | 0.453 | 0.512 | 1.12 | 2.13 | 0.322 | 0.200 | 0.759 | 0.572 | 0.411 | ||
| WATCH | [-] | 0.912 | 0.936 | 0.631 | 0.650 | 0.453 | 0.271 | 0.936 | 2.16 | 0.406 | 0.256 | 0.761 | 0.732 | 0.482 |
Download Data |
Period Mean (original grids) [1] |
Model Period Mean (intersection) [1] |
Model Period Mean (complement) [1] |
Benchmark Period Mean (intersection) [1] |
Benchmark Period Mean (complement) [1] |
Bias [1] |
RMSE [1] |
Phase Shift [months] |
Bias Score [1] |
RMSE Score [1] |
Seasonal Cycle Score [1] |
Spatial Distribution Score [1] |
Overall Score [1] |
|||
|---|---|---|---|---|---|---|---|---|---|---|---|---|---|---|---|---|
| Benchmark | [-] | 2.08 | ||||||||||||||
| CRUNCEPv7 | [-] | 1.99 | 1.94 | 2.47 | 2.08 | 2.33 | -0.00250 | 1.02 | 2.44 | 0.218 | 0.229 | 0.524 | 0.914 | 0.423 | ||
| GSWP3v1 | [-] | 1.74 | 1.69 | 2.19 | 2.08 | 2.33 | -0.254 | 0.946 | 2.41 | 0.209 | 0.258 | 0.536 | 0.958 | 0.444 | ||
| WATCH | [-] | 1.74 | 1.71 | 2.07 | 2.08 | 2.33 | -0.250 | 0.872 | 2.64 | 0.251 | 0.299 | 0.498 | 0.964 | 0.462 |
Download Data |
Period Mean (original grids) [1] |
Model Period Mean (intersection) [1] |
Model Period Mean (complement) [1] |
Benchmark Period Mean (intersection) [1] |
Benchmark Period Mean (complement) [1] |
Bias [1] |
RMSE [1] |
Phase Shift [months] |
Bias Score [1] |
RMSE Score [1] |
Seasonal Cycle Score [1] |
Spatial Distribution Score [1] |
Overall Score [1] |
|||
|---|---|---|---|---|---|---|---|---|---|---|---|---|---|---|---|---|
| Benchmark | [-] | 1.99 | ||||||||||||||
| CRUNCEPv7 | [-] | 2.56 | 2.62 | 2.21 | 1.99 | 1.63 | 0.677 | 1.28 | 1.33 | 0.472 | 0.385 | 0.840 | 0.923 | 0.601 | ||
| GSWP3v1 | [-] | 1.97 | 2.00 | 1.77 | 1.99 | 1.63 | 0.0511 | 1.05 | 1.12 | 0.515 | 0.465 | 0.873 | 0.945 | 0.653 | ||
| WATCH | [-] | 2.22 | 2.27 | 1.69 | 1.99 | 1.63 | 0.305 | 0.996 | 1.19 | 0.562 | 0.477 | 0.860 | 0.943 | 0.664 |
Download Data |
Period Mean (original grids) [1] |
Model Period Mean (intersection) [1] |
Model Period Mean (complement) [1] |
Benchmark Period Mean (intersection) [1] |
Benchmark Period Mean (complement) [1] |
Bias [1] |
RMSE [1] |
Phase Shift [months] |
Bias Score [1] |
RMSE Score [1] |
Seasonal Cycle Score [1] |
Spatial Distribution Score [1] |
Overall Score [1] |
|||
|---|---|---|---|---|---|---|---|---|---|---|---|---|---|---|---|---|
| Benchmark | [-] | 2.03 | ||||||||||||||
| CRUNCEPv7 | [-] | 3.65 | 3.66 | 2.86 | 2.03 | 2.79 | 1.64 | 2.01 | 1.85 | 0.146 | 0.261 | 0.699 | 0.715 | 0.416 | ||
| GSWP3v1 | [-] | 2.78 | 2.80 | 2.09 | 2.03 | 2.79 | 0.777 | 1.34 | 1.55 | 0.304 | 0.313 | 0.765 | 0.830 | 0.505 | ||
| WATCH | [-] | 2.56 | 2.58 | 1.93 | 2.03 | 2.79 | 0.555 | 1.16 | 1.66 | 0.330 | 0.323 | 0.741 | 0.952 | 0.534 |
Download Data |
Period Mean (original grids) [1] |
Model Period Mean (intersection) [1] |
Model Period Mean (complement) [1] |
Benchmark Period Mean (intersection) [1] |
Benchmark Period Mean (complement) [1] |
Bias [1] |
RMSE [1] |
Phase Shift [months] |
Bias Score [1] |
RMSE Score [1] |
Seasonal Cycle Score [1] |
Spatial Distribution Score [1] |
Overall Score [1] |
|||
|---|---|---|---|---|---|---|---|---|---|---|---|---|---|---|---|---|
| Benchmark | [-] | 0.769 | ||||||||||||||
| CRUNCEPv7 | [-] | 0.749 | 0.734 | 3.95 | 0.767 | 2.81 | 0.00110 | 0.737 | 1.44 | 0.178 | 0.249 | 0.823 | 0.875 | 0.475 | ||
| GSWP3v1 | [-] | 0.706 | 0.703 | 2.76 | 0.767 | 2.81 | -0.0308 | 0.714 | 1.23 | 0.211 | 0.265 | 0.865 | 0.877 | 0.497 | ||
| WATCH | [-] | 0.848 | 0.835 | 3.44 | 0.767 | 2.81 | 0.0954 | 0.818 | 1.34 | 0.185 | 0.252 | 0.845 | 0.873 | 0.482 |
Download Data |
Period Mean (original grids) [1] |
Model Period Mean (intersection) [1] |
Model Period Mean (complement) [1] |
Benchmark Period Mean (intersection) [1] |
Benchmark Period Mean (complement) [1] |
Bias [1] |
RMSE [1] |
Phase Shift [months] |
Bias Score [1] |
RMSE Score [1] |
Seasonal Cycle Score [1] |
Spatial Distribution Score [1] |
Overall Score [1] |
|||
|---|---|---|---|---|---|---|---|---|---|---|---|---|---|---|---|---|
| Benchmark | [-] | 3.88 | ||||||||||||||
| CRUNCEPv7 | [-] | 5.02 | 5.04 | 4.05 | 3.88 | 2.76 | 1.15 | 1.45 | 2.40 | 0.0967 | 0.276 | 0.648 | 0.955 | 0.450 | ||
| GSWP3v1 | [-] | 4.20 | 4.22 | 3.56 | 3.88 | 2.76 | 0.326 | 0.874 | 2.46 | 0.242 | 0.296 | 0.638 | 0.975 | 0.489 | ||
| WATCH | [-] | 4.37 | 4.39 | 3.44 | 3.88 | 2.76 | 0.497 | 0.927 | 2.86 | 0.154 | 0.332 | 0.545 | 0.952 | 0.463 |
Download Data |
Period Mean (original grids) [1] |
Model Period Mean (intersection) [1] |
Model Period Mean (complement) [1] |
Benchmark Period Mean (intersection) [1] |
Benchmark Period Mean (complement) [1] |
Bias [1] |
RMSE [1] |
Phase Shift [months] |
Bias Score [1] |
RMSE Score [1] |
Seasonal Cycle Score [1] |
Spatial Distribution Score [1] |
Overall Score [1] |
|||
|---|---|---|---|---|---|---|---|---|---|---|---|---|---|---|---|---|
| Benchmark | [-] | 1.92 | ||||||||||||||
| CRUNCEPv7 | [-] | 2.48 | 2.45 | 3.80 | 1.92 | 1.61 | 0.562 | 1.50 | 2.73 | 0.246 | 0.215 | 0.539 | 0.640 | 0.371 | ||
| GSWP3v1 | [-] | 2.07 | 2.04 | 3.26 | 1.92 | 1.61 | 0.151 | 1.13 | 2.71 | 0.269 | 0.271 | 0.549 | 0.754 | 0.423 | ||
| WATCH | [-] | 2.21 | 2.18 | 2.98 | 1.92 | 1.61 | 0.279 | 1.08 | 2.70 | 0.286 | 0.316 | 0.553 | 0.854 | 0.465 |
Download Data |
Period Mean (original grids) [1] |
Model Period Mean (intersection) [1] |
Model Period Mean (complement) [1] |
Benchmark Period Mean (intersection) [1] |
Benchmark Period Mean (complement) [1] |
Bias [1] |
RMSE [1] |
Phase Shift [months] |
Bias Score [1] |
RMSE Score [1] |
Seasonal Cycle Score [1] |
Spatial Distribution Score [1] |
Overall Score [1] |
|||
|---|---|---|---|---|---|---|---|---|---|---|---|---|---|---|---|---|
| Benchmark | [-] | 0.692 | ||||||||||||||
| CRUNCEPv7 | [-] | 1.18 | 1.17 | 1.64 | 0.687 | 1.18 | 0.625 | 0.985 | 1.96 | 0.110 | 0.0857 | 0.722 | 0.667 | 0.334 | ||
| GSWP3v1 | [-] | 1.32 | 1.31 | 1.56 | 0.687 | 1.18 | 0.718 | 1.08 | 2.02 | 0.115 | 0.122 | 0.692 | 0.700 | 0.350 | ||
| WATCH | [-] | 1.21 | 1.22 | 1.42 | 0.687 | 1.18 | 0.596 | 0.961 | 2.17 | 0.115 | 0.129 | 0.698 | 0.793 | 0.373 |
Temporally integrated period mean