Mean State
Download Data |
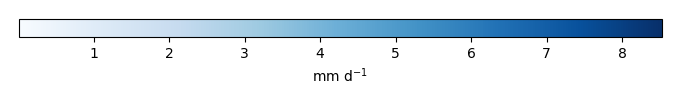
Period Mean (original grids) [mm d-1] |
Model Period Mean (intersection) [mm d-1] |
Model Period Mean (complement) [mm d-1] |
Benchmark Period Mean (intersection) [mm d-1] |
Benchmark Period Mean (complement) [mm d-1] |
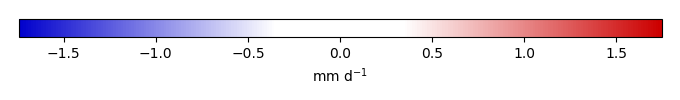
Bias [mm d-1] |
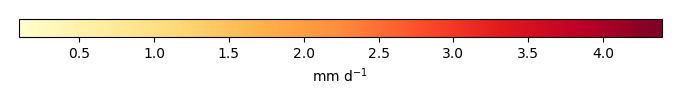
RMSE [mm d-1] |
Phase Shift [months] |
Bias Score [1] |
RMSE Score [1] |
Seasonal Cycle Score [1] |
Spatial Distribution Score [1] |
Interannual Variability Score [1] |
Overall Score [1] |
|||
|---|---|---|---|---|---|---|---|---|---|---|---|---|---|---|---|---|---|
| Benchmark | [-] | 3.68 | |||||||||||||||
| CRUNCEPv7 | [-] | 3.53 | 3.55 | 3.70 | 3.31 | -0.154 | 1.51 | 0.606 | 0.829 | 0.516 | 0.933 | 0.993 | 0.805 | 0.765 | |||
| GSWP3v1 | [-] | 3.57 | 3.58 | 3.70 | 3.31 | -0.120 | 1.58 | 0.837 | 0.806 | 0.502 | 0.910 | 0.990 | 0.635 | 0.724 | |||
| WATCH | [-] | 4.15 | 4.16 | 3.72 | 3.36 | 0.398 | 2.12 | 0.959 | 0.743 | 0.429 | 0.862 | 0.884 | 0.579 | 0.654 |
Download Data |
Period Mean (original grids) [mm d-1] |
Model Period Mean (intersection) [mm d-1] |
Model Period Mean (complement) [mm d-1] |
Benchmark Period Mean (intersection) [mm d-1] |
Benchmark Period Mean (complement) [mm d-1] |
Bias [mm d-1] |
RMSE [mm d-1] |
Phase Shift [months] |
Bias Score [1] |
RMSE Score [1] |
Seasonal Cycle Score [1] |
Spatial Distribution Score [1] |
Interannual Variability Score [1] |
Overall Score [1] |
|||
|---|---|---|---|---|---|---|---|---|---|---|---|---|---|---|---|---|---|
| Benchmark | [-] | 2.47 | |||||||||||||||
| CRUNCEPv7 | [-] | 2.24 | 2.21 | 2.45 | 3.94 | -0.236 | 1.24 | 0.213 | 0.859 | 0.640 | 0.976 | 0.992 | 0.757 | 0.811 | |||
| GSWP3v1 | [-] | 2.34 | 2.31 | 2.45 | 3.94 | -0.131 | 1.12 | 0.222 | 0.863 | 0.664 | 0.973 | 0.990 | 0.734 | 0.815 | |||
| WATCH | [-] | 2.46 | 2.42 | 2.43 | 4.15 | -0.00907 | 1.27 | 0.292 | 0.853 | 0.625 | 0.966 | 0.989 | 0.633 | 0.782 |
Download Data |
Period Mean (original grids) [mm d-1] |
Model Period Mean (intersection) [mm d-1] |
Model Period Mean (complement) [mm d-1] |
Benchmark Period Mean (intersection) [mm d-1] |
Benchmark Period Mean (complement) [mm d-1] |
Bias [mm d-1] |
RMSE [mm d-1] |
Phase Shift [months] |
Bias Score [1] |
RMSE Score [1] |
Seasonal Cycle Score [1] |
Spatial Distribution Score [1] |
Interannual Variability Score [1] |
Overall Score [1] |
|||
|---|---|---|---|---|---|---|---|---|---|---|---|---|---|---|---|---|---|
| Benchmark | [-] | 2.43 | |||||||||||||||
| CRUNCEPv7 | [-] | 2.29 | 2.28 | 2.43 | 2.45 | -0.149 | 1.24 | 0.700 | 0.861 | 0.617 | 0.916 | 0.990 | 0.844 | 0.807 | |||
| GSWP3v1 | [-] | 2.37 | 2.37 | 2.43 | 2.45 | -0.0788 | 1.22 | 0.593 | 0.855 | 0.623 | 0.921 | 0.986 | 0.750 | 0.793 | |||
| WATCH | [-] | 2.36 | 2.36 | 2.43 | 2.50 | -0.0522 | 1.35 | 0.756 | 0.856 | 0.587 | 0.911 | 0.971 | 0.773 | 0.781 |
Download Data |
Period Mean (original grids) [mm d-1] |
Model Period Mean (intersection) [mm d-1] |
Model Period Mean (complement) [mm d-1] |
Benchmark Period Mean (intersection) [mm d-1] |
Benchmark Period Mean (complement) [mm d-1] |
Bias [mm d-1] |
RMSE [mm d-1] |
Phase Shift [months] |
Bias Score [1] |
RMSE Score [1] |
Seasonal Cycle Score [1] |
Spatial Distribution Score [1] |
Interannual Variability Score [1] |
Overall Score [1] |
|||
|---|---|---|---|---|---|---|---|---|---|---|---|---|---|---|---|---|---|
| Benchmark | [-] | 1.33 | |||||||||||||||
| CRUNCEPv7 | [-] | 0.909 | 0.910 | 1.31 | 1.57 | -0.369 | 0.644 | 0.683 | 0.636 | 0.555 | 0.888 | 0.943 | 0.747 | 0.720 | |||
| GSWP3v1 | [-] | 1.12 | 1.11 | 1.31 | 1.57 | -0.155 | 0.528 | 0.674 | 0.764 | 0.584 | 0.897 | 0.986 | 0.838 | 0.776 | |||
| WATCH | [-] | 1.09 | 1.09 | 1.29 | 1.55 | -0.165 | 0.579 | 0.695 | 0.753 | 0.526 | 0.895 | 0.989 | 0.808 | 0.749 |
Download Data |
Period Mean (original grids) [mm d-1] |
Model Period Mean (intersection) [mm d-1] |
Model Period Mean (complement) [mm d-1] |
Benchmark Period Mean (intersection) [mm d-1] |
Benchmark Period Mean (complement) [mm d-1] |
Bias [mm d-1] |
RMSE [mm d-1] |
Phase Shift [months] |
Bias Score [1] |
RMSE Score [1] |
Seasonal Cycle Score [1] |
Spatial Distribution Score [1] |
Interannual Variability Score [1] |
Overall Score [1] |
|||
|---|---|---|---|---|---|---|---|---|---|---|---|---|---|---|---|---|---|
| Benchmark | [-] | 6.97 | |||||||||||||||
| CRUNCEPv7 | [-] | 7.89 | 7.90 | 7.28 | 5.92 | 0.273 | 3.18 | 1.29 | 0.682 | 0.403 | 0.811 | 0.989 | 0.729 | 0.669 | |||
| GSWP3v1 | [-] | 8.02 | 8.04 | 7.28 | 5.92 | 0.268 | 3.18 | 1.31 | 0.660 | 0.422 | 0.795 | 0.950 | 0.746 | 0.666 | |||
| WATCH | [-] | 8.05 | 8.05 | 7.20 | 5.89 | 0.606 | 3.35 | 1.39 | 0.679 | 0.389 | 0.782 | 0.988 | 0.764 | 0.665 |
Download Data |
Period Mean (original grids) [mm d-1] |
Model Period Mean (intersection) [mm d-1] |
Model Period Mean (complement) [mm d-1] |
Benchmark Period Mean (intersection) [mm d-1] |
Benchmark Period Mean (complement) [mm d-1] |
Bias [mm d-1] |
RMSE [mm d-1] |
Phase Shift [months] |
Bias Score [1] |
RMSE Score [1] |
Seasonal Cycle Score [1] |
Spatial Distribution Score [1] |
Interannual Variability Score [1] |
Overall Score [1] |
|||
|---|---|---|---|---|---|---|---|---|---|---|---|---|---|---|---|---|---|
| Benchmark | [-] | 1.71 | |||||||||||||||
| CRUNCEPv7 | [-] | 1.40 | 1.40 | 1.70 | 2.46 | -0.290 | 0.581 | 0.931 | 0.705 | 0.610 | 0.826 | 0.876 | 0.883 | 0.752 | |||
| GSWP3v1 | [-] | 1.47 | 1.47 | 1.70 | 2.46 | -0.216 | 0.507 | 0.833 | 0.761 | 0.642 | 0.844 | 0.972 | 0.898 | 0.793 | |||
| WATCH | [-] | 1.51 | 1.51 | 1.68 | 2.44 | -0.154 | 0.557 | 0.848 | 0.794 | 0.591 | 0.844 | 0.935 | 0.892 | 0.774 |
Download Data |
Period Mean (original grids) [mm d-1] |
Model Period Mean (intersection) [mm d-1] |
Model Period Mean (complement) [mm d-1] |
Benchmark Period Mean (intersection) [mm d-1] |
Benchmark Period Mean (complement) [mm d-1] |
Bias [mm d-1] |
RMSE [mm d-1] |
Phase Shift [months] |
Bias Score [1] |
RMSE Score [1] |
Seasonal Cycle Score [1] |
Spatial Distribution Score [1] |
Interannual Variability Score [1] |
Overall Score [1] |
|||
|---|---|---|---|---|---|---|---|---|---|---|---|---|---|---|---|---|---|
| Benchmark | [-] | 1.77 | |||||||||||||||
| CRUNCEPv7 | [-] | 1.40 | 1.40 | 1.74 | 2.79 | -0.232 | 0.828 | 1.01 | 0.782 | 0.581 | 0.872 | 0.988 | 0.821 | 0.771 | |||
| GSWP3v1 | [-] | 1.46 | 1.47 | 1.74 | 2.79 | -0.173 | 0.743 | 0.768 | 0.792 | 0.620 | 0.896 | 0.987 | 0.837 | 0.792 | |||
| WATCH | [-] | 1.48 | 1.49 | 1.74 | 2.79 | -0.140 | 0.822 | 0.869 | 0.810 | 0.578 | 0.886 | 0.991 | 0.837 | 0.780 |
Download Data |
Period Mean (original grids) [mm d-1] |
Model Period Mean (intersection) [mm d-1] |
Model Period Mean (complement) [mm d-1] |
Benchmark Period Mean (intersection) [mm d-1] |
Benchmark Period Mean (complement) [mm d-1] |
Bias [mm d-1] |
RMSE [mm d-1] |
Phase Shift [months] |
Bias Score [1] |
RMSE Score [1] |
Seasonal Cycle Score [1] |
Spatial Distribution Score [1] |
Interannual Variability Score [1] |
Overall Score [1] |
|||
|---|---|---|---|---|---|---|---|---|---|---|---|---|---|---|---|---|---|
| Benchmark | [-] | 3.99 | |||||||||||||||
| CRUNCEPv7 | [-] | 3.44 | 3.42 | 3.89 | 5.24 | -0.213 | 2.26 | 0.718 | 0.822 | 0.576 | 0.924 | 0.974 | 0.763 | 0.773 | |||
| GSWP3v1 | [-] | 3.73 | 3.71 | 3.89 | 5.24 | 0.0311 | 2.39 | 0.665 | 0.789 | 0.580 | 0.916 | 0.919 | 0.738 | 0.754 | |||
| WATCH | [-] | 3.57 | 3.56 | 3.90 | 5.24 | -0.0237 | 2.48 | 0.656 | 0.813 | 0.554 | 0.931 | 0.945 | 0.758 | 0.759 |
Download Data |
Period Mean (original grids) [mm d-1] |
Model Period Mean (intersection) [mm d-1] |
Model Period Mean (complement) [mm d-1] |
Benchmark Period Mean (intersection) [mm d-1] |
Benchmark Period Mean (complement) [mm d-1] |
Bias [mm d-1] |
RMSE [mm d-1] |
Phase Shift [months] |
Bias Score [1] |
RMSE Score [1] |
Seasonal Cycle Score [1] |
Spatial Distribution Score [1] |
Interannual Variability Score [1] |
Overall Score [1] |
|||
|---|---|---|---|---|---|---|---|---|---|---|---|---|---|---|---|---|---|
| Benchmark | [-] | 1.56 | |||||||||||||||
| CRUNCEPv7 | [-] | 1.05 | 1.05 | 1.57 | 1.29 | -0.528 | 0.710 | 1.15 | 0.482 | 0.528 | 0.837 | 0.791 | 0.771 | 0.656 | |||
| GSWP3v1 | [-] | 1.29 | 1.30 | 1.57 | 1.29 | -0.282 | 0.531 | 0.823 | 0.668 | 0.568 | 0.886 | 0.975 | 0.881 | 0.758 | |||
| WATCH | [-] | 1.32 | 1.33 | 1.53 | 1.24 | -0.226 | 0.573 | 1.11 | 0.694 | 0.500 | 0.846 | 0.983 | 0.861 | 0.731 |
Download Data |
Period Mean (original grids) [mm d-1] |
Model Period Mean (intersection) [mm d-1] |
Model Period Mean (complement) [mm d-1] |
Benchmark Period Mean (intersection) [mm d-1] |
Benchmark Period Mean (complement) [mm d-1] |
Bias [mm d-1] |
RMSE [mm d-1] |
Phase Shift [months] |
Bias Score [1] |
RMSE Score [1] |
Seasonal Cycle Score [1] |
Spatial Distribution Score [1] |
Interannual Variability Score [1] |
Overall Score [1] |
|||
|---|---|---|---|---|---|---|---|---|---|---|---|---|---|---|---|---|---|
| Benchmark | [-] | 1.74 | |||||||||||||||
| CRUNCEPv7 | [-] | 1.42 | 1.41 | 1.65 | 2.87 | -0.101 | 0.976 | 0.710 | 0.832 | 0.585 | 0.911 | 0.973 | 0.830 | 0.786 | |||
| GSWP3v1 | [-] | 1.48 | 1.48 | 1.65 | 2.87 | -0.0209 | 0.886 | 0.623 | 0.828 | 0.623 | 0.919 | 0.963 | 0.849 | 0.801 | |||
| WATCH | [-] | 1.50 | 1.50 | 1.65 | 2.89 | 0.0331 | 0.980 | 0.697 | 0.830 | 0.582 | 0.914 | 0.921 | 0.846 | 0.779 |
Download Data |
Period Mean (original grids) [mm d-1] |
Model Period Mean (intersection) [mm d-1] |
Model Period Mean (complement) [mm d-1] |
Benchmark Period Mean (intersection) [mm d-1] |
Benchmark Period Mean (complement) [mm d-1] |
Bias [mm d-1] |
RMSE [mm d-1] |
Phase Shift [months] |
Bias Score [1] |
RMSE Score [1] |
Seasonal Cycle Score [1] |
Spatial Distribution Score [1] |
Interannual Variability Score [1] |
Overall Score [1] |
|||
|---|---|---|---|---|---|---|---|---|---|---|---|---|---|---|---|---|---|
| Benchmark | [-] | 2.58 | |||||||||||||||
| CRUNCEPv7 | [-] | 2.13 | 2.13 | 2.55 | 2.82 | -0.396 | 1.00 | 1.20 | 0.688 | 0.564 | 0.808 | 0.983 | 0.807 | 0.735 | |||
| GSWP3v1 | [-] | 2.33 | 2.34 | 2.55 | 2.82 | -0.219 | 0.865 | 0.894 | 0.744 | 0.606 | 0.861 | 0.973 | 0.863 | 0.776 | |||
| WATCH | [-] | 2.36 | 2.36 | 2.55 | 2.85 | -0.171 | 0.953 | 1.02 | 0.732 | 0.574 | 0.845 | 0.970 | 0.846 | 0.757 |
Download Data |
Period Mean (original grids) [mm d-1] |
Model Period Mean (intersection) [mm d-1] |
Model Period Mean (complement) [mm d-1] |
Benchmark Period Mean (intersection) [mm d-1] |
Benchmark Period Mean (complement) [mm d-1] |
Bias [mm d-1] |
RMSE [mm d-1] |
Phase Shift [months] |
Bias Score [1] |
RMSE Score [1] |
Seasonal Cycle Score [1] |
Spatial Distribution Score [1] |
Interannual Variability Score [1] |
Overall Score [1] |
|||
|---|---|---|---|---|---|---|---|---|---|---|---|---|---|---|---|---|---|
| Benchmark | [-] | 2.68 | |||||||||||||||
| CRUNCEPv7 | [-] | 2.01 | 2.01 | 2.25 | 2.89 | -0.135 | 1.13 | 1.11 | 0.760 | 0.541 | 0.873 | 0.976 | 0.770 | 0.743 | |||
| GSWP3v1 | [-] | 2.09 | 2.09 | 2.25 | 2.89 | -0.0541 | 1.04 | 0.922 | 0.773 | 0.567 | 0.889 | 0.975 | 0.772 | 0.757 | |||
| WATCH | [-] | 2.13 | 2.13 | 2.26 | 2.89 | -0.00110 | 1.16 | 1.03 | 0.769 | 0.519 | 0.875 | 0.972 | 0.766 | 0.737 |
Download Data |
Period Mean (original grids) [mm d-1] |
Model Period Mean (intersection) [mm d-1] |
Model Period Mean (complement) [mm d-1] |
Benchmark Period Mean (intersection) [mm d-1] |
Benchmark Period Mean (complement) [mm d-1] |
Bias [mm d-1] |
RMSE [mm d-1] |
Phase Shift [months] |
Bias Score [1] |
RMSE Score [1] |
Seasonal Cycle Score [1] |
Spatial Distribution Score [1] |
Interannual Variability Score [1] |
Overall Score [1] |
|||
|---|---|---|---|---|---|---|---|---|---|---|---|---|---|---|---|---|---|
| Benchmark | [-] | 0.447 | |||||||||||||||
| CRUNCEPv7 | [-] | 0.306 | 0.307 | 0.433 | 0.795 | -0.102 | 0.429 | 1.33 | 0.749 | 0.498 | 0.836 | 0.968 | 0.743 | 0.715 | |||
| GSWP3v1 | [-] | 0.350 | 0.352 | 0.433 | 0.795 | -0.0574 | 0.397 | 0.986 | 0.745 | 0.523 | 0.854 | 0.963 | 0.760 | 0.728 | |||
| WATCH | [-] | 0.338 | 0.340 | 0.437 | 0.808 | -0.0729 | 0.412 | 1.03 | 0.750 | 0.510 | 0.854 | 0.970 | 0.748 | 0.724 |
Download Data |
Period Mean (original grids) [mm d-1] |
Model Period Mean (intersection) [mm d-1] |
Model Period Mean (complement) [mm d-1] |
Benchmark Period Mean (intersection) [mm d-1] |
Benchmark Period Mean (complement) [mm d-1] |
Bias [mm d-1] |
RMSE [mm d-1] |
Phase Shift [months] |
Bias Score [1] |
RMSE Score [1] |
Seasonal Cycle Score [1] |
Spatial Distribution Score [1] |
Interannual Variability Score [1] |
Overall Score [1] |
|||
|---|---|---|---|---|---|---|---|---|---|---|---|---|---|---|---|---|---|
| Benchmark | [-] | 1.25 | |||||||||||||||
| CRUNCEPv7 | [-] | 0.970 | 0.960 | 1.23 | 1.66 | -0.251 | 0.611 | 0.412 | 0.695 | 0.507 | 0.935 | 0.956 | 0.743 | 0.724 | |||
| GSWP3v1 | [-] | 1.21 | 1.20 | 1.23 | 1.66 | 0.00700 | 0.606 | 0.400 | 0.719 | 0.508 | 0.933 | 0.923 | 0.719 | 0.718 | |||
| WATCH | [-] | 1.17 | 1.16 | 1.23 | 1.69 | -0.0601 | 0.609 | 0.466 | 0.685 | 0.495 | 0.913 | 0.964 | 0.807 | 0.727 |
Download Data |
Period Mean (original grids) [mm d-1] |
Model Period Mean (intersection) [mm d-1] |
Model Period Mean (complement) [mm d-1] |
Benchmark Period Mean (intersection) [mm d-1] |
Benchmark Period Mean (complement) [mm d-1] |
Bias [mm d-1] |
RMSE [mm d-1] |
Phase Shift [months] |
Bias Score [1] |
RMSE Score [1] |
Seasonal Cycle Score [1] |
Spatial Distribution Score [1] |
Interannual Variability Score [1] |
Overall Score [1] |
|||
|---|---|---|---|---|---|---|---|---|---|---|---|---|---|---|---|---|---|
| Benchmark | [-] | 3.23 | |||||||||||||||
| CRUNCEPv7 | [-] | 2.98 | 2.99 | 3.18 | 3.49 | 0.0927 | 1.89 | 0.956 | 0.761 | 0.523 | 0.842 | 0.944 | 0.683 | 0.713 | |||
| GSWP3v1 | [-] | 3.00 | 3.02 | 3.18 | 3.49 | 0.0801 | 1.71 | 0.866 | 0.767 | 0.569 | 0.867 | 0.955 | 0.747 | 0.745 | |||
| WATCH | [-] | 2.98 | 3.00 | 3.21 | 3.53 | 0.0425 | 1.94 | 0.953 | 0.769 | 0.503 | 0.850 | 0.964 | 0.710 | 0.716 |
Download Data |
Period Mean (original grids) [mm d-1] |
Model Period Mean (intersection) [mm d-1] |
Model Period Mean (complement) [mm d-1] |
Benchmark Period Mean (intersection) [mm d-1] |
Benchmark Period Mean (complement) [mm d-1] |
Bias [mm d-1] |
RMSE [mm d-1] |
Phase Shift [months] |
Bias Score [1] |
RMSE Score [1] |
Seasonal Cycle Score [1] |
Spatial Distribution Score [1] |
Interannual Variability Score [1] |
Overall Score [1] |
|||
|---|---|---|---|---|---|---|---|---|---|---|---|---|---|---|---|---|---|
| Benchmark | [-] | 3.28 | |||||||||||||||
| CRUNCEPv7 | [-] | 2.83 | 2.84 | 3.26 | 3.77 | -0.351 | 1.02 | 1.09 | 0.795 | 0.586 | 0.820 | 0.994 | 0.913 | 0.782 | |||
| GSWP3v1 | [-] | 3.04 | 3.06 | 3.26 | 3.77 | -0.147 | 0.922 | 0.890 | 0.870 | 0.601 | 0.856 | 0.997 | 0.903 | 0.805 | |||
| WATCH | [-] | 3.08 | 3.11 | 3.28 | 3.84 | -0.131 | 1.10 | 1.30 | 0.878 | 0.542 | 0.786 | 0.998 | 0.920 | 0.777 |
Download Data |
Period Mean (original grids) [mm d-1] |
Model Period Mean (intersection) [mm d-1] |
Model Period Mean (complement) [mm d-1] |
Benchmark Period Mean (intersection) [mm d-1] |
Benchmark Period Mean (complement) [mm d-1] |
Bias [mm d-1] |
RMSE [mm d-1] |
Phase Shift [months] |
Bias Score [1] |
RMSE Score [1] |
Seasonal Cycle Score [1] |
Spatial Distribution Score [1] |
Interannual Variability Score [1] |
Overall Score [1] |
|||
|---|---|---|---|---|---|---|---|---|---|---|---|---|---|---|---|---|---|
| Benchmark | [-] | 2.43 | |||||||||||||||
| CRUNCEPv7 | [-] | 2.02 | 2.03 | 2.35 | 4.76 | -0.205 | 0.879 | 0.661 | 0.762 | 0.535 | 0.899 | 0.959 | 0.835 | 0.754 | |||
| GSWP3v1 | [-] | 2.15 | 2.16 | 2.35 | 4.76 | -0.0441 | 0.753 | 0.624 | 0.785 | 0.598 | 0.908 | 0.976 | 0.820 | 0.781 | |||
| WATCH | [-] | 2.22 | 2.23 | 2.36 | 4.87 | 0.00551 | 0.850 | 0.757 | 0.771 | 0.549 | 0.893 | 0.979 | 0.846 | 0.765 |
Download Data |
Period Mean (original grids) [mm d-1] |
Model Period Mean (intersection) [mm d-1] |
Model Period Mean (complement) [mm d-1] |
Benchmark Period Mean (intersection) [mm d-1] |
Benchmark Period Mean (complement) [mm d-1] |
Bias [mm d-1] |
RMSE [mm d-1] |
Phase Shift [months] |
Bias Score [1] |
RMSE Score [1] |
Seasonal Cycle Score [1] |
Spatial Distribution Score [1] |
Interannual Variability Score [1] |
Overall Score [1] |
|||
|---|---|---|---|---|---|---|---|---|---|---|---|---|---|---|---|---|---|
| Benchmark | [-] | 1.44 | |||||||||||||||
| CRUNCEPv7 | [-] | 1.20 | 1.21 | 1.41 | 2.83 | -0.171 | 0.699 | 0.816 | 0.771 | 0.597 | 0.904 | 0.978 | 0.838 | 0.781 | |||
| GSWP3v1 | [-] | 1.29 | 1.30 | 1.41 | 2.83 | -0.0739 | 0.672 | 0.749 | 0.787 | 0.610 | 0.911 | 0.956 | 0.826 | 0.784 | |||
| WATCH | [-] | 1.48 | 1.48 | 1.45 | 2.90 | 0.0781 | 0.852 | 1.00 | 0.774 | 0.539 | 0.879 | 0.949 | 0.796 | 0.746 |
Download Data |
Period Mean (original grids) [mm d-1] |
Model Period Mean (intersection) [mm d-1] |
Model Period Mean (complement) [mm d-1] |
Benchmark Period Mean (intersection) [mm d-1] |
Benchmark Period Mean (complement) [mm d-1] |
Bias [mm d-1] |
RMSE [mm d-1] |
Phase Shift [months] |
Bias Score [1] |
RMSE Score [1] |
Seasonal Cycle Score [1] |
Spatial Distribution Score [1] |
Interannual Variability Score [1] |
Overall Score [1] |
|||
|---|---|---|---|---|---|---|---|---|---|---|---|---|---|---|---|---|---|
| Benchmark | [-] | 6.25 | |||||||||||||||
| CRUNCEPv7 | [-] | 6.02 | 6.02 | 6.29 | 4.51 | -0.241 | 2.42 | 0.670 | 0.780 | 0.526 | 0.921 | 0.990 | 0.707 | 0.742 | |||
| GSWP3v1 | [-] | 6.13 | 6.14 | 6.29 | 4.51 | -0.105 | 2.15 | 0.617 | 0.792 | 0.575 | 0.927 | 0.925 | 0.712 | 0.751 | |||
| WATCH | [-] | 6.20 | 6.20 | 6.26 | 4.59 | -0.0221 | 2.65 | 0.654 | 0.767 | 0.496 | 0.926 | 0.926 | 0.691 | 0.717 |
Download Data |
Period Mean (original grids) [mm d-1] |
Model Period Mean (intersection) [mm d-1] |
Model Period Mean (complement) [mm d-1] |
Benchmark Period Mean (intersection) [mm d-1] |
Benchmark Period Mean (complement) [mm d-1] |
Bias [mm d-1] |
RMSE [mm d-1] |
Phase Shift [months] |
Bias Score [1] |
RMSE Score [1] |
Seasonal Cycle Score [1] |
Spatial Distribution Score [1] |
Interannual Variability Score [1] |
Overall Score [1] |
|||
|---|---|---|---|---|---|---|---|---|---|---|---|---|---|---|---|---|---|
| Benchmark | [-] | 3.49 | |||||||||||||||
| CRUNCEPv7 | [-] | 3.28 | 3.26 | 3.49 | 3.32 | -0.209 | 1.42 | 0.652 | 0.854 | 0.614 | 0.922 | 0.990 | 0.878 | 0.812 | |||
| GSWP3v1 | [-] | 3.35 | 3.34 | 3.49 | 3.32 | -0.136 | 1.28 | 0.610 | 0.870 | 0.646 | 0.922 | 0.995 | 0.849 | 0.821 | |||
| WATCH | [-] | 3.49 | 3.47 | 3.53 | 3.35 | -0.0455 | 1.56 | 0.829 | 0.869 | 0.576 | 0.886 | 0.986 | 0.869 | 0.794 |
Download Data |
Period Mean (original grids) [mm d-1] |
Model Period Mean (intersection) [mm d-1] |
Model Period Mean (complement) [mm d-1] |
Benchmark Period Mean (intersection) [mm d-1] |
Benchmark Period Mean (complement) [mm d-1] |
Bias [mm d-1] |
RMSE [mm d-1] |
Phase Shift [months] |
Bias Score [1] |
RMSE Score [1] |
Seasonal Cycle Score [1] |
Spatial Distribution Score [1] |
Interannual Variability Score [1] |
Overall Score [1] |
|||
|---|---|---|---|---|---|---|---|---|---|---|---|---|---|---|---|---|---|
| Benchmark | [-] | 1.77 | |||||||||||||||
| CRUNCEPv7 | [-] | 1.14 | 1.14 | 1.78 | 1.62 | -0.559 | 1.31 | 0.862 | 0.538 | 0.466 | 0.929 | 0.935 | 0.678 | 0.669 | |||
| GSWP3v1 | [-] | 1.56 | 1.56 | 1.78 | 1.62 | -0.152 | 1.20 | 0.788 | 0.542 | 0.515 | 0.919 | 0.813 | 0.734 | 0.673 | |||
| WATCH | [-] | 1.21 | 1.22 | 1.82 | 1.68 | -0.488 | 1.38 | 1.04 | 0.546 | 0.446 | 0.906 | 0.926 | 0.687 | 0.659 |
Temporally integrated period mean