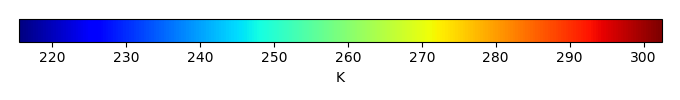
Mean State
Download Data |
Period Mean (original grids) [K] |
Model Period Mean (intersection) [K] |
Model Period Mean (complement) [K] |
Benchmark Period Mean (intersection) [K] |
Benchmark Period Mean (complement) [K] |
Bias [K] |
RMSE [K] |
Phase Shift [months] |
Bias Score [1] |
RMSE Score [1] |
Seasonal Cycle Score [1] |
Spatial Distribution Score [1] |
Interannual Variability Score [1] |
Overall Score [1] |
|||
|---|---|---|---|---|---|---|---|---|---|---|---|---|---|---|---|---|---|
| Benchmark | [-] | 299. | |||||||||||||||
| CRUNCEPv7 | [-] | 299. | 299. | 301. | 298. | 300. | 0.167 | 0.738 | 0.323 | 0.625 | 0.793 | 0.963 | 0.985 | 0.956 | 0.853 | ||
| GSWP3v1 | [-] | 299. | 299. | 300. | 298. | 300. | 0.285 | 0.690 | 0.366 | 0.667 | 0.779 | 0.967 | 1.00 | 0.955 | 0.858 | ||
| WATCH | [-] | 298. | 298. | 301. | 298. | 300. | 0.0939 | 1.05 | 0.579 | 0.606 | 0.532 | 0.943 | 0.996 | 0.908 | 0.753 |
Download Data |
Period Mean (original grids) [K] |
Model Period Mean (intersection) [K] |
Model Period Mean (complement) [K] |
Benchmark Period Mean (intersection) [K] |
Benchmark Period Mean (complement) [K] |
Bias [K] |
RMSE [K] |
Phase Shift [months] |
Bias Score [1] |
RMSE Score [1] |
Seasonal Cycle Score [1] |
Spatial Distribution Score [1] |
Interannual Variability Score [1] |
Overall Score [1] |
|||
|---|---|---|---|---|---|---|---|---|---|---|---|---|---|---|---|---|---|
| Benchmark | [-] | 300. | |||||||||||||||
| CRUNCEPv7 | [-] | 301. | 301. | 301. | 300. | 300. | 0.521 | 0.852 | 0.195 | 0.730 | 0.854 | 0.985 | 0.996 | 0.969 | 0.898 | ||
| GSWP3v1 | [-] | 301. | 301. | 301. | 300. | 300. | 0.473 | 0.802 | 0.168 | 0.746 | 0.862 | 0.987 | 0.990 | 0.964 | 0.902 | ||
| WATCH | [-] | 300. | 300. | 301. | 300. | 300. | -0.210 | 1.26 | 0.319 | 0.730 | 0.667 | 0.976 | 1.00 | 0.914 | 0.826 |
Download Data |
Period Mean (original grids) [K] |
Model Period Mean (intersection) [K] |
Model Period Mean (complement) [K] |
Benchmark Period Mean (intersection) [K] |
Benchmark Period Mean (complement) [K] |
Bias [K] |
RMSE [K] |
Phase Shift [months] |
Bias Score [1] |
RMSE Score [1] |
Seasonal Cycle Score [1] |
Spatial Distribution Score [1] |
Interannual Variability Score [1] |
Overall Score [1] |
|||
|---|---|---|---|---|---|---|---|---|---|---|---|---|---|---|---|---|---|
| Benchmark | [-] | 295. | |||||||||||||||
| CRUNCEPv7 | [-] | 296. | 295. | 297. | 295. | 297. | 0.445 | 0.865 | 0.404 | 0.708 | 0.867 | 0.945 | 1.00 | 0.948 | 0.889 | ||
| GSWP3v1 | [-] | 296. | 296. | 296. | 295. | 297. | 0.505 | 0.854 | 0.273 | 0.707 | 0.867 | 0.968 | 0.999 | 0.960 | 0.895 | ||
| WATCH | [-] | 295. | 295. | 296. | 295. | 297. | -0.155 | 1.25 | 0.594 | 0.685 | 0.701 | 0.922 | 0.995 | 0.845 | 0.808 |
Download Data |
Period Mean (original grids) [K] |
Model Period Mean (intersection) [K] |
Model Period Mean (complement) [K] |
Benchmark Period Mean (intersection) [K] |
Benchmark Period Mean (complement) [K] |
Bias [K] |
RMSE [K] |
Phase Shift [months] |
Bias Score [1] |
RMSE Score [1] |
Seasonal Cycle Score [1] |
Spatial Distribution Score [1] |
Interannual Variability Score [1] |
Overall Score [1] |
|||
|---|---|---|---|---|---|---|---|---|---|---|---|---|---|---|---|---|---|
| Benchmark | [-] | 262. | |||||||||||||||
| CRUNCEPv7 | [-] | 260. | 260. | 263. | 262. | 266. | -1.00 | 1.60 | 0.0159 | 0.921 | 0.943 | 0.999 | 0.999 | 0.921 | 0.954 | ||
| GSWP3v1 | [-] | 262. | 261. | 267. | 262. | 266. | 0.258 | 1.13 | 0.0161 | 0.941 | 0.957 | 0.999 | 1.00 | 0.939 | 0.965 | ||
| WATCH | [-] | 260. | 260. | 263. | 261. | 265. | -1.08 | 1.99 | 0.00912 | 0.919 | 0.912 | 0.999 | 0.999 | 0.881 | 0.937 |
Download Data |
Period Mean (original grids) [K] |
Model Period Mean (intersection) [K] |
Model Period Mean (complement) [K] |
Benchmark Period Mean (intersection) [K] |
Benchmark Period Mean (complement) [K] |
Bias [K] |
RMSE [K] |
Phase Shift [months] |
Bias Score [1] |
RMSE Score [1] |
Seasonal Cycle Score [1] |
Spatial Distribution Score [1] |
Interannual Variability Score [1] |
Overall Score [1] |
|||
|---|---|---|---|---|---|---|---|---|---|---|---|---|---|---|---|---|---|
| Benchmark | [-] | 299. | |||||||||||||||
| CRUNCEPv7 | [-] | 299. | 299. | 300. | 299. | 299. | -0.0330 | 0.793 | 0.616 | 0.415 | 0.681 | 0.912 | 0.996 | 0.880 | 0.761 | ||
| GSWP3v1 | [-] | 299. | 299. | 300. | 299. | 299. | 0.226 | 0.750 | 0.486 | 0.425 | 0.725 | 0.930 | 0.963 | 0.913 | 0.780 | ||
| WATCH | [-] | 299. | 299. | 300. | 299. | 299. | 0.0793 | 0.999 | 1.01 | 0.397 | 0.461 | 0.850 | 0.996 | 0.802 | 0.661 |
Download Data |
Period Mean (original grids) [K] |
Model Period Mean (intersection) [K] |
Model Period Mean (complement) [K] |
Benchmark Period Mean (intersection) [K] |
Benchmark Period Mean (complement) [K] |
Bias [K] |
RMSE [K] |
Phase Shift [months] |
Bias Score [1] |
RMSE Score [1] |
Seasonal Cycle Score [1] |
Spatial Distribution Score [1] |
Interannual Variability Score [1] |
Overall Score [1] |
|||
|---|---|---|---|---|---|---|---|---|---|---|---|---|---|---|---|---|---|
| Benchmark | [-] | 271. | |||||||||||||||
| CRUNCEPv7 | [-] | 271. | 270. | 274. | 271. | 274. | -0.737 | 1.06 | 0.00890 | 0.938 | 0.961 | 0.999 | 0.999 | 0.981 | 0.973 | ||
| GSWP3v1 | [-] | 271. | 271. | 275. | 271. | 274. | -0.0249 | 0.647 | 0.00842 | 0.966 | 0.971 | 0.999 | 1.00 | 0.979 | 0.981 | ||
| WATCH | [-] | 270. | 270. | 273. | 271. | 274. | -0.842 | 1.44 | 0.00791 | 0.933 | 0.933 | 0.999 | 0.998 | 0.946 | 0.957 |
Download Data |
Period Mean (original grids) [K] |
Model Period Mean (intersection) [K] |
Model Period Mean (complement) [K] |
Benchmark Period Mean (intersection) [K] |
Benchmark Period Mean (complement) [K] |
Bias [K] |
RMSE [K] |
Phase Shift [months] |
Bias Score [1] |
RMSE Score [1] |
Seasonal Cycle Score [1] |
Spatial Distribution Score [1] |
Interannual Variability Score [1] |
Overall Score [1] |
|||
|---|---|---|---|---|---|---|---|---|---|---|---|---|---|---|---|---|---|
| Benchmark | [-] | 280. | |||||||||||||||
| CRUNCEPv7 | [-] | 280. | 280. | 287. | 280. | 285. | -0.0730 | 1.17 | 0.0271 | 0.900 | 0.948 | 0.998 | 1.00 | 0.963 | 0.960 | ||
| GSWP3v1 | [-] | 281. | 280. | 288. | 280. | 285. | 0.249 | 1.09 | 0.0222 | 0.901 | 0.956 | 0.998 | 1.00 | 0.965 | 0.963 | ||
| WATCH | [-] | 280. | 279. | 287. | 280. | 285. | -0.454 | 1.59 | 0.0272 | 0.885 | 0.914 | 0.998 | 0.999 | 0.916 | 0.938 |
Download Data |
Period Mean (original grids) [K] |
Model Period Mean (intersection) [K] |
Model Period Mean (complement) [K] |
Benchmark Period Mean (intersection) [K] |
Benchmark Period Mean (complement) [K] |
Bias [K] |
RMSE [K] |
Phase Shift [months] |
Bias Score [1] |
RMSE Score [1] |
Seasonal Cycle Score [1] |
Spatial Distribution Score [1] |
Interannual Variability Score [1] |
Overall Score [1] |
|||
|---|---|---|---|---|---|---|---|---|---|---|---|---|---|---|---|---|---|
| Benchmark | [-] | 297. | |||||||||||||||
| CRUNCEPv7 | [-] | 297. | 297. | 300. | 297. | 300. | 0.195 | 1.12 | 0.170 | 0.749 | 0.886 | 0.983 | 0.998 | 0.940 | 0.907 | ||
| GSWP3v1 | [-] | 297. | 297. | 300. | 297. | 300. | 0.110 | 1.08 | 0.181 | 0.766 | 0.877 | 0.983 | 1.00 | 0.946 | 0.908 | ||
| WATCH | [-] | 297. | 297. | 300. | 297. | 300. | 0.147 | 1.46 | 0.229 | 0.745 | 0.788 | 0.980 | 1.00 | 0.899 | 0.867 |
Download Data |
Period Mean (original grids) [K] |
Model Period Mean (intersection) [K] |
Model Period Mean (complement) [K] |
Benchmark Period Mean (intersection) [K] |
Benchmark Period Mean (complement) [K] |
Bias [K] |
RMSE [K] |
Phase Shift [months] |
Bias Score [1] |
RMSE Score [1] |
Seasonal Cycle Score [1] |
Spatial Distribution Score [1] |
Interannual Variability Score [1] |
Overall Score [1] |
|||
|---|---|---|---|---|---|---|---|---|---|---|---|---|---|---|---|---|---|
| Benchmark | [-] | 264. | |||||||||||||||
| CRUNCEPv7 | [-] | 263. | 263. | 264. | 264. | 264. | -1.09 | 1.43 | 0.0193 | 0.929 | 0.948 | 0.999 | 0.999 | 0.970 | 0.965 | ||
| GSWP3v1 | [-] | 264. | 264. | 267. | 264. | 264. | 0.0517 | 0.717 | 0.0135 | 0.967 | 0.966 | 0.999 | 1.00 | 0.963 | 0.977 | ||
| WATCH | [-] | 263. | 263. | 264. | 264. | 264. | -0.917 | 1.62 | 0.0141 | 0.938 | 0.921 | 0.999 | 0.999 | 0.947 | 0.954 |
Download Data |
Period Mean (original grids) [K] |
Model Period Mean (intersection) [K] |
Model Period Mean (complement) [K] |
Benchmark Period Mean (intersection) [K] |
Benchmark Period Mean (complement) [K] |
Bias [K] |
RMSE [K] |
Phase Shift [months] |
Bias Score [1] |
RMSE Score [1] |
Seasonal Cycle Score [1] |
Spatial Distribution Score [1] |
Interannual Variability Score [1] |
Overall Score [1] |
|||
|---|---|---|---|---|---|---|---|---|---|---|---|---|---|---|---|---|---|
| Benchmark | [-] | 295. | |||||||||||||||
| CRUNCEPv7 | [-] | 295. | 295. | 293. | 295. | 294. | 0.323 | 0.624 | 0.0892 | 0.890 | 0.929 | 0.994 | 0.999 | 0.950 | 0.949 | ||
| GSWP3v1 | [-] | 295. | 295. | 294. | 295. | 294. | 0.479 | 0.699 | 0.0807 | 0.876 | 0.929 | 0.994 | 1.00 | 0.969 | 0.950 | ||
| WATCH | [-] | 295. | 295. | 293. | 295. | 294. | 0.264 | 0.830 | 0.116 | 0.880 | 0.888 | 0.992 | 0.998 | 0.946 | 0.932 |
Download Data |
Period Mean (original grids) [K] |
Model Period Mean (intersection) [K] |
Model Period Mean (complement) [K] |
Benchmark Period Mean (intersection) [K] |
Benchmark Period Mean (complement) [K] |
Bias [K] |
RMSE [K] |
Phase Shift [months] |
Bias Score [1] |
RMSE Score [1] |
Seasonal Cycle Score [1] |
Spatial Distribution Score [1] |
Interannual Variability Score [1] |
Overall Score [1] |
|||
|---|---|---|---|---|---|---|---|---|---|---|---|---|---|---|---|---|---|
| Benchmark | [-] | 282. | |||||||||||||||
| CRUNCEPv7 | [-] | 281. | 281. | 284. | 282. | 286. | -0.172 | 0.983 | 0.147 | 0.893 | 0.924 | 0.990 | 0.997 | 0.946 | 0.946 | ||
| GSWP3v1 | [-] | 282. | 282. | 284. | 282. | 286. | 0.117 | 0.866 | 0.145 | 0.899 | 0.936 | 0.990 | 1.00 | 0.970 | 0.955 | ||
| WATCH | [-] | 281. | 281. | 283. | 282. | 285. | -0.309 | 1.21 | 0.234 | 0.878 | 0.904 | 0.984 | 0.999 | 0.922 | 0.932 |
Download Data |
Period Mean (original grids) [K] |
Model Period Mean (intersection) [K] |
Model Period Mean (complement) [K] |
Benchmark Period Mean (intersection) [K] |
Benchmark Period Mean (complement) [K] |
Bias [K] |
RMSE [K] |
Phase Shift [months] |
Bias Score [1] |
RMSE Score [1] |
Seasonal Cycle Score [1] |
Spatial Distribution Score [1] |
Interannual Variability Score [1] |
Overall Score [1] |
|||
|---|---|---|---|---|---|---|---|---|---|---|---|---|---|---|---|---|---|
| Benchmark | [-] | 287. | |||||||||||||||
| CRUNCEPv7 | [-] | 282. | 286. | 244. | 287. | 292. | -0.107 | 1.02 | 0.157 | 0.821 | 0.900 | 0.982 | 0.998 | 0.952 | 0.926 | ||
| GSWP3v1 | [-] | 283. | 287. | 249. | 287. | 292. | 0.227 | 0.898 | 0.137 | 0.829 | 0.907 | 0.986 | 1.00 | 0.959 | 0.931 | ||
| WATCH | [-] | 282. | 286. | 248. | 286. | 292. | -0.345 | 1.37 | 0.248 | 0.802 | 0.810 | 0.972 | 0.999 | 0.907 | 0.883 |
Download Data |
Period Mean (original grids) [K] |
Model Period Mean (intersection) [K] |
Model Period Mean (complement) [K] |
Benchmark Period Mean (intersection) [K] |
Benchmark Period Mean (complement) [K] |
Bias [K] |
RMSE [K] |
Phase Shift [months] |
Bias Score [1] |
RMSE Score [1] |
Seasonal Cycle Score [1] |
Spatial Distribution Score [1] |
Interannual Variability Score [1] |
Overall Score [1] |
|||
|---|---|---|---|---|---|---|---|---|---|---|---|---|---|---|---|---|---|
| Benchmark | [-] | 296. | |||||||||||||||
| CRUNCEPv7 | [-] | 296. | 296. | 297. | 296. | 297. | 0.240 | 0.867 | 0.138 | 0.891 | 0.939 | 0.990 | 1.00 | 0.965 | 0.954 | ||
| GSWP3v1 | [-] | 296. | 296. | 296. | 296. | 297. | 0.191 | 0.824 | 0.134 | 0.898 | 0.939 | 0.990 | 0.999 | 0.963 | 0.955 | ||
| WATCH | [-] | 295. | 295. | 296. | 296. | 297. | -0.455 | 1.37 | 0.239 | 0.857 | 0.883 | 0.981 | 0.998 | 0.909 | 0.918 |
Download Data |
Period Mean (original grids) [K] |
Model Period Mean (intersection) [K] |
Model Period Mean (complement) [K] |
Benchmark Period Mean (intersection) [K] |
Benchmark Period Mean (complement) [K] |
Bias [K] |
RMSE [K] |
Phase Shift [months] |
Bias Score [1] |
RMSE Score [1] |
Seasonal Cycle Score [1] |
Spatial Distribution Score [1] |
Interannual Variability Score [1] |
Overall Score [1] |
|||
|---|---|---|---|---|---|---|---|---|---|---|---|---|---|---|---|---|---|
| Benchmark | [-] | 265. | |||||||||||||||
| CRUNCEPv7 | [-] | 264. | 264. | 261. | 265. | 266. | -0.989 | 1.43 | 0.0106 | 0.920 | 0.935 | 0.999 | 0.998 | 0.945 | 0.955 | ||
| GSWP3v1 | [-] | 265. | 265. | 266. | 265. | 266. | 0.255 | 0.978 | 0.0188 | 0.944 | 0.951 | 0.999 | 1.00 | 0.959 | 0.967 | ||
| WATCH | [-] | 264. | 264. | 262. | 265. | 266. | -0.618 | 1.32 | 0.0138 | 0.940 | 0.925 | 0.999 | 0.999 | 0.950 | 0.956 |
Download Data |
Period Mean (original grids) [K] |
Model Period Mean (intersection) [K] |
Model Period Mean (complement) [K] |
Benchmark Period Mean (intersection) [K] |
Benchmark Period Mean (complement) [K] |
Bias [K] |
RMSE [K] |
Phase Shift [months] |
Bias Score [1] |
RMSE Score [1] |
Seasonal Cycle Score [1] |
Spatial Distribution Score [1] |
Interannual Variability Score [1] |
Overall Score [1] |
|||
|---|---|---|---|---|---|---|---|---|---|---|---|---|---|---|---|---|---|
| Benchmark | [-] | 296. | |||||||||||||||
| CRUNCEPv7 | [-] | 295. | 295. | 298. | 296. | 298. | 0.206 | 1.20 | 0.263 | 0.668 | 0.847 | 0.977 | 1.00 | 0.925 | 0.877 | ||
| GSWP3v1 | [-] | 296. | 295. | 298. | 296. | 298. | 0.401 | 1.19 | 0.241 | 0.667 | 0.862 | 0.979 | 0.997 | 0.945 | 0.885 | ||
| WATCH | [-] | 295. | 295. | 298. | 296. | 298. | 0.241 | 1.56 | 0.280 | 0.643 | 0.739 | 0.981 | 0.999 | 0.873 | 0.829 |
Download Data |
Period Mean (original grids) [K] |
Model Period Mean (intersection) [K] |
Model Period Mean (complement) [K] |
Benchmark Period Mean (intersection) [K] |
Benchmark Period Mean (complement) [K] |
Bias [K] |
RMSE [K] |
Phase Shift [months] |
Bias Score [1] |
RMSE Score [1] |
Seasonal Cycle Score [1] |
Spatial Distribution Score [1] |
Interannual Variability Score [1] |
Overall Score [1] |
|||
|---|---|---|---|---|---|---|---|---|---|---|---|---|---|---|---|---|---|
| Benchmark | [-] | 286. | |||||||||||||||
| CRUNCEPv7 | [-] | 286. | 286. | 294. | 286. | 292. | -0.0907 | 0.670 | 0.0345 | 0.945 | 0.947 | 0.998 | 0.999 | 0.968 | 0.967 | ||
| GSWP3v1 | [-] | 286. | 286. | 294. | 286. | 292. | 0.281 | 0.608 | 0.0307 | 0.942 | 0.960 | 0.998 | 1.00 | 0.973 | 0.972 | ||
| WATCH | [-] | 285. | 285. | 293. | 286. | 292. | -0.648 | 1.05 | 0.0379 | 0.917 | 0.924 | 0.997 | 0.999 | 0.950 | 0.952 |
Download Data |
Period Mean (original grids) [K] |
Model Period Mean (intersection) [K] |
Model Period Mean (complement) [K] |
Benchmark Period Mean (intersection) [K] |
Benchmark Period Mean (complement) [K] |
Bias [K] |
RMSE [K] |
Phase Shift [months] |
Bias Score [1] |
RMSE Score [1] |
Seasonal Cycle Score [1] |
Spatial Distribution Score [1] |
Interannual Variability Score [1] |
Overall Score [1] |
|||
|---|---|---|---|---|---|---|---|---|---|---|---|---|---|---|---|---|---|
| Benchmark | [-] | 275. | |||||||||||||||
| CRUNCEPv7 | [-] | 274. | 274. | 277. | 274. | 278. | -0.630 | 1.01 | 0.0424 | 0.923 | 0.947 | 0.997 | 0.995 | 0.971 | 0.964 | ||
| GSWP3v1 | [-] | 274. | 274. | 278. | 274. | 278. | 0.109 | 0.688 | 0.0418 | 0.943 | 0.959 | 0.997 | 0.999 | 0.972 | 0.971 | ||
| WATCH | [-] | 273. | 273. | 277. | 274. | 278. | -0.691 | 1.28 | 0.0598 | 0.916 | 0.924 | 0.996 | 0.995 | 0.945 | 0.950 |
Download Data |
Period Mean (original grids) [K] |
Model Period Mean (intersection) [K] |
Model Period Mean (complement) [K] |
Benchmark Period Mean (intersection) [K] |
Benchmark Period Mean (complement) [K] |
Bias [K] |
RMSE [K] |
Phase Shift [months] |
Bias Score [1] |
RMSE Score [1] |
Seasonal Cycle Score [1] |
Spatial Distribution Score [1] |
Interannual Variability Score [1] |
Overall Score [1] |
|||
|---|---|---|---|---|---|---|---|---|---|---|---|---|---|---|---|---|---|
| Benchmark | [-] | 284. | |||||||||||||||
| CRUNCEPv7 | [-] | 283. | 283. | 287. | 284. | 286. | -0.0645 | 1.18 | 0.0249 | 0.883 | 0.924 | 0.998 | 1.00 | 0.965 | 0.949 | ||
| GSWP3v1 | [-] | 284. | 284. | 287. | 284. | 286. | 0.371 | 1.11 | 0.0268 | 0.879 | 0.936 | 0.998 | 1.00 | 0.963 | 0.952 | ||
| WATCH | [-] | 283. | 283. | 287. | 283. | 286. | -0.219 | 1.67 | 0.101 | 0.859 | 0.885 | 0.993 | 1.00 | 0.925 | 0.924 |
Download Data |
Period Mean (original grids) [K] |
Model Period Mean (intersection) [K] |
Model Period Mean (complement) [K] |
Benchmark Period Mean (intersection) [K] |
Benchmark Period Mean (complement) [K] |
Bias [K] |
RMSE [K] |
Phase Shift [months] |
Bias Score [1] |
RMSE Score [1] |
Seasonal Cycle Score [1] |
Spatial Distribution Score [1] |
Interannual Variability Score [1] |
Overall Score [1] |
|||
|---|---|---|---|---|---|---|---|---|---|---|---|---|---|---|---|---|---|
| Benchmark | [-] | 299. | |||||||||||||||
| CRUNCEPv7 | [-] | 299. | 299. | 300. | 299. | 299. | -0.0597 | 0.717 | 0.460 | 0.654 | 0.763 | 0.936 | 0.996 | 0.939 | 0.842 | ||
| GSWP3v1 | [-] | 299. | 299. | 300. | 299. | 299. | 0.168 | 0.688 | 0.391 | 0.654 | 0.785 | 0.948 | 0.999 | 0.925 | 0.849 | ||
| WATCH | [-] | 299. | 299. | 300. | 299. | 299. | -0.190 | 1.23 | 0.797 | 0.558 | 0.484 | 0.887 | 0.997 | 0.858 | 0.711 |
Download Data |
Period Mean (original grids) [K] |
Model Period Mean (intersection) [K] |
Model Period Mean (complement) [K] |
Benchmark Period Mean (intersection) [K] |
Benchmark Period Mean (complement) [K] |
Bias [K] |
RMSE [K] |
Phase Shift [months] |
Bias Score [1] |
RMSE Score [1] |
Seasonal Cycle Score [1] |
Spatial Distribution Score [1] |
Interannual Variability Score [1] |
Overall Score [1] |
|||
|---|---|---|---|---|---|---|---|---|---|---|---|---|---|---|---|---|---|
| Benchmark | [-] | 296. | |||||||||||||||
| CRUNCEPv7 | [-] | 296. | 296. | 296. | 296. | 293. | 0.242 | 0.663 | 0.248 | 0.776 | 0.866 | 0.969 | 0.998 | 0.941 | 0.903 | ||
| GSWP3v1 | [-] | 296. | 296. | 296. | 296. | 293. | 0.383 | 0.666 | 0.220 | 0.763 | 0.880 | 0.973 | 1.00 | 0.963 | 0.910 | ||
| WATCH | [-] | 296. | 296. | 296. | 296. | 293. | -0.130 | 1.09 | 0.449 | 0.732 | 0.703 | 0.945 | 0.985 | 0.875 | 0.824 |
Download Data |
Period Mean (original grids) [K] |
Model Period Mean (intersection) [K] |
Model Period Mean (complement) [K] |
Benchmark Period Mean (intersection) [K] |
Benchmark Period Mean (complement) [K] |
Bias [K] |
RMSE [K] |
Phase Shift [months] |
Bias Score [1] |
RMSE Score [1] |
Seasonal Cycle Score [1] |
Spatial Distribution Score [1] |
Interannual Variability Score [1] |
Overall Score [1] |
|||
|---|---|---|---|---|---|---|---|---|---|---|---|---|---|---|---|---|---|
| Benchmark | [-] | 284. | |||||||||||||||
| CRUNCEPv7 | [-] | 284. | 284. | 288. | 284. | 285. | 0.0843 | 1.53 | 0.206 | 0.670 | 0.855 | 0.975 | 0.999 | 0.942 | 0.883 | ||
| GSWP3v1 | [-] | 285. | 284. | 288. | 284. | 285. | 0.483 | 1.54 | 0.183 | 0.661 | 0.862 | 0.977 | 1.00 | 0.952 | 0.886 | ||
| WATCH | [-] | 284. | 284. | 288. | 284. | 285. | 0.329 | 2.12 | 0.305 | 0.637 | 0.757 | 0.962 | 1.00 | 0.908 | 0.837 |
Temporally integrated period mean