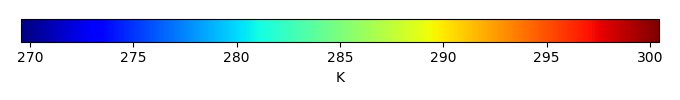
Mean State
Download Data |
Period Mean (original grids) [K] |
Bias [K] |
RMSE [K] |
Phase Shift [months] |
Bias Score [1] |
RMSE Score [1] |
Seasonal Cycle Score [1] |
Interannual Variability Score [1] |
Overall Score [1] |
|||
|---|---|---|---|---|---|---|---|---|---|---|---|---|
| Benchmark | [-] | 295. | ||||||||||
| CRUNCEPv7 | [-] | 297. | 1.12 | 1.70 | 0.508 | 0.739 | 0.678 | 0.966 | 0.866 | 0.785 | ||
| GSWP3v1 | [-] | 296. | 0.822 | 1.61 | 0.508 | 0.807 | 0.671 | 0.966 | 0.839 | 0.791 | ||
| WATCH | [-] | 293. | -1.59 | 2.67 | 1.52 | 0.607 | 0.662 | 0.843 | 0.795 | 0.713 |
Download Data |
Period Mean (original grids) [K] |
Bias [K] |
RMSE [K] |
Phase Shift [months] |
Bias Score [1] |
RMSE Score [1] |
Seasonal Cycle Score [1] |
Interannual Variability Score [1] |
Overall Score [1] |
|||
|---|---|---|---|---|---|---|---|---|---|---|---|---|
| Benchmark | [-] | 275. | ||||||||||
| CRUNCEPv7 | [-] | 259. | -16.2 | 14.4 | 0.00 | 0.118 | 0.169 | 1.00 | 0.249 | 0.341 | ||
| GSWP3v1 | [-] | 260. | -15.0 | 13.4 | 0.00 | 0.138 | 0.185 | 1.00 | 0.274 | 0.356 | ||
| WATCH | [-] | 259. | nan | nan | nan | 0.00 | nan | nan | nan | nan |
Download Data |
Period Mean (original grids) [K] |
Bias [K] |
RMSE [K] |
Phase Shift [months] |
Bias Score [1] |
RMSE Score [1] |
Seasonal Cycle Score [1] |
Interannual Variability Score [1] |
Overall Score [1] |
|||
|---|---|---|---|---|---|---|---|---|---|---|---|---|
| Benchmark | [-] | 300. | ||||||||||
| CRUNCEPv7 | [-] | 298. | -1.57 | 1.62 | 0.00 | 0.0202 | 0.321 | 1.00 | 0.987 | 0.530 | ||
| GSWP3v1 | [-] | 298. | -1.26 | 1.32 | 0.00 | 0.0435 | 0.321 | 1.00 | 0.924 | 0.522 | ||
| WATCH | [-] | 299. | nan | nan | nan | 0.00 | nan | nan | nan | nan |
Download Data |
Period Mean (original grids) [K] |
Bias [K] |
RMSE [K] |
Phase Shift [months] |
Bias Score [1] |
RMSE Score [1] |
Seasonal Cycle Score [1] |
Interannual Variability Score [1] |
Overall Score [1] |
|||
|---|---|---|---|---|---|---|---|---|---|---|---|---|
| Benchmark | [-] | 277. | ||||||||||
| CRUNCEPv7 | [-] | 272. | -4.93 | 5.99 | 0.508 | 0.674 | 0.647 | 0.966 | 0.852 | 0.757 | ||
| GSWP3v1 | [-] | 272. | -4.21 | 5.58 | 0.508 | 0.713 | 0.653 | 0.966 | 0.874 | 0.772 | ||
| WATCH | [-] | 271. | nan | nan | nan | 0.00 | nan | nan | nan | nan |
Download Data |
Period Mean (original grids) [K] |
Bias [K] |
RMSE [K] |
Phase Shift [months] |
Bias Score [1] |
RMSE Score [1] |
Seasonal Cycle Score [1] |
Interannual Variability Score [1] |
Overall Score [1] |
|||
|---|---|---|---|---|---|---|---|---|---|---|---|---|
| Benchmark | [-] | 291. | ||||||||||
| CRUNCEPv7 | [-] | 293. | 1.88 | 2.52 | 0.00 | 0.594 | 0.686 | 1.00 | 0.976 | 0.788 | ||
| GSWP3v1 | [-] | 293. | 2.26 | 2.83 | 0.00 | 0.536 | 0.689 | 1.00 | 0.982 | 0.779 | ||
| WATCH | [-] | 293. | 3.40 | 3.93 | 0.00 | 0.478 | 0.609 | 1.00 | 0.876 | 0.714 |
Download Data |
Period Mean (original grids) [K] |
Bias [K] |
RMSE [K] |
Phase Shift [months] |
Bias Score [1] |
RMSE Score [1] |
Seasonal Cycle Score [1] |
Interannual Variability Score [1] |
Overall Score [1] |
|||
|---|---|---|---|---|---|---|---|---|---|---|---|---|
| Benchmark | [-] | 283. | ||||||||||
| CRUNCEPv7 | [-] | 283. | 0.236 | 2.11 | 0.277 | 0.822 | 0.812 | 0.975 | 0.919 | 0.868 | ||
| GSWP3v1 | [-] | 283. | 0.424 | 2.09 | 0.277 | 0.825 | 0.814 | 0.975 | 0.926 | 0.871 | ||
| WATCH | [-] | 283. | -0.475 | 1.92 | 0.00 | 0.414 | 0.810 | 1.00 | 0.906 | 0.788 |
Download Data |
Period Mean (original grids) [K] |
Bias [K] |
RMSE [K] |
Phase Shift [months] |
Bias Score [1] |
RMSE Score [1] |
Seasonal Cycle Score [1] |
Interannual Variability Score [1] |
Overall Score [1] |
|||
|---|---|---|---|---|---|---|---|---|---|---|---|---|
| Benchmark | [-] | 283. | ||||||||||
| CRUNCEPv7 | [-] | 282. | -0.497 | 2.42 | 0.188 | 0.809 | 0.790 | 0.984 | 0.922 | 0.859 | ||
| GSWP3v1 | [-] | 282. | -0.178 | 2.31 | 0.198 | 0.822 | 0.794 | 0.983 | 0.930 | 0.865 | ||
| WATCH | [-] | 282. | -1.50 | 2.40 | 0.385 | 0.443 | 0.746 | 0.954 | 0.892 | 0.756 |
Download Data |
Period Mean (original grids) [K] |
Bias [K] |
RMSE [K] |
Phase Shift [months] |
Bias Score [1] |
RMSE Score [1] |
Seasonal Cycle Score [1] |
Interannual Variability Score [1] |
Overall Score [1] |
|||
|---|---|---|---|---|---|---|---|---|---|---|---|---|
| Benchmark | [-] | 292. | ||||||||||
| CRUNCEPv7 | [-] | 294. | 2.23 | 2.90 | 0.00 | 0.671 | 0.799 | 1.00 | 0.947 | 0.843 | ||
| GSWP3v1 | [-] | 294. | 1.82 | 2.46 | 1.03 | 0.722 | 0.808 | 0.930 | 0.985 | 0.851 | ||
| WATCH | [-] | 294. | 2.16 | 2.95 | 1.03 | 0.637 | 0.723 | 0.930 | 0.835 | 0.770 |
Download Data |
Period Mean (original grids) [K] |
Bias [K] |
RMSE [K] |
Phase Shift [months] |
Bias Score [1] |
RMSE Score [1] |
Seasonal Cycle Score [1] |
Interannual Variability Score [1] |
Overall Score [1] |
|||
|---|---|---|---|---|---|---|---|---|---|---|---|---|
| Benchmark | [-] | 284. | ||||||||||
| CRUNCEPv7 | [-] | 284. | -0.523 | 1.96 | 0.0984 | 0.901 | 0.821 | 0.993 | 0.934 | 0.894 | ||
| GSWP3v1 | [-] | 284. | -0.173 | 1.88 | 0.0984 | 0.910 | 0.827 | 0.993 | 0.945 | 0.901 | ||
| WATCH | [-] | 283. | -2.18 | 2.39 | 0.194 | 0.591 | 0.759 | 0.987 | 0.914 | 0.802 |
Download Data |
Period Mean (original grids) [K] |
Bias [K] |
RMSE [K] |
Phase Shift [months] |
Bias Score [1] |
RMSE Score [1] |
Seasonal Cycle Score [1] |
Interannual Variability Score [1] |
Overall Score [1] |
|||
|---|---|---|---|---|---|---|---|---|---|---|---|---|
| Benchmark | [-] | 274. | ||||||||||
| CRUNCEPv7 | [-] | 272. | -2.53 | 3.04 | 0.00 | 0.834 | 0.837 | 1.00 | 0.965 | 0.895 | ||
| GSWP3v1 | [-] | 273. | -1.72 | 2.63 | 0.00 | 0.886 | 0.842 | 1.00 | 0.981 | 0.910 | ||
| WATCH | [-] | 272. | -5.94 | 2.94 | 0.874 | 0.312 | 0.636 | 0.908 | 0.800 | 0.658 |
Download Data |
Period Mean (original grids) [K] |
Bias [K] |
RMSE [K] |
Phase Shift [months] |
Bias Score [1] |
RMSE Score [1] |
Seasonal Cycle Score [1] |
Interannual Variability Score [1] |
Overall Score [1] |
|||
|---|---|---|---|---|---|---|---|---|---|---|---|---|
| Benchmark | [-] | 286. | ||||||||||
| CRUNCEPv7 | [-] | 286. | 0.395 | 2.39 | 0.169 | 0.859 | 0.762 | 0.989 | 0.946 | 0.864 | ||
| GSWP3v1 | [-] | 287. | 0.668 | 2.41 | 0.169 | 0.847 | 0.766 | 0.989 | 0.955 | 0.865 | ||
| WATCH | [-] | 286. | -1.49 | 3.72 | 1.43 | 0.589 | 0.716 | 0.785 | 0.940 | 0.749 |
Download Data |
Period Mean (original grids) [K] |
Bias [K] |
RMSE [K] |
Phase Shift [months] |
Bias Score [1] |
RMSE Score [1] |
Seasonal Cycle Score [1] |
Interannual Variability Score [1] |
Overall Score [1] |
|||
|---|---|---|---|---|---|---|---|---|---|---|---|---|
| Benchmark | [-] | 299. | ||||||||||
| CRUNCEPv7 | [-] | 301. | 1.42 | 1.59 | 0.00 | 0.245 | 0.499 | 1.00 | 0.818 | 0.612 | ||
| GSWP3v1 | [-] | 300. | 1.22 | 1.40 | 0.00 | 0.298 | 0.489 | 1.00 | 0.764 | 0.608 | ||
| WATCH | [-] | 300. | 0.463 | 0.960 | 3.05 | 0.653 | 0.478 | 0.498 | 0.940 | 0.609 |
Temporally integrated period mean