Mean State
Download Data |
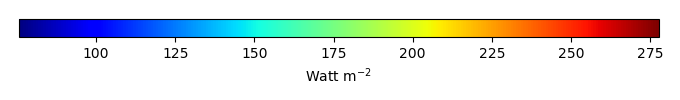
Period Mean (original grids) [Watt m-2] |
Model Period Mean (intersection) [Watt m-2] |
Model Period Mean (complement) [Watt m-2] |
Benchmark Period Mean (intersection) [Watt m-2] |
Benchmark Period Mean (complement) [Watt m-2] |
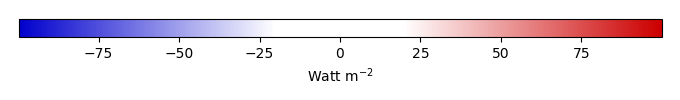
Bias [Watt m-2] |
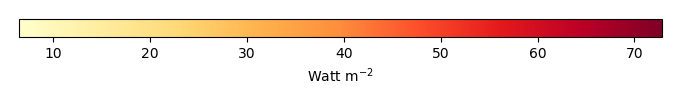
RMSE [Watt m-2] |
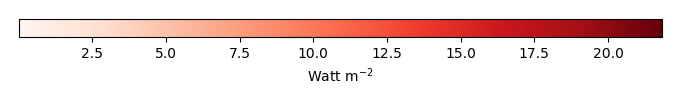
Phase Shift [months] |
Bias Score [1] |
RMSE Score [1] |
Seasonal Cycle Score [1] |
Spatial Distribution Score [1] |
Interannual Variability Score [1] |
Overall Score [1] |
|||
|---|---|---|---|---|---|---|---|---|---|---|---|---|---|---|---|---|---|
| Benchmark | [-] | 217. | |||||||||||||||
| CRUNCEPv7 | [-] | 228. | 227. | 217. | 232. | 11.0 | 22.1 | 0.909 | 0.580 | 0.471 | 0.873 | 0.992 | 0.520 | 0.651 | |||
| GSWP3v1 | [-] | 217. | 216. | 217. | 232. | 0.504 | 14.1 | 0.318 | 0.860 | 0.543 | 0.956 | 0.999 | 0.759 | 0.777 | |||
| WATCH | [-] | 167. | 166. | 217. | 232. | -49.2 | 55.1 | 1.48 | 0.195 | 0.403 | 0.772 | 0.729 | 0.790 | 0.549 |
Download Data |
Period Mean (original grids) [Watt m-2] |
Model Period Mean (intersection) [Watt m-2] |
Model Period Mean (complement) [Watt m-2] |
Benchmark Period Mean (intersection) [Watt m-2] |
Benchmark Period Mean (complement) [Watt m-2] |
Bias [Watt m-2] |
RMSE [Watt m-2] |
Phase Shift [months] |
Bias Score [1] |
RMSE Score [1] |
Seasonal Cycle Score [1] |
Spatial Distribution Score [1] |
Interannual Variability Score [1] |
Overall Score [1] |
|||
|---|---|---|---|---|---|---|---|---|---|---|---|---|---|---|---|---|---|
| Benchmark | [-] | 241. | |||||||||||||||
| CRUNCEPv7 | [-] | 245. | 245. | 241. | 238. | 4.28 | 22.8 | 0.581 | 0.648 | 0.524 | 0.951 | 0.929 | 0.663 | 0.706 | |||
| GSWP3v1 | [-] | 240. | 241. | 241. | 238. | -0.171 | 13.3 | 0.143 | 0.901 | 0.613 | 0.990 | 0.999 | 0.815 | 0.822 | |||
| WATCH | [-] | 196. | 198. | 242. | 238. | -43.3 | 49.0 | 0.502 | 0.257 | 0.484 | 0.960 | 0.585 | 0.643 | 0.569 |
Download Data |
Period Mean (original grids) [Watt m-2] |
Model Period Mean (intersection) [Watt m-2] |
Model Period Mean (complement) [Watt m-2] |
Benchmark Period Mean (intersection) [Watt m-2] |
Benchmark Period Mean (complement) [Watt m-2] |
Bias [Watt m-2] |
RMSE [Watt m-2] |
Phase Shift [months] |
Bias Score [1] |
RMSE Score [1] |
Seasonal Cycle Score [1] |
Spatial Distribution Score [1] |
Interannual Variability Score [1] |
Overall Score [1] |
|||
|---|---|---|---|---|---|---|---|---|---|---|---|---|---|---|---|---|---|
| Benchmark | [-] | 233. | |||||||||||||||
| CRUNCEPv7 | [-] | 231. | 231. | 233. | 238. | -1.27 | 21.2 | 0.855 | 0.727 | 0.552 | 0.892 | 0.906 | 0.548 | 0.696 | |||
| GSWP3v1 | [-] | 233. | 233. | 233. | 238. | 0.143 | 15.9 | 0.237 | 0.890 | 0.601 | 0.969 | 0.994 | 0.696 | 0.792 | |||
| WATCH | [-] | 213. | 213. | 233. | 238. | -19.4 | 29.2 | 0.760 | 0.521 | 0.557 | 0.904 | 0.840 | 0.714 | 0.682 |
Download Data |
Period Mean (original grids) [Watt m-2] |
Model Period Mean (intersection) [Watt m-2] |
Model Period Mean (complement) [Watt m-2] |
Benchmark Period Mean (intersection) [Watt m-2] |
Benchmark Period Mean (complement) [Watt m-2] |
Bias [Watt m-2] |
RMSE [Watt m-2] |
Phase Shift [months] |
Bias Score [1] |
RMSE Score [1] |
Seasonal Cycle Score [1] |
Spatial Distribution Score [1] |
Interannual Variability Score [1] |
Overall Score [1] |
|||
|---|---|---|---|---|---|---|---|---|---|---|---|---|---|---|---|---|---|
| Benchmark | [-] | 111. | |||||||||||||||
| CRUNCEPv7 | [-] | 112. | 112. | 111. | 117. | 0.518 | 16.3 | 0.0404 | 0.936 | 0.826 | 0.997 | 0.992 | 0.507 | 0.847 | |||
| GSWP3v1 | [-] | 107. | 107. | 111. | 117. | -3.90 | 12.6 | 0.0241 | 0.948 | 0.850 | 0.998 | 0.896 | 0.691 | 0.872 | |||
| WATCH | [-] | 99.0 | 99.0 | 112. | 119. | -12.3 | 20.0 | 0.403 | 0.868 | 0.807 | 0.973 | 0.980 | 0.692 | 0.855 |
Download Data |
Period Mean (original grids) [Watt m-2] |
Model Period Mean (intersection) [Watt m-2] |
Model Period Mean (complement) [Watt m-2] |
Benchmark Period Mean (intersection) [Watt m-2] |
Benchmark Period Mean (complement) [Watt m-2] |
Bias [Watt m-2] |
RMSE [Watt m-2] |
Phase Shift [months] |
Bias Score [1] |
RMSE Score [1] |
Seasonal Cycle Score [1] |
Spatial Distribution Score [1] |
Interannual Variability Score [1] |
Overall Score [1] |
|||
|---|---|---|---|---|---|---|---|---|---|---|---|---|---|---|---|---|---|
| Benchmark | [-] | 213. | |||||||||||||||
| CRUNCEPv7 | [-] | 216. | 215. | 209. | 225. | 9.33 | 24.3 | 1.51 | 0.558 | 0.429 | 0.778 | 0.905 | 0.494 | 0.599 | |||
| GSWP3v1 | [-] | 205. | 205. | 209. | 225. | 0.417 | 17.6 | 0.524 | 0.789 | 0.464 | 0.924 | 0.989 | 0.769 | 0.733 | |||
| WATCH | [-] | 164. | 164. | 210. | 226. | -36.5 | 44.0 | 1.40 | 0.298 | 0.377 | 0.788 | 0.594 | 0.757 | 0.532 |
Download Data |
Period Mean (original grids) [Watt m-2] |
Model Period Mean (intersection) [Watt m-2] |
Model Period Mean (complement) [Watt m-2] |
Benchmark Period Mean (intersection) [Watt m-2] |
Benchmark Period Mean (complement) [Watt m-2] |
Bias [Watt m-2] |
RMSE [Watt m-2] |
Phase Shift [months] |
Bias Score [1] |
RMSE Score [1] |
Seasonal Cycle Score [1] |
Spatial Distribution Score [1] |
Interannual Variability Score [1] |
Overall Score [1] |
|||
|---|---|---|---|---|---|---|---|---|---|---|---|---|---|---|---|---|---|
| Benchmark | [-] | 126. | |||||||||||||||
| CRUNCEPv7 | [-] | 134. | 134. | 126. | 145. | 7.98 | 18.7 | 0.157 | 0.891 | 0.817 | 0.989 | 0.996 | 0.577 | 0.848 | |||
| GSWP3v1 | [-] | 126. | 126. | 126. | 145. | 0.0721 | 11.8 | 0.0425 | 0.982 | 0.860 | 0.997 | 1.00 | 0.637 | 0.889 | |||
| WATCH | [-] | 109. | 109. | 127. | 146. | -17.4 | 22.9 | 0.308 | 0.805 | 0.833 | 0.980 | 0.948 | 0.673 | 0.845 |
Download Data |
Period Mean (original grids) [Watt m-2] |
Model Period Mean (intersection) [Watt m-2] |
Model Period Mean (complement) [Watt m-2] |
Benchmark Period Mean (intersection) [Watt m-2] |
Benchmark Period Mean (complement) [Watt m-2] |
Bias [Watt m-2] |
RMSE [Watt m-2] |
Phase Shift [months] |
Bias Score [1] |
RMSE Score [1] |
Seasonal Cycle Score [1] |
Spatial Distribution Score [1] |
Interannual Variability Score [1] |
Overall Score [1] |
|||
|---|---|---|---|---|---|---|---|---|---|---|---|---|---|---|---|---|---|
| Benchmark | [-] | 170. | |||||||||||||||
| CRUNCEPv7 | [-] | 188. | 187. | 170. | 169. | 16.8 | 27.8 | 0.502 | 0.723 | 0.736 | 0.959 | 0.893 | 0.618 | 0.777 | |||
| GSWP3v1 | [-] | 171. | 171. | 170. | 169. | 0.441 | 14.1 | 0.129 | 0.949 | 0.787 | 0.988 | 0.999 | 0.620 | 0.855 | |||
| WATCH | [-] | 168. | 167. | 171. | 170. | -3.90 | 22.1 | 0.435 | 0.833 | 0.735 | 0.956 | 0.953 | 0.685 | 0.816 |
Download Data |
Period Mean (original grids) [Watt m-2] |
Model Period Mean (intersection) [Watt m-2] |
Model Period Mean (complement) [Watt m-2] |
Benchmark Period Mean (intersection) [Watt m-2] |
Benchmark Period Mean (complement) [Watt m-2] |
Bias [Watt m-2] |
RMSE [Watt m-2] |
Phase Shift [months] |
Bias Score [1] |
RMSE Score [1] |
Seasonal Cycle Score [1] |
Spatial Distribution Score [1] |
Interannual Variability Score [1] |
Overall Score [1] |
|||
|---|---|---|---|---|---|---|---|---|---|---|---|---|---|---|---|---|---|
| Benchmark | [-] | 210. | |||||||||||||||
| CRUNCEPv7 | [-] | 231. | 231. | 209. | 224. | 21.5 | 32.3 | 0.302 | 0.561 | 0.586 | 0.978 | 0.990 | 0.539 | 0.707 | |||
| GSWP3v1 | [-] | 208. | 208. | 209. | 224. | 0.482 | 16.5 | 0.148 | 0.894 | 0.657 | 0.990 | 0.991 | 0.664 | 0.809 | |||
| WATCH | [-] | 190. | 190. | 208. | 224. | -17.8 | 32.3 | 0.434 | 0.590 | 0.572 | 0.967 | 0.703 | 0.694 | 0.683 |
Download Data |
Period Mean (original grids) [Watt m-2] |
Model Period Mean (intersection) [Watt m-2] |
Model Period Mean (complement) [Watt m-2] |
Benchmark Period Mean (intersection) [Watt m-2] |
Benchmark Period Mean (complement) [Watt m-2] |
Bias [Watt m-2] |
RMSE [Watt m-2] |
Phase Shift [months] |
Bias Score [1] |
RMSE Score [1] |
Seasonal Cycle Score [1] |
Spatial Distribution Score [1] |
Interannual Variability Score [1] |
Overall Score [1] |
|||
|---|---|---|---|---|---|---|---|---|---|---|---|---|---|---|---|---|---|
| Benchmark | [-] | 105. | |||||||||||||||
| CRUNCEPv7 | [-] | 103. | 104. | 105. | 108. | -1.87 | 18.0 | 0.284 | 0.918 | 0.796 | 0.981 | 0.901 | 0.517 | 0.818 | |||
| GSWP3v1 | [-] | 96.3 | 96.5 | 105. | 108. | -8.76 | 12.5 | 0.0632 | 0.901 | 0.827 | 0.996 | 0.798 | 0.644 | 0.832 | |||
| WATCH | [-] | 82.2 | 82.4 | 106. | 109. | -23.2 | 23.7 | 0.277 | 0.766 | 0.792 | 0.978 | 0.991 | 0.651 | 0.828 |
Download Data |
Period Mean (original grids) [Watt m-2] |
Model Period Mean (intersection) [Watt m-2] |
Model Period Mean (complement) [Watt m-2] |
Benchmark Period Mean (intersection) [Watt m-2] |
Benchmark Period Mean (complement) [Watt m-2] |
Bias [Watt m-2] |
RMSE [Watt m-2] |
Phase Shift [months] |
Bias Score [1] |
RMSE Score [1] |
Seasonal Cycle Score [1] |
Spatial Distribution Score [1] |
Interannual Variability Score [1] |
Overall Score [1] |
|||
|---|---|---|---|---|---|---|---|---|---|---|---|---|---|---|---|---|---|
| Benchmark | [-] | 228. | |||||||||||||||
| CRUNCEPv7 | [-] | 235. | 235. | 229. | 216. | 2.90 | 18.7 | 0.429 | 0.877 | 0.736 | 0.971 | 0.970 | 0.654 | 0.824 | |||
| GSWP3v1 | [-] | 232. | 232. | 229. | 216. | 0.0913 | 15.0 | 0.0879 | 0.946 | 0.762 | 0.993 | 1.00 | 0.677 | 0.857 | |||
| WATCH | [-] | 237. | 237. | 230. | 216. | 4.05 | 19.3 | 0.330 | 0.845 | 0.743 | 0.970 | 0.992 | 0.860 | 0.859 |
Download Data |
Period Mean (original grids) [Watt m-2] |
Model Period Mean (intersection) [Watt m-2] |
Model Period Mean (complement) [Watt m-2] |
Benchmark Period Mean (intersection) [Watt m-2] |
Benchmark Period Mean (complement) [Watt m-2] |
Bias [Watt m-2] |
RMSE [Watt m-2] |
Phase Shift [months] |
Bias Score [1] |
RMSE Score [1] |
Seasonal Cycle Score [1] |
Spatial Distribution Score [1] |
Interannual Variability Score [1] |
Overall Score [1] |
|||
|---|---|---|---|---|---|---|---|---|---|---|---|---|---|---|---|---|---|
| Benchmark | [-] | 140. | |||||||||||||||
| CRUNCEPv7 | [-] | 158. | 158. | 138. | 161. | 20.2 | 28.5 | 0.194 | 0.752 | 0.799 | 0.987 | 0.997 | 0.642 | 0.829 | |||
| GSWP3v1 | [-] | 135. | 135. | 138. | 161. | 0.0454 | 13.3 | 0.0808 | 0.952 | 0.846 | 0.994 | 0.998 | 0.641 | 0.880 | |||
| WATCH | [-] | 115. | 115. | 138. | 161. | -19.7 | 24.4 | 0.243 | 0.776 | 0.838 | 0.981 | 0.994 | 0.701 | 0.855 |
Download Data |
Period Mean (original grids) [Watt m-2] |
Model Period Mean (intersection) [Watt m-2] |
Model Period Mean (complement) [Watt m-2] |
Benchmark Period Mean (intersection) [Watt m-2] |
Benchmark Period Mean (complement) [Watt m-2] |
Bias [Watt m-2] |
RMSE [Watt m-2] |
Phase Shift [months] |
Bias Score [1] |
RMSE Score [1] |
Seasonal Cycle Score [1] |
Spatial Distribution Score [1] |
Interannual Variability Score [1] |
Overall Score [1] |
|||
|---|---|---|---|---|---|---|---|---|---|---|---|---|---|---|---|---|---|
| Benchmark | [-] | 191. | |||||||||||||||
| CRUNCEPv7 | [-] | 191. | 191. | 186. | 193. | 4.01 | 23.2 | 0.455 | 0.761 | 0.685 | 0.952 | 0.984 | 0.544 | 0.769 | |||
| GSWP3v1 | [-] | 182. | 182. | 186. | 193. | -4.43 | 14.4 | 0.132 | 0.905 | 0.731 | 0.986 | 0.986 | 0.662 | 0.833 | |||
| WATCH | [-] | 168. | 168. | 186. | 194. | -18.0 | 26.4 | 0.454 | 0.687 | 0.686 | 0.950 | 0.987 | 0.693 | 0.782 |
Download Data |
Period Mean (original grids) [Watt m-2] |
Model Period Mean (intersection) [Watt m-2] |
Model Period Mean (complement) [Watt m-2] |
Benchmark Period Mean (intersection) [Watt m-2] |
Benchmark Period Mean (complement) [Watt m-2] |
Bias [Watt m-2] |
RMSE [Watt m-2] |
Phase Shift [months] |
Bias Score [1] |
RMSE Score [1] |
Seasonal Cycle Score [1] |
Spatial Distribution Score [1] |
Interannual Variability Score [1] |
Overall Score [1] |
|||
|---|---|---|---|---|---|---|---|---|---|---|---|---|---|---|---|---|---|
| Benchmark | [-] | 240. | |||||||||||||||
| CRUNCEPv7 | [-] | 249. | 249. | 240. | 241. | 8.59 | 22.4 | 0.367 | 0.809 | 0.736 | 0.970 | 0.991 | 0.613 | 0.809 | |||
| GSWP3v1 | [-] | 240. | 240. | 240. | 241. | -0.0717 | 13.2 | 0.119 | 0.941 | 0.795 | 0.991 | 0.999 | 0.617 | 0.856 | |||
| WATCH | [-] | 218. | 217. | 239. | 240. | -21.8 | 28.4 | 0.334 | 0.684 | 0.762 | 0.973 | 0.999 | 0.571 | 0.792 |
Download Data |
Period Mean (original grids) [Watt m-2] |
Model Period Mean (intersection) [Watt m-2] |
Model Period Mean (complement) [Watt m-2] |
Benchmark Period Mean (intersection) [Watt m-2] |
Benchmark Period Mean (complement) [Watt m-2] |
Bias [Watt m-2] |
RMSE [Watt m-2] |
Phase Shift [months] |
Bias Score [1] |
RMSE Score [1] |
Seasonal Cycle Score [1] |
Spatial Distribution Score [1] |
Interannual Variability Score [1] |
Overall Score [1] |
|||
|---|---|---|---|---|---|---|---|---|---|---|---|---|---|---|---|---|---|
| Benchmark | [-] | 113. | |||||||||||||||
| CRUNCEPv7 | [-] | 117. | 117. | 113. | 116. | 3.88 | 18.4 | 0.110 | 0.894 | 0.817 | 0.993 | 0.794 | 0.480 | 0.799 | |||
| GSWP3v1 | [-] | 108. | 108. | 113. | 116. | -5.10 | 12.3 | 0.0429 | 0.936 | 0.846 | 0.997 | 0.848 | 0.716 | 0.865 | |||
| WATCH | [-] | 105. | 105. | 113. | 117. | -8.38 | 19.2 | 0.157 | 0.893 | 0.801 | 0.990 | 0.862 | 0.713 | 0.843 |
Download Data |
Period Mean (original grids) [Watt m-2] |
Model Period Mean (intersection) [Watt m-2] |
Model Period Mean (complement) [Watt m-2] |
Benchmark Period Mean (intersection) [Watt m-2] |
Benchmark Period Mean (complement) [Watt m-2] |
Bias [Watt m-2] |
RMSE [Watt m-2] |
Phase Shift [months] |
Bias Score [1] |
RMSE Score [1] |
Seasonal Cycle Score [1] |
Spatial Distribution Score [1] |
Interannual Variability Score [1] |
Overall Score [1] |
|||
|---|---|---|---|---|---|---|---|---|---|---|---|---|---|---|---|---|---|
| Benchmark | [-] | 229. | |||||||||||||||
| CRUNCEPv7 | [-] | 223. | 223. | 227. | 241. | -2.57 | 26.4 | 0.757 | 0.668 | 0.630 | 0.924 | 0.704 | 0.567 | 0.687 | |||
| GSWP3v1 | [-] | 226. | 226. | 227. | 241. | 0.355 | 16.5 | 0.210 | 0.851 | 0.683 | 0.979 | 0.989 | 0.692 | 0.813 | |||
| WATCH | [-] | 213. | 213. | 226. | 241. | -12.8 | 30.6 | 0.532 | 0.601 | 0.632 | 0.945 | 0.755 | 0.755 | 0.720 |
Download Data |
Period Mean (original grids) [Watt m-2] |
Model Period Mean (intersection) [Watt m-2] |
Model Period Mean (complement) [Watt m-2] |
Benchmark Period Mean (intersection) [Watt m-2] |
Benchmark Period Mean (complement) [Watt m-2] |
Bias [Watt m-2] |
RMSE [Watt m-2] |
Phase Shift [months] |
Bias Score [1] |
RMSE Score [1] |
Seasonal Cycle Score [1] |
Spatial Distribution Score [1] |
Interannual Variability Score [1] |
Overall Score [1] |
|||
|---|---|---|---|---|---|---|---|---|---|---|---|---|---|---|---|---|---|
| Benchmark | [-] | 173. | |||||||||||||||
| CRUNCEPv7 | [-] | 186. | 186. | 172. | 207. | 15.1 | 22.2 | 0.367 | 0.775 | 0.784 | 0.976 | 0.984 | 0.503 | 0.801 | |||
| GSWP3v1 | [-] | 171. | 171. | 172. | 207. | 0.686 | 13.8 | 0.0926 | 0.964 | 0.804 | 0.994 | 1.00 | 0.633 | 0.866 | |||
| WATCH | [-] | 176. | 175. | 171. | 206. | 4.61 | 15.2 | 0.295 | 0.899 | 0.810 | 0.980 | 0.998 | 0.764 | 0.877 |
Download Data |
Period Mean (original grids) [Watt m-2] |
Model Period Mean (intersection) [Watt m-2] |
Model Period Mean (complement) [Watt m-2] |
Benchmark Period Mean (intersection) [Watt m-2] |
Benchmark Period Mean (complement) [Watt m-2] |
Bias [Watt m-2] |
RMSE [Watt m-2] |
Phase Shift [months] |
Bias Score [1] |
RMSE Score [1] |
Seasonal Cycle Score [1] |
Spatial Distribution Score [1] |
Interannual Variability Score [1] |
Overall Score [1] |
|||
|---|---|---|---|---|---|---|---|---|---|---|---|---|---|---|---|---|---|
| Benchmark | [-] | 135. | |||||||||||||||
| CRUNCEPv7 | [-] | 149. | 149. | 135. | 133. | 13.8 | 20.4 | 0.186 | 0.830 | 0.825 | 0.988 | 0.959 | 0.544 | 0.829 | |||
| GSWP3v1 | [-] | 135. | 135. | 135. | 133. | 0.0758 | 11.1 | 0.0540 | 0.980 | 0.864 | 0.996 | 1.00 | 0.654 | 0.893 | |||
| WATCH | [-] | 132. | 132. | 135. | 133. | -3.24 | 13.9 | 0.230 | 0.926 | 0.854 | 0.983 | 0.883 | 0.776 | 0.879 |
Download Data |
Period Mean (original grids) [Watt m-2] |
Model Period Mean (intersection) [Watt m-2] |
Model Period Mean (complement) [Watt m-2] |
Benchmark Period Mean (intersection) [Watt m-2] |
Benchmark Period Mean (complement) [Watt m-2] |
Bias [Watt m-2] |
RMSE [Watt m-2] |
Phase Shift [months] |
Bias Score [1] |
RMSE Score [1] |
Seasonal Cycle Score [1] |
Spatial Distribution Score [1] |
Interannual Variability Score [1] |
Overall Score [1] |
|||
|---|---|---|---|---|---|---|---|---|---|---|---|---|---|---|---|---|---|
| Benchmark | [-] | 193. | |||||||||||||||
| CRUNCEPv7 | [-] | 191. | 191. | 193. | 181. | -1.86 | 16.9 | 0.233 | 0.923 | 0.814 | 0.984 | 0.975 | 0.545 | 0.843 | |||
| GSWP3v1 | [-] | 193. | 193. | 193. | 181. | -0.0247 | 13.4 | 0.0748 | 0.969 | 0.838 | 0.995 | 1.00 | 0.647 | 0.881 | |||
| WATCH | [-] | 201. | 201. | 192. | 181. | 8.48 | 18.7 | 0.216 | 0.868 | 0.818 | 0.986 | 0.954 | 0.812 | 0.876 |
Download Data |
Period Mean (original grids) [Watt m-2] |
Model Period Mean (intersection) [Watt m-2] |
Model Period Mean (complement) [Watt m-2] |
Benchmark Period Mean (intersection) [Watt m-2] |
Benchmark Period Mean (complement) [Watt m-2] |
Bias [Watt m-2] |
RMSE [Watt m-2] |
Phase Shift [months] |
Bias Score [1] |
RMSE Score [1] |
Seasonal Cycle Score [1] |
Spatial Distribution Score [1] |
Interannual Variability Score [1] |
Overall Score [1] |
|||
|---|---|---|---|---|---|---|---|---|---|---|---|---|---|---|---|---|---|
| Benchmark | [-] | 202. | |||||||||||||||
| CRUNCEPv7 | [-] | 211. | 211. | 201. | 241. | 10.1 | 21.6 | 1.24 | 0.608 | 0.461 | 0.829 | 0.909 | 0.514 | 0.630 | |||
| GSWP3v1 | [-] | 201. | 201. | 201. | 241. | 0.303 | 15.0 | 0.334 | 0.865 | 0.504 | 0.955 | 0.995 | 0.752 | 0.762 | |||
| WATCH | [-] | 176. | 176. | 201. | 240. | -24.7 | 35.8 | 1.33 | 0.385 | 0.384 | 0.818 | 0.876 | 0.764 | 0.602 |
Download Data |
Period Mean (original grids) [Watt m-2] |
Model Period Mean (intersection) [Watt m-2] |
Model Period Mean (complement) [Watt m-2] |
Benchmark Period Mean (intersection) [Watt m-2] |
Benchmark Period Mean (complement) [Watt m-2] |
Bias [Watt m-2] |
RMSE [Watt m-2] |
Phase Shift [months] |
Bias Score [1] |
RMSE Score [1] |
Seasonal Cycle Score [1] |
Spatial Distribution Score [1] |
Interannual Variability Score [1] |
Overall Score [1] |
|||
|---|---|---|---|---|---|---|---|---|---|---|---|---|---|---|---|---|---|
| Benchmark | [-] | 211. | |||||||||||||||
| CRUNCEPv7 | [-] | 217. | 217. | 211. | 216. | 5.51 | 23.6 | 0.836 | 0.770 | 0.584 | 0.903 | 0.840 | 0.488 | 0.695 | |||
| GSWP3v1 | [-] | 212. | 212. | 211. | 216. | 0.782 | 17.8 | 0.173 | 0.918 | 0.624 | 0.980 | 0.996 | 0.673 | 0.802 | |||
| WATCH | [-] | 189. | 189. | 210. | 215. | -21.1 | 30.4 | 0.511 | 0.569 | 0.591 | 0.937 | 0.987 | 0.761 | 0.739 |
Download Data |
Period Mean (original grids) [Watt m-2] |
Model Period Mean (intersection) [Watt m-2] |
Model Period Mean (complement) [Watt m-2] |
Benchmark Period Mean (intersection) [Watt m-2] |
Benchmark Period Mean (complement) [Watt m-2] |
Bias [Watt m-2] |
RMSE [Watt m-2] |
Phase Shift [months] |
Bias Score [1] |
RMSE Score [1] |
Seasonal Cycle Score [1] |
Spatial Distribution Score [1] |
Interannual Variability Score [1] |
Overall Score [1] |
|||
|---|---|---|---|---|---|---|---|---|---|---|---|---|---|---|---|---|---|
| Benchmark | [-] | 204. | |||||||||||||||
| CRUNCEPv7 | [-] | 210. | 209. | 205. | 190. | 1.38 | 32.0 | 0.437 | 0.698 | 0.686 | 0.956 | 0.764 | 0.522 | 0.719 | |||
| GSWP3v1 | [-] | 210. | 208. | 205. | 190. | -0.797 | 19.6 | 0.252 | 0.880 | 0.725 | 0.974 | 0.999 | 0.643 | 0.825 | |||
| WATCH | [-] | 207. | 207. | 205. | 191. | -1.60 | 29.8 | 0.580 | 0.750 | 0.686 | 0.939 | 0.995 | 0.637 | 0.782 |
Temporally integrated period mean