Mean State
Download Data |
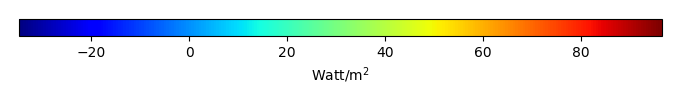
Period Mean (original grids) [Watt/m2] |
Model Period Mean (intersection) [Watt/m2] |
Model Period Mean (complement) [Watt/m2] |
Benchmark Period Mean (intersection) [Watt/m2] |
Benchmark Period Mean (complement) [Watt/m2] |
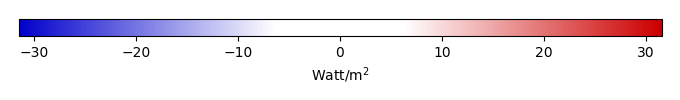
Bias [Watt/m2] |
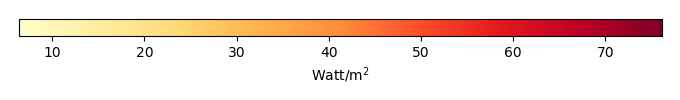
RMSE [Watt/m2] |
Phase Shift [months] |
Bias Score [1] |
RMSE Score [1] |
Seasonal Cycle Score [1] |
Spatial Distribution Score [1] |
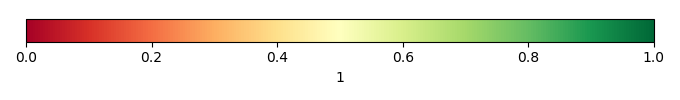
Overall Score [1] |
|||
|---|---|---|---|---|---|---|---|---|---|---|---|---|---|---|---|---|
| Benchmark | [-] | 44.1 | ||||||||||||||
| CRUNCEPv7 | [-] | 51.8 | 51.1 | 64.4 | 44.2 | 12.4 | 7.31 | 18.6 | 1.46 | 0.414 | 0.241 | 0.789 | 0.761 | 0.489 | ||
| GSWP3v1 | [-] | 45.4 | 45.0 | 52.0 | 44.2 | 12.4 | 1.09 | 14.3 | 1.87 | 0.481 | 0.266 | 0.698 | 0.950 | 0.532 | ||
| WATCH | [-] | 36.0 | 35.3 | 39.8 | 44.3 | 12.5 | -8.74 | 18.0 | 1.90 | 0.252 | 0.266 | 0.677 | 0.939 | 0.480 |
Download Data |
Period Mean (original grids) [Watt/m2] |
Model Period Mean (intersection) [Watt/m2] |
Model Period Mean (complement) [Watt/m2] |
Benchmark Period Mean (intersection) [Watt/m2] |
Benchmark Period Mean (complement) [Watt/m2] |
Bias [Watt/m2] |
RMSE [Watt/m2] |
Phase Shift [months] |
Bias Score [1] |
RMSE Score [1] |
Seasonal Cycle Score [1] |
Spatial Distribution Score [1] |
Overall Score [1] |
|||
|---|---|---|---|---|---|---|---|---|---|---|---|---|---|---|---|---|
| Benchmark | [-] | 57.5 | ||||||||||||||
| CRUNCEPv7 | [-] | 59.0 | 59.1 | 89.7 | 57.5 | 20.8 | 1.68 | 21.6 | 1.33 | 0.533 | 0.362 | 0.846 | 0.970 | 0.615 | ||
| GSWP3v1 | [-] | 50.8 | 50.9 | 67.0 | 57.5 | 20.8 | -6.70 | 20.0 | 0.772 | 0.447 | 0.430 | 0.936 | 0.843 | 0.617 | ||
| WATCH | [-] | 38.2 | 38.5 | 63.7 | 57.7 | 20.6 | -19.0 | 27.8 | 1.29 | 0.253 | 0.399 | 0.864 | 0.964 | 0.576 |
Download Data |
Period Mean (original grids) [Watt/m2] |
Model Period Mean (intersection) [Watt/m2] |
Model Period Mean (complement) [Watt/m2] |
Benchmark Period Mean (intersection) [Watt/m2] |
Benchmark Period Mean (complement) [Watt/m2] |
Bias [Watt/m2] |
RMSE [Watt/m2] |
Phase Shift [months] |
Bias Score [1] |
RMSE Score [1] |
Seasonal Cycle Score [1] |
Spatial Distribution Score [1] |
Overall Score [1] |
|||
|---|---|---|---|---|---|---|---|---|---|---|---|---|---|---|---|---|
| Benchmark | [-] | 52.8 | ||||||||||||||
| CRUNCEPv7 | [-] | 58.2 | 57.9 | 66.6 | 53.0 | 19.6 | 5.27 | 19.2 | 0.627 | 0.556 | 0.465 | 0.942 | 0.935 | 0.673 | ||
| GSWP3v1 | [-] | 56.3 | 56.1 | 61.4 | 53.0 | 19.6 | 3.43 | 17.7 | 0.747 | 0.576 | 0.490 | 0.915 | 0.971 | 0.688 | ||
| WATCH | [-] | 55.7 | 55.8 | 55.1 | 53.0 | 19.5 | 2.84 | 17.0 | 0.667 | 0.601 | 0.499 | 0.935 | 0.896 | 0.686 |
Download Data |
Period Mean (original grids) [Watt/m2] |
Model Period Mean (intersection) [Watt/m2] |
Model Period Mean (complement) [Watt/m2] |
Benchmark Period Mean (intersection) [Watt/m2] |
Benchmark Period Mean (complement) [Watt/m2] |
Bias [Watt/m2] |
RMSE [Watt/m2] |
Phase Shift [months] |
Bias Score [1] |
RMSE Score [1] |
Seasonal Cycle Score [1] |
Spatial Distribution Score [1] |
Overall Score [1] |
|||
|---|---|---|---|---|---|---|---|---|---|---|---|---|---|---|---|---|
| Benchmark | [-] | 18.0 | ||||||||||||||
| CRUNCEPv7 | [-] | -0.719 | -0.431 | -5.58 | 18.1 | 5.64 | -18.8 | 25.0 | 0.610 | 0.465 | 0.552 | 0.949 | 0.525 | 0.609 | ||
| GSWP3v1 | [-] | 15.6 | 16.0 | 7.19 | 18.1 | 5.64 | -2.63 | 19.1 | 0.548 | 0.786 | 0.515 | 0.959 | 0.930 | 0.741 | ||
| WATCH | [-] | 7.12 | 7.26 | 5.58 | 18.2 | 5.67 | -10.9 | 20.1 | 0.494 | 0.626 | 0.545 | 0.965 | 0.857 | 0.707 |
Download Data |
Period Mean (original grids) [Watt/m2] |
Model Period Mean (intersection) [Watt/m2] |
Model Period Mean (complement) [Watt/m2] |
Benchmark Period Mean (intersection) [Watt/m2] |
Benchmark Period Mean (complement) [Watt/m2] |
Bias [Watt/m2] |
RMSE [Watt/m2] |
Phase Shift [months] |
Bias Score [1] |
RMSE Score [1] |
Seasonal Cycle Score [1] |
Spatial Distribution Score [1] |
Overall Score [1] |
|||
|---|---|---|---|---|---|---|---|---|---|---|---|---|---|---|---|---|
| Benchmark | [-] | 22.1 | ||||||||||||||
| CRUNCEPv7 | [-] | 29.9 | 28.6 | 36.4 | 22.8 | 10.8 | 8.44 | 22.3 | 1.78 | 0.135 | 0.144 | 0.730 | 0.415 | 0.314 | ||
| GSWP3v1 | [-] | 32.3 | 31.3 | 36.9 | 22.8 | 10.8 | 10.5 | 16.4 | 1.34 | 0.305 | 0.199 | 0.799 | 0.866 | 0.474 | ||
| WATCH | [-] | 27.4 | 27.1 | 28.8 | 22.8 | 10.8 | 5.04 | 14.1 | 1.78 | 0.351 | 0.159 | 0.725 | 0.938 | 0.466 |
Download Data |
Period Mean (original grids) [Watt/m2] |
Model Period Mean (intersection) [Watt/m2] |
Model Period Mean (complement) [Watt/m2] |
Benchmark Period Mean (intersection) [Watt/m2] |
Benchmark Period Mean (complement) [Watt/m2] |
Bias [Watt/m2] |
RMSE [Watt/m2] |
Phase Shift [months] |
Bias Score [1] |
RMSE Score [1] |
Seasonal Cycle Score [1] |
Spatial Distribution Score [1] |
Overall Score [1] |
|||
|---|---|---|---|---|---|---|---|---|---|---|---|---|---|---|---|---|
| Benchmark | [-] | 27.0 | ||||||||||||||
| CRUNCEPv7 | [-] | 10.9 | 10.9 | 15.3 | 27.1 | 8.81 | -16.1 | 22.4 | 0.994 | 0.536 | 0.579 | 0.899 | 0.878 | 0.694 | ||
| GSWP3v1 | [-] | 20.6 | 20.5 | 27.0 | 27.1 | 8.81 | -6.35 | 15.9 | 0.553 | 0.733 | 0.601 | 0.949 | 0.935 | 0.764 | ||
| WATCH | [-] | 14.9 | 14.8 | 22.0 | 27.1 | 8.84 | -12.1 | 19.6 | 0.584 | 0.605 | 0.571 | 0.955 | 0.959 | 0.732 |
Download Data |
Period Mean (original grids) [Watt/m2] |
Model Period Mean (intersection) [Watt/m2] |
Model Period Mean (complement) [Watt/m2] |
Benchmark Period Mean (intersection) [Watt/m2] |
Benchmark Period Mean (complement) [Watt/m2] |
Bias [Watt/m2] |
RMSE [Watt/m2] |
Phase Shift [months] |
Bias Score [1] |
RMSE Score [1] |
Seasonal Cycle Score [1] |
Spatial Distribution Score [1] |
Overall Score [1] |
|||
|---|---|---|---|---|---|---|---|---|---|---|---|---|---|---|---|---|
| Benchmark | [-] | 28.4 | ||||||||||||||
| CRUNCEPv7 | [-] | 35.2 | 34.7 | 40.6 | 28.4 | 24.4 | 6.23 | 20.7 | 1.05 | 0.669 | 0.468 | 0.871 | 0.920 | 0.679 | ||
| GSWP3v1 | [-] | 35.5 | 35.2 | 39.6 | 28.4 | 24.4 | 6.80 | 19.3 | 0.795 | 0.664 | 0.515 | 0.920 | 0.937 | 0.710 | ||
| WATCH | [-] | 33.6 | 32.9 | 42.4 | 28.4 | 24.5 | 4.45 | 20.4 | 0.971 | 0.632 | 0.488 | 0.888 | 0.925 | 0.684 |
Download Data |
Period Mean (original grids) [Watt/m2] |
Model Period Mean (intersection) [Watt/m2] |
Model Period Mean (complement) [Watt/m2] |
Benchmark Period Mean (intersection) [Watt/m2] |
Benchmark Period Mean (complement) [Watt/m2] |
Bias [Watt/m2] |
RMSE [Watt/m2] |
Phase Shift [months] |
Bias Score [1] |
RMSE Score [1] |
Seasonal Cycle Score [1] |
Spatial Distribution Score [1] |
Overall Score [1] |
|||
|---|---|---|---|---|---|---|---|---|---|---|---|---|---|---|---|---|
| Benchmark | [-] | 40.3 | ||||||||||||||
| CRUNCEPv7 | [-] | 52.0 | 52.0 | 56.2 | 40.6 | 11.0 | 10.9 | 23.0 | 0.686 | 0.541 | 0.425 | 0.938 | 0.939 | 0.653 | ||
| GSWP3v1 | [-] | 37.6 | 37.1 | 42.1 | 40.6 | 11.0 | -3.33 | 20.5 | 0.882 | 0.499 | 0.461 | 0.910 | 0.879 | 0.642 | ||
| WATCH | [-] | 35.4 | 35.3 | 38.4 | 40.7 | 11.1 | -5.58 | 19.0 | 0.855 | 0.532 | 0.467 | 0.918 | 0.903 | 0.657 |
Download Data |
Period Mean (original grids) [Watt/m2] |
Model Period Mean (intersection) [Watt/m2] |
Model Period Mean (complement) [Watt/m2] |
Benchmark Period Mean (intersection) [Watt/m2] |
Benchmark Period Mean (complement) [Watt/m2] |
Bias [Watt/m2] |
RMSE [Watt/m2] |
Phase Shift [months] |
Bias Score [1] |
RMSE Score [1] |
Seasonal Cycle Score [1] |
Spatial Distribution Score [1] |
Overall Score [1] |
|||
|---|---|---|---|---|---|---|---|---|---|---|---|---|---|---|---|---|
| Benchmark | [-] | 15.2 | ||||||||||||||
| CRUNCEPv7 | [-] | -9.16 | -8.77 | -15.8 | 15.2 | 3.78 | -24.2 | 28.4 | 0.787 | 0.376 | 0.568 | 0.942 | 0.203 | 0.531 | ||
| GSWP3v1 | [-] | 4.37 | 4.77 | -2.26 | 15.2 | 3.78 | -10.7 | 22.1 | 0.816 | 0.642 | 0.486 | 0.933 | 0.847 | 0.679 | ||
| WATCH | [-] | -0.608 | -0.376 | -3.94 | 15.3 | 3.83 | -15.8 | 23.6 | 0.842 | 0.513 | 0.503 | 0.935 | 0.461 | 0.583 |
Download Data |
Period Mean (original grids) [Watt/m2] |
Model Period Mean (intersection) [Watt/m2] |
Model Period Mean (complement) [Watt/m2] |
Benchmark Period Mean (intersection) [Watt/m2] |
Benchmark Period Mean (complement) [Watt/m2] |
Bias [Watt/m2] |
RMSE [Watt/m2] |
Phase Shift [months] |
Bias Score [1] |
RMSE Score [1] |
Seasonal Cycle Score [1] |
Spatial Distribution Score [1] |
Overall Score [1] |
|||
|---|---|---|---|---|---|---|---|---|---|---|---|---|---|---|---|---|
| Benchmark | [-] | 56.5 | ||||||||||||||
| CRUNCEPv7 | [-] | 64.1 | 64.8 | 51.4 | 56.9 | 15.0 | 7.25 | 18.2 | 0.602 | 0.700 | 0.560 | 0.954 | 0.985 | 0.752 | ||
| GSWP3v1 | [-] | 59.7 | 60.1 | 51.0 | 56.9 | 15.0 | 2.71 | 15.4 | 0.540 | 0.712 | 0.620 | 0.962 | 0.893 | 0.761 | ||
| WATCH | [-] | 68.6 | 69.3 | 54.0 | 56.8 | 14.9 | 11.6 | 20.1 | 0.569 | 0.624 | 0.563 | 0.959 | 0.971 | 0.736 |
Download Data |
Period Mean (original grids) [Watt/m2] |
Model Period Mean (intersection) [Watt/m2] |
Model Period Mean (complement) [Watt/m2] |
Benchmark Period Mean (intersection) [Watt/m2] |
Benchmark Period Mean (complement) [Watt/m2] |
Bias [Watt/m2] |
RMSE [Watt/m2] |
Phase Shift [months] |
Bias Score [1] |
RMSE Score [1] |
Seasonal Cycle Score [1] |
Spatial Distribution Score [1] |
Overall Score [1] |
|||
|---|---|---|---|---|---|---|---|---|---|---|---|---|---|---|---|---|
| Benchmark | [-] | 20.2 | ||||||||||||||
| CRUNCEPv7 | [-] | 21.2 | 21.0 | 25.6 | 20.4 | 7.08 | 1.11 | 22.2 | 0.696 | 0.680 | 0.472 | 0.917 | 0.581 | 0.624 | ||
| GSWP3v1 | [-] | 19.6 | 19.2 | 29.0 | 20.4 | 7.08 | -0.160 | 16.0 | 0.832 | 0.722 | 0.598 | 0.916 | 0.822 | 0.731 | ||
| WATCH | [-] | 14.1 | 13.9 | 19.4 | 20.4 | 7.11 | -5.98 | 16.6 | 0.778 | 0.640 | 0.612 | 0.917 | 0.919 | 0.740 |
Download Data |
Period Mean (original grids) [Watt/m2] |
Model Period Mean (intersection) [Watt/m2] |
Model Period Mean (complement) [Watt/m2] |
Benchmark Period Mean (intersection) [Watt/m2] |
Benchmark Period Mean (complement) [Watt/m2] |
Bias [Watt/m2] |
RMSE [Watt/m2] |
Phase Shift [months] |
Bias Score [1] |
RMSE Score [1] |
Seasonal Cycle Score [1] |
Spatial Distribution Score [1] |
Overall Score [1] |
|||
|---|---|---|---|---|---|---|---|---|---|---|---|---|---|---|---|---|
| Benchmark | [-] | 34.3 | ||||||||||||||
| CRUNCEPv7 | [-] | 32.2 | 37.2 | 11.2 | 34.6 | 11.5 | 2.60 | 22.5 | 1.02 | 0.556 | 0.456 | 0.894 | 0.788 | 0.630 | ||
| GSWP3v1 | [-] | 31.0 | 36.8 | 6.87 | 34.6 | 11.5 | 2.16 | 19.1 | 0.881 | 0.599 | 0.490 | 0.911 | 0.925 | 0.683 | ||
| WATCH | [-] | 28.3 | 34.3 | 3.41 | 34.7 | 11.5 | -0.436 | 20.1 | 0.948 | 0.539 | 0.479 | 0.901 | 0.899 | 0.659 |
Download Data |
Period Mean (original grids) [Watt/m2] |
Model Period Mean (intersection) [Watt/m2] |
Model Period Mean (complement) [Watt/m2] |
Benchmark Period Mean (intersection) [Watt/m2] |
Benchmark Period Mean (complement) [Watt/m2] |
Bias [Watt/m2] |
RMSE [Watt/m2] |
Phase Shift [months] |
Bias Score [1] |
RMSE Score [1] |
Seasonal Cycle Score [1] |
Spatial Distribution Score [1] |
Overall Score [1] |
|||
|---|---|---|---|---|---|---|---|---|---|---|---|---|---|---|---|---|
| Benchmark | [-] | 22.7 | ||||||||||||||
| CRUNCEPv7 | [-] | 56.4 | 58.3 | 54.6 | 22.8 | 18.3 | 36.2 | 44.1 | 1.34 | 0.511 | 0.449 | 0.931 | 0.798 | 0.627 | ||
| GSWP3v1 | [-] | 45.5 | 48.2 | 43.0 | 22.8 | 18.3 | 26.2 | 36.6 | 1.26 | 0.509 | 0.485 | 0.937 | 0.776 | 0.639 | ||
| WATCH | [-] | 35.7 | 37.3 | 34.2 | 22.8 | 18.4 | 15.1 | 32.7 | 1.45 | 0.431 | 0.485 | 0.918 | 0.681 | 0.600 |
Download Data |
Period Mean (original grids) [Watt/m2] |
Model Period Mean (intersection) [Watt/m2] |
Model Period Mean (complement) [Watt/m2] |
Benchmark Period Mean (intersection) [Watt/m2] |
Benchmark Period Mean (complement) [Watt/m2] |
Bias [Watt/m2] |
RMSE [Watt/m2] |
Phase Shift [months] |
Bias Score [1] |
RMSE Score [1] |
Seasonal Cycle Score [1] |
Spatial Distribution Score [1] |
Overall Score [1] |
|||
|---|---|---|---|---|---|---|---|---|---|---|---|---|---|---|---|---|
| Benchmark | [-] | 17.0 | ||||||||||||||
| CRUNCEPv7 | [-] | -1.36 | -0.796 | -10.9 | 17.0 | 4.51 | -18.3 | 25.6 | 1.08 | 0.501 | 0.545 | 0.890 | 0.488 | 0.594 | ||
| GSWP3v1 | [-] | 9.34 | 9.87 | 0.733 | 17.0 | 4.51 | -7.63 | 21.0 | 0.966 | 0.705 | 0.511 | 0.907 | 0.884 | 0.704 | ||
| WATCH | [-] | 5.43 | 5.71 | -0.202 | 17.1 | 4.53 | -11.4 | 22.1 | 1.01 | 0.627 | 0.529 | 0.904 | 0.758 | 0.669 |
Download Data |
Period Mean (original grids) [Watt/m2] |
Model Period Mean (intersection) [Watt/m2] |
Model Period Mean (complement) [Watt/m2] |
Benchmark Period Mean (intersection) [Watt/m2] |
Benchmark Period Mean (complement) [Watt/m2] |
Bias [Watt/m2] |
RMSE [Watt/m2] |
Phase Shift [months] |
Bias Score [1] |
RMSE Score [1] |
Seasonal Cycle Score [1] |
Spatial Distribution Score [1] |
Overall Score [1] |
|||
|---|---|---|---|---|---|---|---|---|---|---|---|---|---|---|---|---|
| Benchmark | [-] | 47.7 | ||||||||||||||
| CRUNCEPv7 | [-] | 54.1 | 53.3 | 62.2 | 48.2 | 15.9 | 5.59 | 24.9 | 0.650 | 0.463 | 0.520 | 0.945 | 0.681 | 0.626 | ||
| GSWP3v1 | [-] | 50.2 | 49.8 | 55.9 | 48.2 | 15.9 | 1.46 | 21.3 | 0.676 | 0.515 | 0.534 | 0.932 | 0.885 | 0.680 | ||
| WATCH | [-] | 50.8 | 50.4 | 53.4 | 48.4 | 16.0 | 1.51 | 18.4 | 0.608 | 0.583 | 0.552 | 0.952 | 0.941 | 0.716 |
Download Data |
Period Mean (original grids) [Watt/m2] |
Model Period Mean (intersection) [Watt/m2] |
Model Period Mean (complement) [Watt/m2] |
Benchmark Period Mean (intersection) [Watt/m2] |
Benchmark Period Mean (complement) [Watt/m2] |
Bias [Watt/m2] |
RMSE [Watt/m2] |
Phase Shift [months] |
Bias Score [1] |
RMSE Score [1] |
Seasonal Cycle Score [1] |
Spatial Distribution Score [1] |
Overall Score [1] |
|||
|---|---|---|---|---|---|---|---|---|---|---|---|---|---|---|---|---|
| Benchmark | [-] | 28.6 | ||||||||||||||
| CRUNCEPv7 | [-] | 31.5 | 31.5 | 33.6 | 28.7 | 12.1 | 3.05 | 17.9 | 1.89 | 0.629 | 0.401 | 0.702 | 0.826 | 0.592 | ||
| GSWP3v1 | [-] | 30.5 | 30.4 | 32.8 | 28.7 | 12.1 | 1.84 | 14.4 | 0.637 | 0.727 | 0.471 | 0.933 | 0.981 | 0.717 | ||
| WATCH | [-] | 35.1 | 35.2 | 33.8 | 28.7 | 12.1 | 6.65 | 16.5 | 0.707 | 0.620 | 0.472 | 0.928 | 0.911 | 0.680 |
Download Data |
Period Mean (original grids) [Watt/m2] |
Model Period Mean (intersection) [Watt/m2] |
Model Period Mean (complement) [Watt/m2] |
Benchmark Period Mean (intersection) [Watt/m2] |
Benchmark Period Mean (complement) [Watt/m2] |
Bias [Watt/m2] |
RMSE [Watt/m2] |
Phase Shift [months] |
Bias Score [1] |
RMSE Score [1] |
Seasonal Cycle Score [1] |
Spatial Distribution Score [1] |
Overall Score [1] |
|||
|---|---|---|---|---|---|---|---|---|---|---|---|---|---|---|---|---|
| Benchmark | [-] | 26.7 | ||||||||||||||
| CRUNCEPv7 | [-] | 17.4 | 17.4 | 17.9 | 26.9 | 8.98 | -9.57 | 19.3 | 1.01 | 0.660 | 0.603 | 0.892 | 0.951 | 0.742 | ||
| GSWP3v1 | [-] | 24.9 | 24.9 | 24.5 | 26.9 | 8.98 | -1.95 | 16.2 | 0.693 | 0.785 | 0.593 | 0.937 | 0.969 | 0.775 | ||
| WATCH | [-] | 24.8 | 24.9 | 23.2 | 26.9 | 8.98 | -1.95 | 16.0 | 0.671 | 0.766 | 0.619 | 0.944 | 0.957 | 0.781 |
Download Data |
Period Mean (original grids) [Watt/m2] |
Model Period Mean (intersection) [Watt/m2] |
Model Period Mean (complement) [Watt/m2] |
Benchmark Period Mean (intersection) [Watt/m2] |
Benchmark Period Mean (complement) [Watt/m2] |
Bias [Watt/m2] |
RMSE [Watt/m2] |
Phase Shift [months] |
Bias Score [1] |
RMSE Score [1] |
Seasonal Cycle Score [1] |
Spatial Distribution Score [1] |
Overall Score [1] |
|||
|---|---|---|---|---|---|---|---|---|---|---|---|---|---|---|---|---|
| Benchmark | [-] | 49.7 | ||||||||||||||
| CRUNCEPv7 | [-] | 37.7 | 37.8 | 60.2 | 49.8 | 11.0 | -11.9 | 19.2 | 0.577 | 0.636 | 0.657 | 0.950 | 0.918 | 0.764 | ||
| GSWP3v1 | [-] | 44.9 | 44.6 | 66.6 | 49.8 | 11.0 | -5.13 | 17.0 | 0.824 | 0.726 | 0.646 | 0.923 | 0.891 | 0.766 | ||
| WATCH | [-] | 44.2 | 44.1 | 69.2 | 49.7 | 10.9 | -5.44 | 16.5 | 0.653 | 0.731 | 0.675 | 0.942 | 0.906 | 0.786 |
Download Data |
Period Mean (original grids) [Watt/m2] |
Model Period Mean (intersection) [Watt/m2] |
Model Period Mean (complement) [Watt/m2] |
Benchmark Period Mean (intersection) [Watt/m2] |
Benchmark Period Mean (complement) [Watt/m2] |
Bias [Watt/m2] |
RMSE [Watt/m2] |
Phase Shift [months] |
Bias Score [1] |
RMSE Score [1] |
Seasonal Cycle Score [1] |
Spatial Distribution Score [1] |
Overall Score [1] |
|||
|---|---|---|---|---|---|---|---|---|---|---|---|---|---|---|---|---|
| Benchmark | [-] | 30.2 | ||||||||||||||
| CRUNCEPv7 | [-] | 36.5 | 36.4 | 50.4 | 30.3 | 13.0 | 6.57 | 16.1 | 1.45 | 0.329 | 0.191 | 0.813 | 0.701 | 0.445 | ||
| GSWP3v1 | [-] | 30.7 | 30.7 | 45.7 | 30.3 | 13.0 | 0.943 | 12.6 | 1.42 | 0.427 | 0.277 | 0.810 | 0.701 | 0.498 | ||
| WATCH | [-] | 35.8 | 35.9 | 31.6 | 30.3 | 12.9 | 5.52 | 14.6 | 1.34 | 0.348 | 0.229 | 0.815 | 0.754 | 0.475 |
Download Data |
Period Mean (original grids) [Watt/m2] |
Model Period Mean (intersection) [Watt/m2] |
Model Period Mean (complement) [Watt/m2] |
Benchmark Period Mean (intersection) [Watt/m2] |
Benchmark Period Mean (complement) [Watt/m2] |
Bias [Watt/m2] |
RMSE [Watt/m2] |
Phase Shift [months] |
Bias Score [1] |
RMSE Score [1] |
Seasonal Cycle Score [1] |
Spatial Distribution Score [1] |
Overall Score [1] |
|||
|---|---|---|---|---|---|---|---|---|---|---|---|---|---|---|---|---|
| Benchmark | [-] | 40.3 | ||||||||||||||
| CRUNCEPv7 | [-] | 46.8 | 47.0 | 43.6 | 40.4 | 9.36 | 6.69 | 16.7 | 0.967 | 0.515 | 0.422 | 0.905 | 0.778 | 0.608 | ||
| GSWP3v1 | [-] | 42.8 | 43.1 | 40.0 | 40.4 | 9.36 | 2.70 | 14.4 | 0.875 | 0.607 | 0.430 | 0.911 | 0.875 | 0.651 | ||
| WATCH | [-] | 40.3 | 40.7 | 38.4 | 40.3 | 9.38 | 0.367 | 14.8 | 1.04 | 0.574 | 0.430 | 0.879 | 0.877 | 0.638 |
Download Data |
Period Mean (original grids) [Watt/m2] |
Model Period Mean (intersection) [Watt/m2] |
Model Period Mean (complement) [Watt/m2] |
Benchmark Period Mean (intersection) [Watt/m2] |
Benchmark Period Mean (complement) [Watt/m2] |
Bias [Watt/m2] |
RMSE [Watt/m2] |
Phase Shift [months] |
Bias Score [1] |
RMSE Score [1] |
Seasonal Cycle Score [1] |
Spatial Distribution Score [1] |
Overall Score [1] |
|||
|---|---|---|---|---|---|---|---|---|---|---|---|---|---|---|---|---|
| Benchmark | [-] | 41.5 | ||||||||||||||
| CRUNCEPv7 | [-] | 56.9 | 56.4 | 61.4 | 42.0 | 6.56 | 13.2 | 26.8 | 0.781 | 0.610 | 0.549 | 0.930 | 0.938 | 0.715 | ||
| GSWP3v1 | [-] | 62.7 | 62.0 | 68.8 | 42.0 | 6.56 | 18.5 | 33.8 | 0.746 | 0.500 | 0.512 | 0.939 | 0.830 | 0.659 | ||
| WATCH | [-] | 65.6 | 65.2 | 70.6 | 42.0 | 6.58 | 22.0 | 30.9 | 0.588 | 0.541 | 0.531 | 0.946 | 0.935 | 0.697 |
Temporally integrated period mean