Mean State
Download Data |
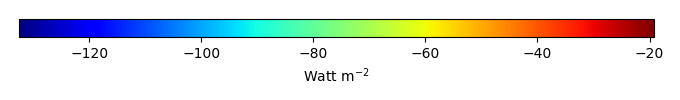
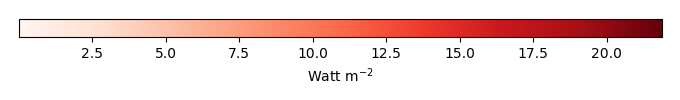
Period Mean (original grids) [Watt m-2] |
Model Period Mean (intersection) [Watt m-2] |
Model Period Mean (complement) [Watt m-2] |
Benchmark Period Mean (intersection) [Watt m-2] |
Benchmark Period Mean (complement) [Watt m-2] |
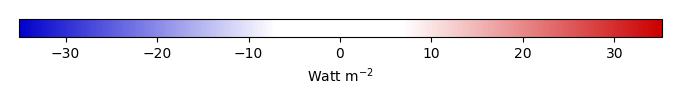
Bias [Watt m-2] |
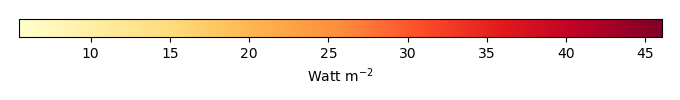
RMSE [Watt m-2] |
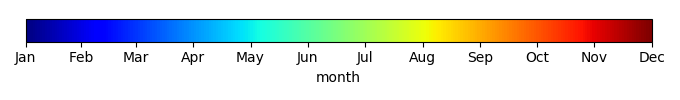
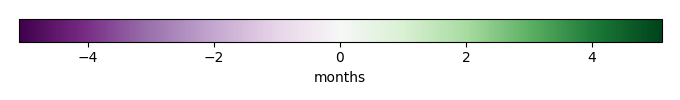
Phase Shift [months] |
Bias Score [1] |
RMSE Score [1] |
Seasonal Cycle Score [1] |
Spatial Distribution Score [1] |
Interannual Variability Score [1] |
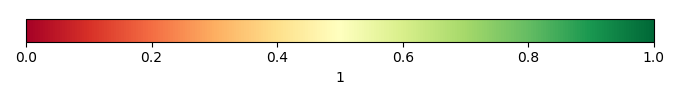
Overall Score [1] |
|||
|---|---|---|---|---|---|---|---|---|---|---|---|---|---|---|---|---|---|
| Benchmark | [-] | -56.8 | |||||||||||||||
| CRUNCEPv7 | [-] | -56.5 | -56.4 | -57.0 | -52.3 | 1.23 | 14.0 | 2.12 | 0.586 | 0.458 | 0.676 | 0.992 | 0.553 | 0.621 | |||
| GSWP3v1 | [-] | -66.5 | -66.5 | -57.0 | -52.3 | -9.56 | 16.5 | 1.67 | 0.441 | 0.458 | 0.762 | 0.975 | 0.822 | 0.652 | |||
| WATCH | [-] | -53.9 | -53.6 | -55.9 | -52.5 | 1.71 | 11.5 | 1.16 | 0.634 | 0.510 | 0.841 | 0.994 | 0.744 | 0.705 |
Download Data |
Period Mean (original grids) [Watt m-2] |
Model Period Mean (intersection) [Watt m-2] |
Model Period Mean (complement) [Watt m-2] |
Benchmark Period Mean (intersection) [Watt m-2] |
Benchmark Period Mean (complement) [Watt m-2] |
Bias [Watt m-2] |
RMSE [Watt m-2] |
Phase Shift [months] |
Bias Score [1] |
RMSE Score [1] |
Seasonal Cycle Score [1] |
Spatial Distribution Score [1] |
Interannual Variability Score [1] |
Overall Score [1] |
|||
|---|---|---|---|---|---|---|---|---|---|---|---|---|---|---|---|---|---|
| Benchmark | [-] | -87.0 | |||||||||||||||
| CRUNCEPv7 | [-] | -90.0 | -90.7 | -87.4 | -58.4 | -2.82 | 19.4 | 0.297 | 0.763 | 0.582 | 0.972 | 0.913 | 0.530 | 0.724 | |||
| GSWP3v1 | [-] | -97.3 | -98.0 | -87.4 | -58.4 | -10.2 | 22.1 | 0.309 | 0.676 | 0.590 | 0.971 | 0.811 | 0.720 | 0.726 | |||
| WATCH | [-] | -80.4 | -81.1 | -85.5 | -58.4 | 4.59 | 15.2 | 0.174 | 0.800 | 0.639 | 0.986 | 0.985 | 0.653 | 0.784 |
Download Data |
Period Mean (original grids) [Watt m-2] |
Model Period Mean (intersection) [Watt m-2] |
Model Period Mean (complement) [Watt m-2] |
Benchmark Period Mean (intersection) [Watt m-2] |
Benchmark Period Mean (complement) [Watt m-2] |
Bias [Watt m-2] |
RMSE [Watt m-2] |
Phase Shift [months] |
Bias Score [1] |
RMSE Score [1] |
Seasonal Cycle Score [1] |
Spatial Distribution Score [1] |
Interannual Variability Score [1] |
Overall Score [1] |
|||
|---|---|---|---|---|---|---|---|---|---|---|---|---|---|---|---|---|---|
| Benchmark | [-] | -81.4 | |||||||||||||||
| CRUNCEPv7 | [-] | -80.9 | -81.1 | -82.3 | -62.6 | 3.32 | 20.0 | 1.18 | 0.704 | 0.474 | 0.845 | 0.993 | 0.501 | 0.665 | |||
| GSWP3v1 | [-] | -91.9 | -92.0 | -82.3 | -62.6 | -7.58 | 19.7 | 0.810 | 0.617 | 0.506 | 0.901 | 0.972 | 0.712 | 0.702 | |||
| WATCH | [-] | -80.2 | -80.3 | -79.8 | -62.6 | 0.752 | 14.7 | 0.767 | 0.713 | 0.559 | 0.905 | 0.984 | 0.738 | 0.743 |
Download Data |
Period Mean (original grids) [Watt m-2] |
Model Period Mean (intersection) [Watt m-2] |
Model Period Mean (complement) [Watt m-2] |
Benchmark Period Mean (intersection) [Watt m-2] |
Benchmark Period Mean (complement) [Watt m-2] |
Bias [Watt m-2] |
RMSE [Watt m-2] |
Phase Shift [months] |
Bias Score [1] |
RMSE Score [1] |
Seasonal Cycle Score [1] |
Spatial Distribution Score [1] |
Interannual Variability Score [1] |
Overall Score [1] |
|||
|---|---|---|---|---|---|---|---|---|---|---|---|---|---|---|---|---|---|
| Benchmark | [-] | -37.2 | |||||||||||||||
| CRUNCEPv7 | [-] | -60.3 | -60.4 | -36.9 | -41.0 | -23.3 | 26.1 | 1.03 | 0.242 | 0.494 | 0.878 | 0.828 | 0.503 | 0.573 | |||
| GSWP3v1 | [-] | -39.5 | -39.6 | -36.9 | -41.0 | -3.38 | 16.5 | 1.11 | 0.715 | 0.401 | 0.859 | 0.967 | 0.882 | 0.704 | |||
| WATCH | [-] | -43.1 | -43.2 | -36.9 | -40.9 | -5.98 | 14.5 | 1.62 | 0.677 | 0.464 | 0.774 | 0.995 | 0.821 | 0.699 |
Download Data |
Period Mean (original grids) [Watt m-2] |
Model Period Mean (intersection) [Watt m-2] |
Model Period Mean (complement) [Watt m-2] |
Benchmark Period Mean (intersection) [Watt m-2] |
Benchmark Period Mean (complement) [Watt m-2] |
Bias [Watt m-2] |
RMSE [Watt m-2] |
Phase Shift [months] |
Bias Score [1] |
RMSE Score [1] |
Seasonal Cycle Score [1] |
Spatial Distribution Score [1] |
Interannual Variability Score [1] |
Overall Score [1] |
|||
|---|---|---|---|---|---|---|---|---|---|---|---|---|---|---|---|---|---|
| Benchmark | [-] | -44.6 | |||||||||||||||
| CRUNCEPv7 | [-] | -29.4 | -29.3 | -43.2 | -49.2 | 14.9 | 17.2 | 2.67 | 0.114 | 0.374 | 0.554 | 0.877 | 0.524 | 0.469 | |||
| GSWP3v1 | [-] | -49.7 | -49.7 | -43.2 | -49.2 | -5.81 | 10.4 | 1.88 | 0.350 | 0.344 | 0.716 | 0.981 | 0.778 | 0.585 | |||
| WATCH | [-] | -38.7 | -38.7 | -42.9 | -49.3 | 3.29 | 9.57 | 1.49 | 0.403 | 0.368 | 0.804 | 0.729 | 0.777 | 0.575 |
Download Data |
Period Mean (original grids) [Watt m-2] |
Model Period Mean (intersection) [Watt m-2] |
Model Period Mean (complement) [Watt m-2] |
Benchmark Period Mean (intersection) [Watt m-2] |
Benchmark Period Mean (complement) [Watt m-2] |
Bias [Watt m-2] |
RMSE [Watt m-2] |
Phase Shift [months] |
Bias Score [1] |
RMSE Score [1] |
Seasonal Cycle Score [1] |
Spatial Distribution Score [1] |
Interannual Variability Score [1] |
Overall Score [1] |
|||
|---|---|---|---|---|---|---|---|---|---|---|---|---|---|---|---|---|---|
| Benchmark | [-] | -42.1 | |||||||||||||||
| CRUNCEPv7 | [-] | -65.8 | -65.8 | -41.9 | -51.7 | -23.9 | 27.0 | 1.08 | 0.229 | 0.461 | 0.874 | 0.755 | 0.540 | 0.553 | |||
| GSWP3v1 | [-] | -52.1 | -52.1 | -41.9 | -51.7 | -10.1 | 15.7 | 0.716 | 0.538 | 0.487 | 0.918 | 0.994 | 0.893 | 0.720 | |||
| WATCH | [-] | -48.3 | -48.3 | -41.7 | -51.9 | -6.75 | 13.3 | 1.28 | 0.667 | 0.500 | 0.819 | 0.930 | 0.865 | 0.714 |
Download Data |
Period Mean (original grids) [Watt m-2] |
Model Period Mean (intersection) [Watt m-2] |
Model Period Mean (complement) [Watt m-2] |
Benchmark Period Mean (intersection) [Watt m-2] |
Benchmark Period Mean (complement) [Watt m-2] |
Bias [Watt m-2] |
RMSE [Watt m-2] |
Phase Shift [months] |
Bias Score [1] |
RMSE Score [1] |
Seasonal Cycle Score [1] |
Spatial Distribution Score [1] |
Interannual Variability Score [1] |
Overall Score [1] |
|||
|---|---|---|---|---|---|---|---|---|---|---|---|---|---|---|---|---|---|
| Benchmark | [-] | -67.1 | |||||||||||||||
| CRUNCEPv7 | [-] | -82.2 | -82.1 | -67.3 | -59.4 | -13.7 | 22.2 | 1.16 | 0.483 | 0.466 | 0.837 | 0.937 | 0.542 | 0.622 | |||
| GSWP3v1 | [-] | -72.9 | -72.6 | -67.3 | -59.4 | -4.47 | 16.3 | 1.02 | 0.677 | 0.496 | 0.853 | 0.992 | 0.807 | 0.721 | |||
| WATCH | [-] | -73.9 | -73.7 | -66.0 | -59.1 | -7.00 | 16.9 | 1.49 | 0.635 | 0.493 | 0.769 | 0.988 | 0.763 | 0.690 |
Download Data |
Period Mean (original grids) [Watt m-2] |
Model Period Mean (intersection) [Watt m-2] |
Model Period Mean (complement) [Watt m-2] |
Benchmark Period Mean (intersection) [Watt m-2] |
Benchmark Period Mean (complement) [Watt m-2] |
Bias [Watt m-2] |
RMSE [Watt m-2] |
Phase Shift [months] |
Bias Score [1] |
RMSE Score [1] |
Seasonal Cycle Score [1] |
Spatial Distribution Score [1] |
Interannual Variability Score [1] |
Overall Score [1] |
|||
|---|---|---|---|---|---|---|---|---|---|---|---|---|---|---|---|---|---|
| Benchmark | [-] | -71.2 | |||||||||||||||
| CRUNCEPv7 | [-] | -72.7 | -72.7 | -72.6 | -53.4 | 4.54 | 20.1 | 1.01 | 0.661 | 0.517 | 0.868 | 0.986 | 0.494 | 0.674 | |||
| GSWP3v1 | [-] | -80.3 | -80.5 | -72.6 | -53.4 | -5.12 | 18.3 | 0.861 | 0.679 | 0.546 | 0.890 | 0.955 | 0.710 | 0.721 | |||
| WATCH | [-] | -75.5 | -75.3 | -71.2 | -53.5 | -1.54 | 15.2 | 0.806 | 0.751 | 0.572 | 0.897 | 0.996 | 0.659 | 0.741 |
Download Data |
Period Mean (original grids) [Watt m-2] |
Model Period Mean (intersection) [Watt m-2] |
Model Period Mean (complement) [Watt m-2] |
Benchmark Period Mean (intersection) [Watt m-2] |
Benchmark Period Mean (complement) [Watt m-2] |
Bias [Watt m-2] |
RMSE [Watt m-2] |
Phase Shift [months] |
Bias Score [1] |
RMSE Score [1] |
Seasonal Cycle Score [1] |
Spatial Distribution Score [1] |
Interannual Variability Score [1] |
Overall Score [1] |
|||
|---|---|---|---|---|---|---|---|---|---|---|---|---|---|---|---|---|---|
| Benchmark | [-] | -31.1 | |||||||||||||||
| CRUNCEPv7 | [-] | -58.4 | -58.5 | -31.1 | -32.1 | -27.2 | 29.3 | 0.789 | 0.183 | 0.499 | 0.932 | 0.958 | 0.528 | 0.600 | |||
| GSWP3v1 | [-] | -38.9 | -39.0 | -31.1 | -32.1 | -7.87 | 16.1 | 0.817 | 0.608 | 0.431 | 0.919 | 0.961 | 0.898 | 0.708 | |||
| WATCH | [-] | -36.0 | -36.1 | -31.1 | -32.1 | -4.88 | 12.9 | 1.17 | 0.709 | 0.493 | 0.854 | 0.977 | 0.845 | 0.729 |
Download Data |
Period Mean (original grids) [Watt m-2] |
Model Period Mean (intersection) [Watt m-2] |
Model Period Mean (complement) [Watt m-2] |
Benchmark Period Mean (intersection) [Watt m-2] |
Benchmark Period Mean (complement) [Watt m-2] |
Bias [Watt m-2] |
RMSE [Watt m-2] |
Phase Shift [months] |
Bias Score [1] |
RMSE Score [1] |
Seasonal Cycle Score [1] |
Spatial Distribution Score [1] |
Interannual Variability Score [1] |
Overall Score [1] |
|||
|---|---|---|---|---|---|---|---|---|---|---|---|---|---|---|---|---|---|
| Benchmark | [-] | -96.8 | |||||||||||||||
| CRUNCEPv7 | [-] | -96.7 | -96.7 | -99.4 | -63.9 | 5.96 | 19.5 | 0.614 | 0.606 | 0.507 | 0.908 | 0.905 | 0.507 | 0.657 | |||
| GSWP3v1 | [-] | -99.6 | -99.6 | -99.4 | -63.9 | 3.14 | 15.8 | 0.545 | 0.685 | 0.540 | 0.920 | 0.963 | 0.745 | 0.732 | |||
| WATCH | [-] | -96.2 | -96.2 | -97.7 | -63.9 | 4.73 | 14.4 | 0.647 | 0.684 | 0.577 | 0.903 | 0.963 | 0.740 | 0.741 |
Download Data |
Period Mean (original grids) [Watt m-2] |
Model Period Mean (intersection) [Watt m-2] |
Model Period Mean (complement) [Watt m-2] |
Benchmark Period Mean (intersection) [Watt m-2] |
Benchmark Period Mean (complement) [Watt m-2] |
Bias [Watt m-2] |
RMSE [Watt m-2] |
Phase Shift [months] |
Bias Score [1] |
RMSE Score [1] |
Seasonal Cycle Score [1] |
Spatial Distribution Score [1] |
Interannual Variability Score [1] |
Overall Score [1] |
|||
|---|---|---|---|---|---|---|---|---|---|---|---|---|---|---|---|---|---|
| Benchmark | [-] | -55.6 | |||||||||||||||
| CRUNCEPv7 | [-] | -70.2 | -70.3 | -55.1 | -60.8 | -14.6 | 19.5 | 1.21 | 0.338 | 0.457 | 0.835 | 0.547 | 0.534 | 0.528 | |||
| GSWP3v1 | [-] | -58.2 | -58.2 | -55.1 | -60.8 | -3.61 | 11.6 | 0.745 | 0.654 | 0.470 | 0.909 | 0.973 | 0.869 | 0.724 | |||
| WATCH | [-] | -54.9 | -55.0 | -54.6 | -60.8 | -1.38 | 10.2 | 0.866 | 0.733 | 0.499 | 0.887 | 0.997 | 0.843 | 0.743 |
Download Data |
Period Mean (original grids) [Watt m-2] |
Model Period Mean (intersection) [Watt m-2] |
Model Period Mean (complement) [Watt m-2] |
Benchmark Period Mean (intersection) [Watt m-2] |
Benchmark Period Mean (complement) [Watt m-2] |
Bias [Watt m-2] |
RMSE [Watt m-2] |
Phase Shift [months] |
Bias Score [1] |
RMSE Score [1] |
Seasonal Cycle Score [1] |
Spatial Distribution Score [1] |
Interannual Variability Score [1] |
Overall Score [1] |
|||
|---|---|---|---|---|---|---|---|---|---|---|---|---|---|---|---|---|---|
| Benchmark | [-] | -52.6 | |||||||||||||||
| CRUNCEPv7 | [-] | -71.7 | -71.7 | -65.2 | -46.5 | -4.65 | 22.3 | 1.23 | 0.451 | 0.472 | 0.829 | 0.909 | 0.501 | 0.606 | |||
| GSWP3v1 | [-] | -71.2 | -71.2 | -65.2 | -46.5 | -4.70 | 17.3 | 0.974 | 0.577 | 0.491 | 0.865 | 0.944 | 0.769 | 0.689 | |||
| WATCH | [-] | -67.0 | -67.0 | -64.1 | -46.5 | -1.75 | 16.1 | 1.21 | 0.602 | 0.509 | 0.824 | 0.942 | 0.741 | 0.688 |
Download Data |
Period Mean (original grids) [Watt m-2] |
Model Period Mean (intersection) [Watt m-2] |
Model Period Mean (complement) [Watt m-2] |
Benchmark Period Mean (intersection) [Watt m-2] |
Benchmark Period Mean (complement) [Watt m-2] |
Bias [Watt m-2] |
RMSE [Watt m-2] |
Phase Shift [months] |
Bias Score [1] |
RMSE Score [1] |
Seasonal Cycle Score [1] |
Spatial Distribution Score [1] |
Interannual Variability Score [1] |
Overall Score [1] |
|||
|---|---|---|---|---|---|---|---|---|---|---|---|---|---|---|---|---|---|
| Benchmark | [-] | -121. | |||||||||||||||
| CRUNCEPv7 | [-] | -103. | -103. | -122. | -81.3 | 20.0 | 32.1 | 0.847 | 0.501 | 0.471 | 0.887 | 0.803 | 0.429 | 0.593 | |||
| GSWP3v1 | [-] | -108. | -108. | -122. | -81.3 | 15.4 | 25.9 | 0.675 | 0.562 | 0.529 | 0.911 | 0.819 | 0.635 | 0.664 | |||
| WATCH | [-] | -104. | -104. | -119. | -80.8 | 16.3 | 27.4 | 0.905 | 0.528 | 0.508 | 0.876 | 0.834 | 0.562 | 0.636 |
Download Data |
Period Mean (original grids) [Watt m-2] |
Model Period Mean (intersection) [Watt m-2] |
Model Period Mean (complement) [Watt m-2] |
Benchmark Period Mean (intersection) [Watt m-2] |
Benchmark Period Mean (complement) [Watt m-2] |
Bias [Watt m-2] |
RMSE [Watt m-2] |
Phase Shift [months] |
Bias Score [1] |
RMSE Score [1] |
Seasonal Cycle Score [1] |
Spatial Distribution Score [1] |
Interannual Variability Score [1] |
Overall Score [1] |
|||
|---|---|---|---|---|---|---|---|---|---|---|---|---|---|---|---|---|---|
| Benchmark | [-] | -34.3 | |||||||||||||||
| CRUNCEPv7 | [-] | -60.2 | -60.2 | -34.2 | -36.5 | -25.5 | 27.5 | 0.657 | 0.188 | 0.502 | 0.928 | 0.958 | 0.504 | 0.597 | |||
| GSWP3v1 | [-] | -42.1 | -42.1 | -34.2 | -36.5 | -8.40 | 15.3 | 0.806 | 0.584 | 0.451 | 0.895 | 0.841 | 0.881 | 0.684 | |||
| WATCH | [-] | -43.3 | -43.3 | -34.1 | -36.4 | -8.83 | 15.6 | 1.96 | 0.552 | 0.439 | 0.708 | 0.988 | 0.840 | 0.661 |
Download Data |
Period Mean (original grids) [Watt m-2] |
Model Period Mean (intersection) [Watt m-2] |
Model Period Mean (complement) [Watt m-2] |
Benchmark Period Mean (intersection) [Watt m-2] |
Benchmark Period Mean (complement) [Watt m-2] |
Bias [Watt m-2] |
RMSE [Watt m-2] |
Phase Shift [months] |
Bias Score [1] |
RMSE Score [1] |
Seasonal Cycle Score [1] |
Spatial Distribution Score [1] |
Interannual Variability Score [1] |
Overall Score [1] |
|||
|---|---|---|---|---|---|---|---|---|---|---|---|---|---|---|---|---|---|
| Benchmark | [-] | -70.7 | |||||||||||||||
| CRUNCEPv7 | [-] | -73.0 | -73.0 | -73.4 | -57.5 | 6.44 | 17.5 | 1.72 | 0.533 | 0.463 | 0.721 | 0.957 | 0.538 | 0.613 | |||
| GSWP3v1 | [-] | -84.6 | -84.6 | -73.4 | -57.5 | -7.82 | 16.0 | 1.09 | 0.531 | 0.481 | 0.828 | 0.996 | 0.796 | 0.685 | |||
| WATCH | [-] | -80.9 | -80.9 | -72.1 | -57.1 | -5.42 | 14.9 | 1.25 | 0.559 | 0.532 | 0.801 | 0.929 | 0.757 | 0.685 |
Download Data |
Period Mean (original grids) [Watt m-2] |
Model Period Mean (intersection) [Watt m-2] |
Model Period Mean (complement) [Watt m-2] |
Benchmark Period Mean (intersection) [Watt m-2] |
Benchmark Period Mean (complement) [Watt m-2] |
Bias [Watt m-2] |
RMSE [Watt m-2] |
Phase Shift [months] |
Bias Score [1] |
RMSE Score [1] |
Seasonal Cycle Score [1] |
Spatial Distribution Score [1] |
Interannual Variability Score [1] |
Overall Score [1] |
|||
|---|---|---|---|---|---|---|---|---|---|---|---|---|---|---|---|---|---|
| Benchmark | [-] | -53.2 | |||||||||||||||
| CRUNCEPv7 | [-] | -66.4 | -66.2 | -52.9 | -58.5 | -12.3 | 21.4 | 4.41 | 0.367 | 0.283 | 0.259 | 0.923 | 0.641 | 0.459 | |||
| GSWP3v1 | [-] | -61.8 | -61.7 | -52.9 | -58.5 | -8.67 | 13.0 | 0.738 | 0.496 | 0.471 | 0.881 | 0.989 | 0.891 | 0.700 | |||
| WATCH | [-] | -62.8 | -62.6 | -52.6 | -58.4 | -9.84 | 14.1 | 2.00 | 0.447 | 0.453 | 0.653 | 0.998 | 0.921 | 0.654 |
Download Data |
Period Mean (original grids) [Watt m-2] |
Model Period Mean (intersection) [Watt m-2] |
Model Period Mean (complement) [Watt m-2] |
Benchmark Period Mean (intersection) [Watt m-2] |
Benchmark Period Mean (complement) [Watt m-2] |
Bias [Watt m-2] |
RMSE [Watt m-2] |
Phase Shift [months] |
Bias Score [1] |
RMSE Score [1] |
Seasonal Cycle Score [1] |
Spatial Distribution Score [1] |
Interannual Variability Score [1] |
Overall Score [1] |
|||
|---|---|---|---|---|---|---|---|---|---|---|---|---|---|---|---|---|---|
| Benchmark | [-] | -42.5 | |||||||||||||||
| CRUNCEPv7 | [-] | -67.9 | -67.9 | -42.4 | -45.4 | -25.4 | 28.5 | 1.02 | 0.223 | 0.461 | 0.860 | 0.707 | 0.526 | 0.540 | |||
| GSWP3v1 | [-] | -52.8 | -52.8 | -42.4 | -45.4 | -10.2 | 15.3 | 0.536 | 0.551 | 0.511 | 0.939 | 0.981 | 0.861 | 0.726 | |||
| WATCH | [-] | -53.3 | -53.3 | -42.0 | -45.0 | -11.0 | 16.2 | 0.887 | 0.511 | 0.495 | 0.900 | 0.995 | 0.876 | 0.712 |
Download Data |
Period Mean (original grids) [Watt m-2] |
Model Period Mean (intersection) [Watt m-2] |
Model Period Mean (complement) [Watt m-2] |
Benchmark Period Mean (intersection) [Watt m-2] |
Benchmark Period Mean (complement) [Watt m-2] |
Bias [Watt m-2] |
RMSE [Watt m-2] |
Phase Shift [months] |
Bias Score [1] |
RMSE Score [1] |
Seasonal Cycle Score [1] |
Spatial Distribution Score [1] |
Interannual Variability Score [1] |
Overall Score [1] |
|||
|---|---|---|---|---|---|---|---|---|---|---|---|---|---|---|---|---|---|
| Benchmark | [-] | -80.3 | |||||||||||||||
| CRUNCEPv7 | [-] | -90.6 | -90.4 | -80.8 | -54.9 | -9.08 | 21.9 | 0.524 | 0.622 | 0.525 | 0.929 | 0.712 | 0.518 | 0.638 | |||
| GSWP3v1 | [-] | -86.8 | -86.6 | -80.8 | -54.9 | -5.44 | 18.1 | 0.247 | 0.720 | 0.566 | 0.971 | 0.940 | 0.771 | 0.756 | |||
| WATCH | [-] | -90.7 | -90.4 | -79.0 | -54.6 | -11.0 | 18.5 | 0.522 | 0.631 | 0.580 | 0.922 | 0.997 | 0.781 | 0.749 |
Download Data |
Period Mean (original grids) [Watt m-2] |
Model Period Mean (intersection) [Watt m-2] |
Model Period Mean (complement) [Watt m-2] |
Benchmark Period Mean (intersection) [Watt m-2] |
Benchmark Period Mean (complement) [Watt m-2] |
Bias [Watt m-2] |
RMSE [Watt m-2] |
Phase Shift [months] |
Bias Score [1] |
RMSE Score [1] |
Seasonal Cycle Score [1] |
Spatial Distribution Score [1] |
Interannual Variability Score [1] |
Overall Score [1] |
|||
|---|---|---|---|---|---|---|---|---|---|---|---|---|---|---|---|---|---|
| Benchmark | [-] | -43.7 | |||||||||||||||
| CRUNCEPv7 | [-] | -31.4 | -31.4 | -43.6 | -47.7 | 12.2 | 16.3 | 1.56 | 0.335 | 0.449 | 0.783 | 0.750 | 0.557 | 0.554 | |||
| GSWP3v1 | [-] | -51.8 | -51.7 | -43.6 | -47.7 | -8.13 | 13.1 | 1.56 | 0.463 | 0.460 | 0.786 | 0.873 | 0.753 | 0.633 | |||
| WATCH | [-] | -38.3 | -38.3 | -43.9 | -47.5 | 5.16 | 11.0 | 1.41 | 0.605 | 0.492 | 0.806 | 0.954 | 0.692 | 0.674 |
Download Data |
Period Mean (original grids) [Watt m-2] |
Model Period Mean (intersection) [Watt m-2] |
Model Period Mean (complement) [Watt m-2] |
Benchmark Period Mean (intersection) [Watt m-2] |
Benchmark Period Mean (complement) [Watt m-2] |
Bias [Watt m-2] |
RMSE [Watt m-2] |
Phase Shift [months] |
Bias Score [1] |
RMSE Score [1] |
Seasonal Cycle Score [1] |
Spatial Distribution Score [1] |
Interannual Variability Score [1] |
Overall Score [1] |
|||
|---|---|---|---|---|---|---|---|---|---|---|---|---|---|---|---|---|---|
| Benchmark | [-] | -64.5 | |||||||||||||||
| CRUNCEPv7 | [-] | -63.0 | -63.4 | -64.8 | -56.3 | 2.33 | 15.8 | 1.19 | 0.602 | 0.473 | 0.837 | 0.663 | 0.537 | 0.597 | |||
| GSWP3v1 | [-] | -72.2 | -72.6 | -64.8 | -56.3 | -7.17 | 14.8 | 0.801 | 0.647 | 0.476 | 0.897 | 0.900 | 0.815 | 0.702 | |||
| WATCH | [-] | -58.5 | -58.9 | -63.1 | -55.6 | 4.33 | 12.2 | 0.769 | 0.658 | 0.533 | 0.898 | 0.869 | 0.811 | 0.717 |
Download Data |
Period Mean (original grids) [Watt m-2] |
Model Period Mean (intersection) [Watt m-2] |
Model Period Mean (complement) [Watt m-2] |
Benchmark Period Mean (intersection) [Watt m-2] |
Benchmark Period Mean (complement) [Watt m-2] |
Bias [Watt m-2] |
RMSE [Watt m-2] |
Phase Shift [months] |
Bias Score [1] |
RMSE Score [1] |
Seasonal Cycle Score [1] |
Spatial Distribution Score [1] |
Interannual Variability Score [1] |
Overall Score [1] |
|||
|---|---|---|---|---|---|---|---|---|---|---|---|---|---|---|---|---|---|
| Benchmark | [-] | -80.0 | |||||||||||||||
| CRUNCEPv7 | [-] | -94.1 | -93.9 | -83.0 | -54.0 | -8.56 | 24.9 | 1.07 | 0.414 | 0.455 | 0.854 | 0.617 | 0.488 | 0.547 | |||
| GSWP3v1 | [-] | -85.7 | -85.3 | -83.0 | -54.0 | 0.359 | 19.8 | 0.785 | 0.544 | 0.442 | 0.886 | 0.892 | 0.773 | 0.663 | |||
| WATCH | [-] | -87.3 | -87.0 | -82.0 | -54.5 | -2.41 | 20.2 | 1.10 | 0.511 | 0.458 | 0.845 | 0.987 | 0.720 | 0.663 |
Temporally integrated period mean