Mean State
Download Data |
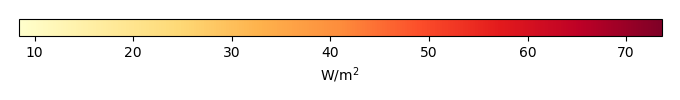
Period Mean (original grids) [W/m2] |
Model Period Mean (intersection) [W/m2] |
Model Period Mean (complement) [W/m2] |
Benchmark Period Mean (intersection) [W/m2] |
Benchmark Period Mean (complement) [W/m2] |
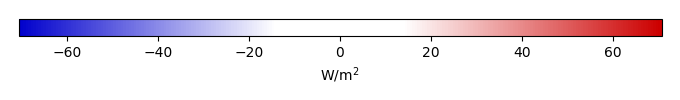
Bias [W/m2] |
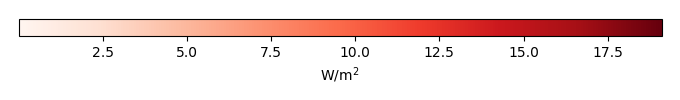
RMSE [W/m2] |
Phase Shift [months] |
Bias Score [1] |
RMSE Score [1] |
Seasonal Cycle Score [1] |
Spatial Distribution Score [1] |
Interannual Variability Score [1] |
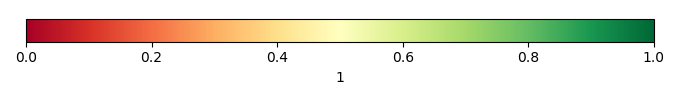
Overall Score [1] |
|||
|---|---|---|---|---|---|---|---|---|---|---|---|---|---|---|---|---|---|
| Benchmark | [-] | 131. | |||||||||||||||
| CRUNCEPv7 | [-] | 136. | 136. | 130. | 157. | 6.69 | 21.4 | 1.30 | 0.462 | 0.452 | 0.832 | 0.980 | 0.529 | 0.618 | |||
| GSWP3v1 | [-] | 116. | 116. | 130. | 157. | -13.7 | 22.6 | 1.40 | 0.513 | 0.420 | 0.812 | 0.990 | 0.694 | 0.642 | |||
| WATCH | [-] | 84.6 | 84.3 | 129. | 156. | -44.0 | 48.9 | 2.20 | 0.135 | 0.358 | 0.655 | 0.882 | 0.688 | 0.513 |
Download Data |
Period Mean (original grids) [W/m2] |
Model Period Mean (intersection) [W/m2] |
Model Period Mean (complement) [W/m2] |
Benchmark Period Mean (intersection) [W/m2] |
Benchmark Period Mean (complement) [W/m2] |
Bias [W/m2] |
RMSE [W/m2] |
Phase Shift [months] |
Bias Score [1] |
RMSE Score [1] |
Seasonal Cycle Score [1] |
Spatial Distribution Score [1] |
Interannual Variability Score [1] |
Overall Score [1] |
|||
|---|---|---|---|---|---|---|---|---|---|---|---|---|---|---|---|---|---|
| Benchmark | [-] | 123. | |||||||||||||||
| CRUNCEPv7 | [-] | 109. | 108. | 122. | 160. | -13.3 | 25.3 | 1.52 | 0.550 | 0.470 | 0.767 | 0.995 | 0.625 | 0.646 | |||
| GSWP3v1 | [-] | 97.4 | 96.9 | 122. | 160. | -24.8 | 30.3 | 1.43 | 0.374 | 0.505 | 0.789 | 0.941 | 0.650 | 0.627 | |||
| WATCH | [-] | 77.3 | 77.3 | 121. | 157. | -43.2 | 46.7 | 1.50 | 0.211 | 0.455 | 0.779 | 0.756 | 0.709 | 0.561 |
Download Data |
Period Mean (original grids) [W/m2] |
Model Period Mean (intersection) [W/m2] |
Model Period Mean (complement) [W/m2] |
Benchmark Period Mean (intersection) [W/m2] |
Benchmark Period Mean (complement) [W/m2] |
Bias [W/m2] |
RMSE [W/m2] |
Phase Shift [months] |
Bias Score [1] |
RMSE Score [1] |
Seasonal Cycle Score [1] |
Spatial Distribution Score [1] |
Interannual Variability Score [1] |
Overall Score [1] |
|||
|---|---|---|---|---|---|---|---|---|---|---|---|---|---|---|---|---|---|
| Benchmark | [-] | 123. | |||||||||||||||
| CRUNCEPv7 | [-] | 114. | 114. | 121. | 157. | -5.34 | 20.3 | 1.24 | 0.703 | 0.612 | 0.836 | 0.995 | 0.569 | 0.721 | |||
| GSWP3v1 | [-] | 105. | 105. | 121. | 157. | -15.0 | 25.1 | 1.49 | 0.616 | 0.570 | 0.774 | 0.955 | 0.683 | 0.695 | |||
| WATCH | [-] | 99.8 | 99.7 | 119. | 151. | -18.2 | 31.6 | 2.10 | 0.513 | 0.512 | 0.673 | 0.670 | 0.727 | 0.601 |
Download Data |
Period Mean (original grids) [W/m2] |
Model Period Mean (intersection) [W/m2] |
Model Period Mean (complement) [W/m2] |
Benchmark Period Mean (intersection) [W/m2] |
Benchmark Period Mean (complement) [W/m2] |
Bias [W/m2] |
RMSE [W/m2] |
Phase Shift [months] |
Bias Score [1] |
RMSE Score [1] |
Seasonal Cycle Score [1] |
Spatial Distribution Score [1] |
Interannual Variability Score [1] |
Overall Score [1] |
|||
|---|---|---|---|---|---|---|---|---|---|---|---|---|---|---|---|---|---|
| Benchmark | [-] | 34.4 | |||||||||||||||
| CRUNCEPv7 | [-] | 15.2 | 15.2 | 34.5 | 33.0 | -20.7 | 27.5 | 0.421 | 0.699 | 0.729 | 0.972 | 0.779 | 0.657 | 0.761 | |||
| GSWP3v1 | [-] | 32.9 | 33.0 | 34.5 | 33.0 | -3.11 | 20.8 | 0.266 | 0.864 | 0.725 | 0.982 | 0.819 | 0.736 | 0.808 | |||
| WATCH | [-] | 22.0 | 22.0 | 39.6 | 37.2 | -17.4 | 22.7 | 0.382 | 0.733 | 0.735 | 0.974 | 0.972 | 0.714 | 0.811 |
Download Data |
Period Mean (original grids) [W/m2] |
Model Period Mean (intersection) [W/m2] |
Model Period Mean (complement) [W/m2] |
Benchmark Period Mean (intersection) [W/m2] |
Benchmark Period Mean (complement) [W/m2] |
Bias [W/m2] |
RMSE [W/m2] |
Phase Shift [months] |
Bias Score [1] |
RMSE Score [1] |
Seasonal Cycle Score [1] |
Spatial Distribution Score [1] |
Interannual Variability Score [1] |
Overall Score [1] |
|||
|---|---|---|---|---|---|---|---|---|---|---|---|---|---|---|---|---|---|
| Benchmark | [-] | 147. | |||||||||||||||
| CRUNCEPv7 | [-] | 157. | 157. | 145. | 156. | 14.9 | 23.6 | 1.65 | 0.418 | 0.438 | 0.755 | 0.998 | 0.507 | 0.592 | |||
| GSWP3v1 | [-] | 128. | 127. | 145. | 156. | -13.0 | 21.7 | 1.63 | 0.478 | 0.433 | 0.743 | 0.986 | 0.685 | 0.626 | |||
| WATCH | [-] | 100. | 100. | 145. | 152. | -37.4 | 42.6 | 2.53 | 0.187 | 0.332 | 0.580 | 0.565 | 0.591 | 0.431 |
Download Data |
Period Mean (original grids) [W/m2] |
Model Period Mean (intersection) [W/m2] |
Model Period Mean (complement) [W/m2] |
Benchmark Period Mean (intersection) [W/m2] |
Benchmark Period Mean (complement) [W/m2] |
Bias [W/m2] |
RMSE [W/m2] |
Phase Shift [months] |
Bias Score [1] |
RMSE Score [1] |
Seasonal Cycle Score [1] |
Spatial Distribution Score [1] |
Interannual Variability Score [1] |
Overall Score [1] |
|||
|---|---|---|---|---|---|---|---|---|---|---|---|---|---|---|---|---|---|
| Benchmark | [-] | 53.7 | |||||||||||||||
| CRUNCEPv7 | [-] | 43.0 | 42.9 | 53.5 | 64.9 | -10.5 | 22.6 | 0.391 | 0.832 | 0.719 | 0.974 | 0.861 | 0.783 | 0.814 | |||
| GSWP3v1 | [-] | 48.1 | 48.1 | 53.5 | 64.9 | -5.14 | 17.0 | 0.214 | 0.875 | 0.774 | 0.986 | 0.903 | 0.721 | 0.839 | |||
| WATCH | [-] | 39.6 | 39.6 | 59.1 | 68.9 | -19.2 | 20.5 | 0.228 | 0.721 | 0.781 | 0.984 | 0.992 | 0.738 | 0.833 |
Download Data |
Period Mean (original grids) [W/m2] |
Model Period Mean (intersection) [W/m2] |
Model Period Mean (complement) [W/m2] |
Benchmark Period Mean (intersection) [W/m2] |
Benchmark Period Mean (complement) [W/m2] |
Bias [W/m2] |
RMSE [W/m2] |
Phase Shift [months] |
Bias Score [1] |
RMSE Score [1] |
Seasonal Cycle Score [1] |
Spatial Distribution Score [1] |
Interannual Variability Score [1] |
Overall Score [1] |
|||
|---|---|---|---|---|---|---|---|---|---|---|---|---|---|---|---|---|---|
| Benchmark | [-] | 71.7 | |||||||||||||||
| CRUNCEPv7 | [-] | 66.2 | 66.0 | 71.1 | 90.6 | -3.81 | 21.4 | 0.517 | 0.789 | 0.693 | 0.955 | 0.944 | 0.733 | 0.801 | |||
| GSWP3v1 | [-] | 62.6 | 62.6 | 71.1 | 90.6 | -7.26 | 19.0 | 0.429 | 0.810 | 0.717 | 0.964 | 0.994 | 0.706 | 0.818 | |||
| WATCH | [-] | 57.2 | 56.9 | 77.3 | 97.4 | -19.2 | 24.2 | 0.697 | 0.662 | 0.678 | 0.935 | 0.984 | 0.698 | 0.772 |
Download Data |
Period Mean (original grids) [W/m2] |
Model Period Mean (intersection) [W/m2] |
Model Period Mean (complement) [W/m2] |
Benchmark Period Mean (intersection) [W/m2] |
Benchmark Period Mean (complement) [W/m2] |
Bias [W/m2] |
RMSE [W/m2] |
Phase Shift [months] |
Bias Score [1] |
RMSE Score [1] |
Seasonal Cycle Score [1] |
Spatial Distribution Score [1] |
Interannual Variability Score [1] |
Overall Score [1] |
|||
|---|---|---|---|---|---|---|---|---|---|---|---|---|---|---|---|---|---|
| Benchmark | [-] | 120. | |||||||||||||||
| CRUNCEPv7 | [-] | 121. | 121. | 118. | 153. | 7.47 | 23.1 | 0.885 | 0.646 | 0.568 | 0.896 | 0.958 | 0.615 | 0.709 | |||
| GSWP3v1 | [-] | 95.0 | 94.6 | 118. | 153. | -18.8 | 27.5 | 0.690 | 0.545 | 0.541 | 0.922 | 0.994 | 0.647 | 0.698 | |||
| WATCH | [-] | 82.3 | 82.4 | 120. | 153. | -33.0 | 38.6 | 0.806 | 0.382 | 0.513 | 0.903 | 0.984 | 0.707 | 0.667 |
Download Data |
Period Mean (original grids) [W/m2] |
Model Period Mean (intersection) [W/m2] |
Model Period Mean (complement) [W/m2] |
Benchmark Period Mean (intersection) [W/m2] |
Benchmark Period Mean (complement) [W/m2] |
Bias [W/m2] |
RMSE [W/m2] |
Phase Shift [months] |
Bias Score [1] |
RMSE Score [1] |
Seasonal Cycle Score [1] |
Spatial Distribution Score [1] |
Interannual Variability Score [1] |
Overall Score [1] |
|||
|---|---|---|---|---|---|---|---|---|---|---|---|---|---|---|---|---|---|
| Benchmark | [-] | 30.5 | |||||||||||||||
| CRUNCEPv7 | [-] | 10.3 | 10.7 | 31.0 | 19.5 | -21.6 | 27.9 | 0.400 | 0.676 | 0.724 | 0.973 | 0.853 | 0.708 | 0.777 | |||
| GSWP3v1 | [-] | 24.2 | 24.5 | 31.0 | 19.5 | -7.63 | 19.3 | 0.205 | 0.860 | 0.736 | 0.986 | 0.981 | 0.754 | 0.842 | |||
| WATCH | [-] | 15.9 | 16.1 | 36.4 | 25.1 | -20.8 | 24.7 | 0.138 | 0.695 | 0.749 | 0.991 | 0.817 | 0.697 | 0.783 |
Download Data |
Period Mean (original grids) [W/m2] |
Model Period Mean (intersection) [W/m2] |
Model Period Mean (complement) [W/m2] |
Benchmark Period Mean (intersection) [W/m2] |
Benchmark Period Mean (complement) [W/m2] |
Bias [W/m2] |
RMSE [W/m2] |
Phase Shift [months] |
Bias Score [1] |
RMSE Score [1] |
Seasonal Cycle Score [1] |
Spatial Distribution Score [1] |
Interannual Variability Score [1] |
Overall Score [1] |
|||
|---|---|---|---|---|---|---|---|---|---|---|---|---|---|---|---|---|---|
| Benchmark | [-] | 109. | |||||||||||||||
| CRUNCEPv7 | [-] | 98.8 | 98.7 | 108. | 131. | -7.39 | 17.6 | 0.707 | 0.816 | 0.730 | 0.941 | 0.985 | 0.683 | 0.814 | |||
| GSWP3v1 | [-] | 93.6 | 93.6 | 108. | 131. | -12.2 | 20.1 | 0.514 | 0.751 | 0.727 | 0.960 | 0.956 | 0.769 | 0.815 | |||
| WATCH | [-] | 104. | 104. | 108. | 124. | -3.32 | 20.5 | 0.842 | 0.815 | 0.662 | 0.913 | 0.867 | 0.701 | 0.770 |
Download Data |
Period Mean (original grids) [W/m2] |
Model Period Mean (intersection) [W/m2] |
Model Period Mean (complement) [W/m2] |
Benchmark Period Mean (intersection) [W/m2] |
Benchmark Period Mean (complement) [W/m2] |
Bias [W/m2] |
RMSE [W/m2] |
Phase Shift [months] |
Bias Score [1] |
RMSE Score [1] |
Seasonal Cycle Score [1] |
Spatial Distribution Score [1] |
Interannual Variability Score [1] |
Overall Score [1] |
|||
|---|---|---|---|---|---|---|---|---|---|---|---|---|---|---|---|---|---|
| Benchmark | [-] | 65.7 | |||||||||||||||
| CRUNCEPv7 | [-] | 62.1 | 62.2 | 63.8 | 85.4 | -0.888 | 22.1 | 0.271 | 0.856 | 0.716 | 0.982 | 0.960 | 0.804 | 0.839 | |||
| GSWP3v1 | [-] | 54.7 | 54.7 | 63.8 | 85.4 | -6.96 | 17.5 | 0.197 | 0.873 | 0.775 | 0.987 | 0.991 | 0.682 | 0.847 | |||
| WATCH | [-] | 40.5 | 40.5 | 67.7 | 91.0 | -25.1 | 26.5 | 0.548 | 0.658 | 0.766 | 0.961 | 0.855 | 0.670 | 0.779 |
Download Data |
Period Mean (original grids) [W/m2] |
Model Period Mean (intersection) [W/m2] |
Model Period Mean (complement) [W/m2] |
Benchmark Period Mean (intersection) [W/m2] |
Benchmark Period Mean (complement) [W/m2] |
Bias [W/m2] |
RMSE [W/m2] |
Phase Shift [months] |
Bias Score [1] |
RMSE Score [1] |
Seasonal Cycle Score [1] |
Spatial Distribution Score [1] |
Interannual Variability Score [1] |
Overall Score [1] |
|||
|---|---|---|---|---|---|---|---|---|---|---|---|---|---|---|---|---|---|
| Benchmark | [-] | 109. | |||||||||||||||
| CRUNCEPv7 | [-] | 72.0 | 72.0 | 80.5 | 123. | -6.85 | 22.6 | 0.734 | 0.663 | 0.620 | 0.917 | 0.963 | 0.618 | 0.734 | |||
| GSWP3v1 | [-] | 65.1 | 65.1 | 80.5 | 123. | -13.7 | 23.0 | 0.692 | 0.642 | 0.614 | 0.917 | 0.978 | 0.684 | 0.742 | |||
| WATCH | [-] | 58.2 | 58.2 | 82.1 | 122. | -22.3 | 28.7 | 1.06 | 0.526 | 0.598 | 0.860 | 0.971 | 0.695 | 0.708 |
Download Data |
Period Mean (original grids) [W/m2] |
Model Period Mean (intersection) [W/m2] |
Model Period Mean (complement) [W/m2] |
Benchmark Period Mean (intersection) [W/m2] |
Benchmark Period Mean (complement) [W/m2] |
Bias [W/m2] |
RMSE [W/m2] |
Phase Shift [months] |
Bias Score [1] |
RMSE Score [1] |
Seasonal Cycle Score [1] |
Spatial Distribution Score [1] |
Interannual Variability Score [1] |
Overall Score [1] |
|||
|---|---|---|---|---|---|---|---|---|---|---|---|---|---|---|---|---|---|
| Benchmark | [-] | 76.6 | |||||||||||||||
| CRUNCEPv7 | [-] | 64.6 | 64.6 | 73.9 | 144. | -7.02 | 19.7 | 0.916 | 0.675 | 0.622 | 0.898 | 0.954 | 0.618 | 0.731 | |||
| GSWP3v1 | [-] | 53.6 | 53.6 | 73.9 | 144. | -18.0 | 24.8 | 0.888 | 0.556 | 0.615 | 0.901 | 0.940 | 0.708 | 0.723 | |||
| WATCH | [-] | 40.4 | 40.5 | 76.4 | 148. | -33.9 | 34.9 | 1.21 | 0.310 | 0.610 | 0.846 | 0.838 | 0.711 | 0.654 |
Download Data |
Period Mean (original grids) [W/m2] |
Model Period Mean (intersection) [W/m2] |
Model Period Mean (complement) [W/m2] |
Benchmark Period Mean (intersection) [W/m2] |
Benchmark Period Mean (complement) [W/m2] |
Bias [W/m2] |
RMSE [W/m2] |
Phase Shift [months] |
Bias Score [1] |
RMSE Score [1] |
Seasonal Cycle Score [1] |
Spatial Distribution Score [1] |
Interannual Variability Score [1] |
Overall Score [1] |
|||
|---|---|---|---|---|---|---|---|---|---|---|---|---|---|---|---|---|---|
| Benchmark | [-] | 36.2 | |||||||||||||||
| CRUNCEPv7 | [-] | 15.1 | 15.0 | 36.2 | 36.3 | -23.1 | 30.0 | 0.138 | 0.664 | 0.709 | 0.991 | 0.804 | 0.589 | 0.744 | |||
| GSWP3v1 | [-] | 27.4 | 27.3 | 36.2 | 36.3 | -10.9 | 21.5 | 0.0841 | 0.819 | 0.726 | 0.994 | 0.929 | 0.770 | 0.827 | |||
| WATCH | [-] | 22.9 | 22.7 | 40.3 | 41.6 | -18.3 | 24.0 | 0.201 | 0.715 | 0.721 | 0.986 | 0.950 | 0.715 | 0.801 |
Download Data |
Period Mean (original grids) [W/m2] |
Model Period Mean (intersection) [W/m2] |
Model Period Mean (complement) [W/m2] |
Benchmark Period Mean (intersection) [W/m2] |
Benchmark Period Mean (complement) [W/m2] |
Bias [W/m2] |
RMSE [W/m2] |
Phase Shift [months] |
Bias Score [1] |
RMSE Score [1] |
Seasonal Cycle Score [1] |
Spatial Distribution Score [1] |
Interannual Variability Score [1] |
Overall Score [1] |
|||
|---|---|---|---|---|---|---|---|---|---|---|---|---|---|---|---|---|---|
| Benchmark | [-] | 138. | |||||||||||||||
| CRUNCEPv7 | [-] | 116. | 117. | 133. | 161. | -8.35 | 28.0 | 1.05 | 0.535 | 0.630 | 0.873 | 0.803 | 0.677 | 0.691 | |||
| GSWP3v1 | [-] | 107. | 107. | 133. | 161. | -20.2 | 27.5 | 1.29 | 0.558 | 0.616 | 0.830 | 0.989 | 0.695 | 0.717 | |||
| WATCH | [-] | 98.5 | 98.6 | 133. | 163. | -29.8 | 33.3 | 1.48 | 0.423 | 0.587 | 0.795 | 0.897 | 0.714 | 0.667 |
Download Data |
Period Mean (original grids) [W/m2] |
Model Period Mean (intersection) [W/m2] |
Model Period Mean (complement) [W/m2] |
Benchmark Period Mean (intersection) [W/m2] |
Benchmark Period Mean (complement) [W/m2] |
Bias [W/m2] |
RMSE [W/m2] |
Phase Shift [months] |
Bias Score [1] |
RMSE Score [1] |
Seasonal Cycle Score [1] |
Spatial Distribution Score [1] |
Interannual Variability Score [1] |
Overall Score [1] |
|||
|---|---|---|---|---|---|---|---|---|---|---|---|---|---|---|---|---|---|
| Benchmark | [-] | 98.6 | |||||||||||||||
| CRUNCEPv7 | [-] | 88.6 | 88.9 | 96.9 | 135. | -6.07 | 19.5 | 0.395 | 0.863 | 0.725 | 0.973 | 0.966 | 0.659 | 0.819 | |||
| GSWP3v1 | [-] | 81.8 | 81.9 | 96.9 | 135. | -13.3 | 19.7 | 0.468 | 0.783 | 0.765 | 0.965 | 0.928 | 0.729 | 0.822 | |||
| WATCH | [-] | 83.3 | 83.4 | 100. | 141. | -15.6 | 19.8 | 0.583 | 0.747 | 0.731 | 0.948 | 0.908 | 0.699 | 0.794 |
Download Data |
Period Mean (original grids) [W/m2] |
Model Period Mean (intersection) [W/m2] |
Model Period Mean (complement) [W/m2] |
Benchmark Period Mean (intersection) [W/m2] |
Benchmark Period Mean (complement) [W/m2] |
Bias [W/m2] |
RMSE [W/m2] |
Phase Shift [months] |
Bias Score [1] |
RMSE Score [1] |
Seasonal Cycle Score [1] |
Spatial Distribution Score [1] |
Interannual Variability Score [1] |
Overall Score [1] |
|||
|---|---|---|---|---|---|---|---|---|---|---|---|---|---|---|---|---|---|
| Benchmark | [-] | 63.9 | |||||||||||||||
| CRUNCEPv7 | [-] | 54.7 | 54.8 | 63.6 | 72.9 | -8.84 | 22.7 | 0.402 | 0.851 | 0.708 | 0.973 | 0.944 | 0.594 | 0.796 | |||
| GSWP3v1 | [-] | 58.2 | 58.3 | 63.6 | 72.9 | -5.21 | 15.3 | 0.153 | 0.895 | 0.794 | 0.990 | 0.990 | 0.707 | 0.862 | |||
| WATCH | [-] | 55.1 | 55.3 | 67.8 | 79.0 | -12.0 | 18.2 | 0.397 | 0.807 | 0.750 | 0.973 | 0.992 | 0.739 | 0.835 |
Download Data |
Period Mean (original grids) [W/m2] |
Model Period Mean (intersection) [W/m2] |
Model Period Mean (complement) [W/m2] |
Benchmark Period Mean (intersection) [W/m2] |
Benchmark Period Mean (complement) [W/m2] |
Bias [W/m2] |
RMSE [W/m2] |
Phase Shift [months] |
Bias Score [1] |
RMSE Score [1] |
Seasonal Cycle Score [1] |
Spatial Distribution Score [1] |
Interannual Variability Score [1] |
Overall Score [1] |
|||
|---|---|---|---|---|---|---|---|---|---|---|---|---|---|---|---|---|---|
| Benchmark | [-] | 82.3 | |||||||||||||||
| CRUNCEPv7 | [-] | 63.0 | 63.5 | 81.8 | 110. | -17.7 | 21.8 | 0.398 | 0.721 | 0.785 | 0.973 | 0.990 | 0.659 | 0.819 | |||
| GSWP3v1 | [-] | 71.4 | 71.6 | 81.8 | 110. | -9.78 | 18.5 | 0.542 | 0.815 | 0.767 | 0.952 | 0.949 | 0.744 | 0.832 | |||
| WATCH | [-] | 71.3 | 71.7 | 87.4 | 114. | -15.0 | 19.6 | 0.433 | 0.748 | 0.747 | 0.969 | 0.977 | 0.761 | 0.825 |
Download Data |
Period Mean (original grids) [W/m2] |
Model Period Mean (intersection) [W/m2] |
Model Period Mean (complement) [W/m2] |
Benchmark Period Mean (intersection) [W/m2] |
Benchmark Period Mean (complement) [W/m2] |
Bias [W/m2] |
RMSE [W/m2] |
Phase Shift [months] |
Bias Score [1] |
RMSE Score [1] |
Seasonal Cycle Score [1] |
Spatial Distribution Score [1] |
Interannual Variability Score [1] |
Overall Score [1] |
|||
|---|---|---|---|---|---|---|---|---|---|---|---|---|---|---|---|---|---|
| Benchmark | [-] | 139. | |||||||||||||||
| CRUNCEPv7 | [-] | 152. | 152. | 138. | 170. | 14.5 | 21.2 | 1.22 | 0.401 | 0.443 | 0.827 | 0.963 | 0.592 | 0.612 | |||
| GSWP3v1 | [-] | 121. | 122. | 138. | 170. | -15.8 | 24.0 | 1.23 | 0.359 | 0.398 | 0.823 | 0.974 | 0.724 | 0.613 | |||
| WATCH | [-] | 114. | 114. | 135. | 169. | -21.5 | 30.5 | 2.15 | 0.284 | 0.343 | 0.676 | 0.977 | 0.609 | 0.539 |
Download Data |
Period Mean (original grids) [W/m2] |
Model Period Mean (intersection) [W/m2] |
Model Period Mean (complement) [W/m2] |
Benchmark Period Mean (intersection) [W/m2] |
Benchmark Period Mean (complement) [W/m2] |
Bias [W/m2] |
RMSE [W/m2] |
Phase Shift [months] |
Bias Score [1] |
RMSE Score [1] |
Seasonal Cycle Score [1] |
Spatial Distribution Score [1] |
Interannual Variability Score [1] |
Overall Score [1] |
|||
|---|---|---|---|---|---|---|---|---|---|---|---|---|---|---|---|---|---|
| Benchmark | [-] | 121. | |||||||||||||||
| CRUNCEPv7 | [-] | 123. | 122. | 120. | 143. | 2.78 | 18.2 | 0.925 | 0.751 | 0.646 | 0.900 | 0.995 | 0.634 | 0.762 | |||
| GSWP3v1 | [-] | 107. | 107. | 120. | 143. | -12.8 | 22.6 | 0.892 | 0.665 | 0.612 | 0.897 | 0.818 | 0.703 | 0.718 | |||
| WATCH | [-] | 103. | 103. | 115. | 138. | -11.9 | 24.4 | 1.79 | 0.661 | 0.581 | 0.737 | 0.815 | 0.747 | 0.687 |
Download Data |
Period Mean (original grids) [W/m2] |
Model Period Mean (intersection) [W/m2] |
Model Period Mean (complement) [W/m2] |
Benchmark Period Mean (intersection) [W/m2] |
Benchmark Period Mean (complement) [W/m2] |
Bias [W/m2] |
RMSE [W/m2] |
Phase Shift [months] |
Bias Score [1] |
RMSE Score [1] |
Seasonal Cycle Score [1] |
Spatial Distribution Score [1] |
Interannual Variability Score [1] |
Overall Score [1] |
|||
|---|---|---|---|---|---|---|---|---|---|---|---|---|---|---|---|---|---|
| Benchmark | [-] | 98.1 | |||||||||||||||
| CRUNCEPv7 | [-] | 83.8 | 83.4 | 95.8 | 118. | -12.4 | 26.6 | 0.671 | 0.712 | 0.687 | 0.931 | 0.910 | 0.652 | 0.763 | |||
| GSWP3v1 | [-] | 90.4 | 89.8 | 95.8 | 118. | -7.08 | 23.4 | 0.560 | 0.761 | 0.706 | 0.947 | 0.991 | 0.642 | 0.792 | |||
| WATCH | [-] | 87.7 | 87.4 | 91.4 | 111. | -4.79 | 25.9 | 0.726 | 0.711 | 0.682 | 0.921 | 0.946 | 0.695 | 0.773 |
Temporally integrated period mean