Mean State
Download Data |
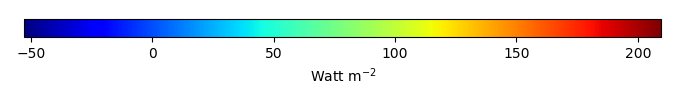
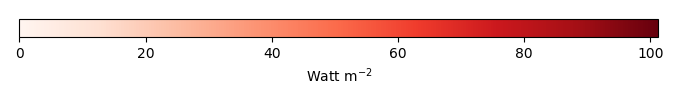
Period Mean (original grids) [Watt m-2] |
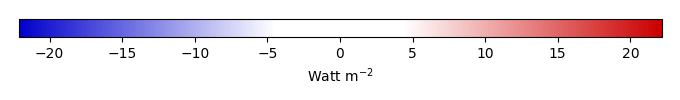
Bias [Watt m-2] |
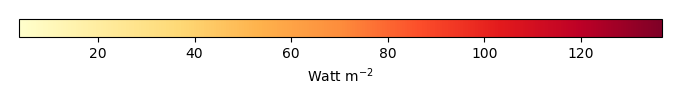
RMSE [Watt m-2] |
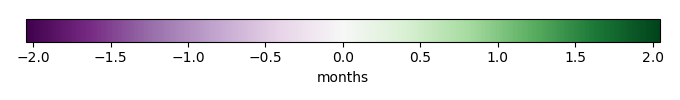
Phase Shift [months] |
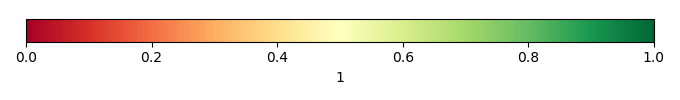
Bias Score [1] |
RMSE Score [1] |
Seasonal Cycle Score [1] |
Interannual Variability Score [1] |
Overall Score [1] |
|||
|---|---|---|---|---|---|---|---|---|---|---|---|---|
| Benchmark | [-] | 202. | ||||||||||
| CRUNCEPv7 | [-] | 187. | -2.68 | 58.4 | 0.00 | 0.239 | 0.387 | 1.00 | 0.171 | 0.437 | ||
| GSWP3v1 | [-] | 187. | 6.38 | 59.0 | 0.00 | 0.225 | 0.385 | 1.00 | 0.169 | 0.433 | ||
| WATCH | [-] | 179. | nan | nan | nan | 0.00 | nan | nan | 0.00 | nan |
Download Data |
Period Mean (original grids) [Watt m-2] |
Bias [Watt m-2] |
RMSE [Watt m-2] |
Phase Shift [months] |
Bias Score [1] |
RMSE Score [1] |
Seasonal Cycle Score [1] |
Interannual Variability Score [1] |
Overall Score [1] |
|||
|---|---|---|---|---|---|---|---|---|---|---|---|---|
| Benchmark | [-] | 69.4 | ||||||||||
| CRUNCEPv7 | [-] | 135. | 53.5 | 79.0 | 0.508 | 0.142 | 0.578 | 0.966 | 0.188 | 0.490 | ||
| GSWP3v1 | [-] | 116. | 38.3 | 66.1 | 0.00 | 0.171 | 0.628 | 1.00 | 0.204 | 0.526 | ||
| WATCH | [-] | 99.9 | 38.4 | 76.0 | 0.508 | 0.182 | 0.592 | 0.966 | 0.193 | 0.505 |
Download Data |
Period Mean (original grids) [Watt m-2] |
Bias [Watt m-2] |
RMSE [Watt m-2] |
Phase Shift [months] |
Bias Score [1] |
RMSE Score [1] |
Seasonal Cycle Score [1] |
Interannual Variability Score [1] |
Overall Score [1] |
|||
|---|---|---|---|---|---|---|---|---|---|---|---|---|
| Benchmark | [-] | 108. | ||||||||||
| CRUNCEPv7 | [-] | 138. | 15.7 | 38.9 | 0.383 | 0.270 | 0.651 | 0.967 | 0.346 | 0.577 | ||
| GSWP3v1 | [-] | 131. | 11.3 | 39.2 | 0.193 | 0.283 | 0.617 | 0.987 | 0.338 | 0.568 | ||
| WATCH | [-] | 124. | 13.0 | 35.8 | 0.511 | 0.236 | 0.683 | 0.949 | 0.334 | 0.577 |
Download Data |
Period Mean (original grids) [Watt m-2] |
Bias [Watt m-2] |
RMSE [Watt m-2] |
Phase Shift [months] |
Bias Score [1] |
RMSE Score [1] |
Seasonal Cycle Score [1] |
Interannual Variability Score [1] |
Overall Score [1] |
|||
|---|---|---|---|---|---|---|---|---|---|---|---|---|
| Benchmark | [-] | 176. | ||||||||||
| CRUNCEPv7 | [-] | 173. | -7.51 | 15.5 | 0.00 | 0.277 | 0.730 | 1.00 | 0.408 | 0.629 | ||
| GSWP3v1 | [-] | 168. | -18.2 | 21.7 | 0.00 | 0.213 | 0.764 | 1.00 | 0.314 | 0.611 | ||
| WATCH | [-] | 151. | -21.8 | 25.4 | 0.00 | 0.189 | 0.778 | 1.00 | 0.500 | 0.649 |
Download Data |
Period Mean (original grids) [Watt m-2] |
Bias [Watt m-2] |
RMSE [Watt m-2] |
Phase Shift [months] |
Bias Score [1] |
RMSE Score [1] |
Seasonal Cycle Score [1] |
Interannual Variability Score [1] |
Overall Score [1] |
|||
|---|---|---|---|---|---|---|---|---|---|---|---|---|
| Benchmark | [-] | 62.8 | ||||||||||
| CRUNCEPv7 | [-] | 56.1 | 3.01 | 63.1 | 0.00 | 0.476 | 0.379 | 1.00 | 0.419 | 0.531 | ||
| GSWP3v1 | [-] | 57.2 | 2.69 | 74.0 | 0.00 | 0.479 | 0.317 | 1.00 | 0.392 | 0.501 | ||
| WATCH | [-] | 47.7 | -6.82 | 37.3 | 0.00 | 0.448 | 0.492 | 1.00 | 0.469 | 0.580 |
Download Data |
Period Mean (original grids) [Watt m-2] |
Bias [Watt m-2] |
RMSE [Watt m-2] |
Phase Shift [months] |
Bias Score [1] |
RMSE Score [1] |
Seasonal Cycle Score [1] |
Interannual Variability Score [1] |
Overall Score [1] |
|||
|---|---|---|---|---|---|---|---|---|---|---|---|---|
| Benchmark | [-] | 135. | ||||||||||
| CRUNCEPv7 | [-] | 154. | 15.2 | 26.0 | 0.407 | 0.540 | 0.774 | 0.973 | 0.668 | 0.746 | ||
| GSWP3v1 | [-] | 144. | 4.36 | 19.5 | 0.203 | 0.607 | 0.784 | 0.987 | 0.652 | 0.763 | ||
| WATCH | [-] | 148. | 11.5 | 20.1 | 0.762 | 0.473 | 0.792 | 0.920 | 0.544 | 0.704 |
Download Data |
Period Mean (original grids) [Watt m-2] |
Bias [Watt m-2] |
RMSE [Watt m-2] |
Phase Shift [months] |
Bias Score [1] |
RMSE Score [1] |
Seasonal Cycle Score [1] |
Interannual Variability Score [1] |
Overall Score [1] |
|||
|---|---|---|---|---|---|---|---|---|---|---|---|---|
| Benchmark | [-] | 151. | ||||||||||
| CRUNCEPv7 | [-] | 152. | 1.20 | 16.2 | 0.00 | 0.915 | 0.812 | 1.00 | 0.937 | 0.895 | ||
| GSWP3v1 | [-] | 155. | 3.59 | 15.4 | 0.00 | 0.939 | 0.807 | 1.00 | 0.935 | 0.898 | ||
| WATCH | [-] | 156. | 5.57 | 15.6 | 0.00 | 0.924 | 0.816 | 1.00 | 0.936 | 0.898 |
Temporally integrated period mean