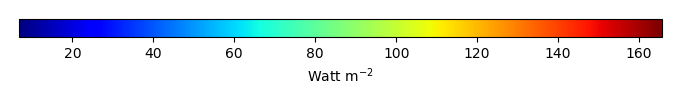
Mean State
Download Data |
Period Mean (original grids) [Watt m-2] |
Model Period Mean (intersection) [Watt m-2] |
Model Period Mean (complement) [Watt m-2] |
Benchmark Period Mean (intersection) [Watt m-2] |
Benchmark Period Mean (complement) [Watt m-2] |
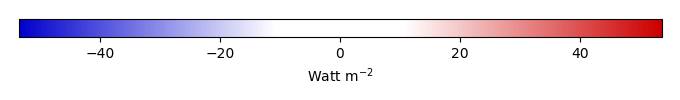
Bias [Watt m-2] |
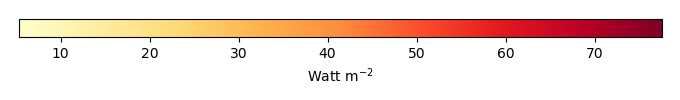
RMSE [Watt m-2] |
Phase Shift [months] |
Bias Score [1] |
RMSE Score [1] |
Seasonal Cycle Score [1] |
Spatial Distribution Score [1] |
Interannual Variability Score [1] |
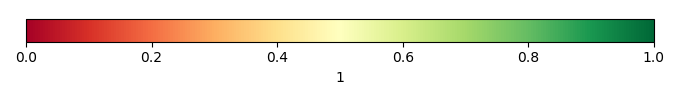
Overall Score [1] |
|||
|---|---|---|---|---|---|---|---|---|---|---|---|---|---|---|---|---|---|
| Benchmark | [-] | 38.3 | |||||||||||||||
| CRUNCEPv7 | [-] | 36.3 | 36.0 | 39.6 | 15.5 | -3.01 | 10.6 | 1.70 | 0.383 | 0.372 | 0.724 | 0.954 | 0.476 | 0.547 | |||
| GSWP3v1 | [-] | 33.9 | 33.6 | 39.6 | 15.5 | -5.32 | 11.4 | 1.57 | 0.312 | 0.367 | 0.754 | 0.980 | 0.532 | 0.552 | |||
| WATCH | [-] | 26.4 | 26.1 | 39.8 | 15.2 | -12.9 | 17.5 | 2.43 | 0.126 | 0.335 | 0.592 | 0.919 | 0.531 | 0.473 |
Download Data |
Period Mean (original grids) [Watt m-2] |
Model Period Mean (intersection) [Watt m-2] |
Model Period Mean (complement) [Watt m-2] |
Benchmark Period Mean (intersection) [Watt m-2] |
Benchmark Period Mean (complement) [Watt m-2] |
Bias [Watt m-2] |
RMSE [Watt m-2] |
Phase Shift [months] |
Bias Score [1] |
RMSE Score [1] |
Seasonal Cycle Score [1] |
Spatial Distribution Score [1] |
Interannual Variability Score [1] |
Overall Score [1] |
|||
|---|---|---|---|---|---|---|---|---|---|---|---|---|---|---|---|---|---|
| Benchmark | [-] | 52.3 | |||||||||||||||
| CRUNCEPv7 | [-] | 47.2 | 47.6 | 52.8 | 14.1 | -5.21 | 13.3 | 1.35 | 0.443 | 0.392 | 0.834 | 0.988 | 0.533 | 0.597 | |||
| GSWP3v1 | [-] | 45.3 | 45.8 | 52.8 | 14.1 | -7.07 | 13.8 | 1.27 | 0.396 | 0.379 | 0.845 | 0.990 | 0.530 | 0.587 | |||
| WATCH | [-] | 37.4 | 37.9 | 53.3 | 14.1 | -15.4 | 20.5 | 1.45 | 0.201 | 0.343 | 0.820 | 0.982 | 0.490 | 0.530 |
Download Data |
Period Mean (original grids) [Watt m-2] |
Model Period Mean (intersection) [Watt m-2] |
Model Period Mean (complement) [Watt m-2] |
Benchmark Period Mean (intersection) [Watt m-2] |
Benchmark Period Mean (complement) [Watt m-2] |
Bias [Watt m-2] |
RMSE [Watt m-2] |
Phase Shift [months] |
Bias Score [1] |
RMSE Score [1] |
Seasonal Cycle Score [1] |
Spatial Distribution Score [1] |
Interannual Variability Score [1] |
Overall Score [1] |
|||
|---|---|---|---|---|---|---|---|---|---|---|---|---|---|---|---|---|---|
| Benchmark | [-] | 39.3 | |||||||||||||||
| CRUNCEPv7 | [-] | 36.9 | 36.9 | 40.4 | 16.6 | -3.30 | 11.9 | 1.76 | 0.411 | 0.407 | 0.729 | 0.912 | 0.558 | 0.570 | |||
| GSWP3v1 | [-] | 36.6 | 36.6 | 40.4 | 16.6 | -3.70 | 12.2 | 1.81 | 0.399 | 0.383 | 0.720 | 0.910 | 0.579 | 0.562 | |||
| WATCH | [-] | 33.4 | 33.4 | 40.6 | 16.5 | -7.14 | 14.5 | 2.01 | 0.283 | 0.373 | 0.692 | 0.959 | 0.573 | 0.542 |
Download Data |
Period Mean (original grids) [Watt m-2] |
Model Period Mean (intersection) [Watt m-2] |
Model Period Mean (complement) [Watt m-2] |
Benchmark Period Mean (intersection) [Watt m-2] |
Benchmark Period Mean (complement) [Watt m-2] |
Bias [Watt m-2] |
RMSE [Watt m-2] |
Phase Shift [months] |
Bias Score [1] |
RMSE Score [1] |
Seasonal Cycle Score [1] |
Spatial Distribution Score [1] |
Interannual Variability Score [1] |
Overall Score [1] |
|||
|---|---|---|---|---|---|---|---|---|---|---|---|---|---|---|---|---|---|
| Benchmark | [-] | 31.6 | |||||||||||||||
| CRUNCEPv7 | [-] | 36.8 | 36.6 | 31.5 | 32.6 | 6.48 | 20.3 | 0.340 | 0.766 | 0.578 | 0.977 | 0.878 | 0.709 | 0.748 | |||
| GSWP3v1 | [-] | 34.3 | 34.2 | 31.5 | 32.6 | 3.60 | 18.0 | 0.327 | 0.799 | 0.589 | 0.978 | 0.972 | 0.759 | 0.781 | |||
| WATCH | [-] | 33.8 | 33.7 | 32.0 | 33.8 | 2.53 | 17.9 | 0.275 | 0.819 | 0.595 | 0.981 | 0.982 | 0.775 | 0.791 |
Download Data |
Period Mean (original grids) [Watt m-2] |
Model Period Mean (intersection) [Watt m-2] |
Model Period Mean (complement) [Watt m-2] |
Benchmark Period Mean (intersection) [Watt m-2] |
Benchmark Period Mean (complement) [Watt m-2] |
Bias [Watt m-2] |
RMSE [Watt m-2] |
Phase Shift [months] |
Bias Score [1] |
RMSE Score [1] |
Seasonal Cycle Score [1] |
Spatial Distribution Score [1] |
Interannual Variability Score [1] |
Overall Score [1] |
|||
|---|---|---|---|---|---|---|---|---|---|---|---|---|---|---|---|---|---|
| Benchmark | [-] | 23.5 | |||||||||||||||
| CRUNCEPv7 | [-] | 29.7 | 29.6 | 25.9 | 15.5 | 4.21 | 11.0 | 2.04 | 0.435 | 0.381 | 0.682 | 0.197 | 0.431 | 0.417 | |||
| GSWP3v1 | [-] | 27.8 | 27.7 | 25.9 | 15.5 | 2.49 | 11.1 | 1.43 | 0.363 | 0.364 | 0.791 | 0.231 | 0.552 | 0.444 | |||
| WATCH | [-] | 22.2 | 22.1 | 25.5 | 15.5 | -2.07 | 12.0 | 1.97 | 0.243 | 0.337 | 0.700 | 0.691 | 0.588 | 0.482 |
Download Data |
Period Mean (original grids) [Watt m-2] |
Model Period Mean (intersection) [Watt m-2] |
Model Period Mean (complement) [Watt m-2] |
Benchmark Period Mean (intersection) [Watt m-2] |
Benchmark Period Mean (complement) [Watt m-2] |
Bias [Watt m-2] |
RMSE [Watt m-2] |
Phase Shift [months] |
Bias Score [1] |
RMSE Score [1] |
Seasonal Cycle Score [1] |
Spatial Distribution Score [1] |
Interannual Variability Score [1] |
Overall Score [1] |
|||
|---|---|---|---|---|---|---|---|---|---|---|---|---|---|---|---|---|---|
| Benchmark | [-] | 21.4 | |||||||||||||||
| CRUNCEPv7 | [-] | 25.5 | 25.4 | 21.5 | 17.6 | 3.83 | 10.8 | 0.499 | 0.726 | 0.521 | 0.942 | 0.869 | 0.703 | 0.714 | |||
| GSWP3v1 | [-] | 25.4 | 25.3 | 21.5 | 17.6 | 3.82 | 12.6 | 0.569 | 0.726 | 0.468 | 0.931 | 0.818 | 0.743 | 0.692 | |||
| WATCH | [-] | 21.5 | 21.4 | 21.3 | 18.0 | 0.134 | 11.1 | 0.586 | 0.773 | 0.485 | 0.927 | 0.843 | 0.714 | 0.705 |
Download Data |
Period Mean (original grids) [Watt m-2] |
Model Period Mean (intersection) [Watt m-2] |
Model Period Mean (complement) [Watt m-2] |
Benchmark Period Mean (intersection) [Watt m-2] |
Benchmark Period Mean (complement) [Watt m-2] |
Bias [Watt m-2] |
RMSE [Watt m-2] |
Phase Shift [months] |
Bias Score [1] |
RMSE Score [1] |
Seasonal Cycle Score [1] |
Spatial Distribution Score [1] |
Interannual Variability Score [1] |
Overall Score [1] |
|||
|---|---|---|---|---|---|---|---|---|---|---|---|---|---|---|---|---|---|
| Benchmark | [-] | 30.0 | |||||||||||||||
| CRUNCEPv7 | [-] | 39.2 | 39.1 | 30.5 | 14.9 | 7.88 | 13.8 | 1.08 | 0.547 | 0.445 | 0.855 | 0.966 | 0.655 | 0.652 | |||
| GSWP3v1 | [-] | 35.3 | 35.3 | 30.5 | 14.9 | 4.16 | 11.4 | 0.960 | 0.671 | 0.469 | 0.872 | 0.973 | 0.670 | 0.687 | |||
| WATCH | [-] | 35.2 | 35.2 | 29.8 | 15.1 | 4.69 | 13.7 | 1.18 | 0.628 | 0.416 | 0.838 | 0.893 | 0.680 | 0.645 |
Download Data |
Period Mean (original grids) [Watt m-2] |
Model Period Mean (intersection) [Watt m-2] |
Model Period Mean (complement) [Watt m-2] |
Benchmark Period Mean (intersection) [Watt m-2] |
Benchmark Period Mean (complement) [Watt m-2] |
Bias [Watt m-2] |
RMSE [Watt m-2] |
Phase Shift [months] |
Bias Score [1] |
RMSE Score [1] |
Seasonal Cycle Score [1] |
Spatial Distribution Score [1] |
Interannual Variability Score [1] |
Overall Score [1] |
|||
|---|---|---|---|---|---|---|---|---|---|---|---|---|---|---|---|---|---|
| Benchmark | [-] | 29.5 | |||||||||||||||
| CRUNCEPv7 | [-] | 37.6 | 37.6 | 30.6 | 14.2 | 6.13 | 12.4 | 0.935 | 0.549 | 0.410 | 0.895 | 0.978 | 0.476 | 0.620 | |||
| GSWP3v1 | [-] | 33.5 | 33.4 | 30.6 | 14.2 | 2.29 | 11.6 | 0.992 | 0.588 | 0.397 | 0.884 | 0.977 | 0.514 | 0.626 | |||
| WATCH | [-] | 30.6 | 30.5 | 29.2 | 14.1 | 0.872 | 12.3 | 1.13 | 0.492 | 0.371 | 0.862 | 0.943 | 0.530 | 0.595 |
Download Data |
Period Mean (original grids) [Watt m-2] |
Model Period Mean (intersection) [Watt m-2] |
Model Period Mean (complement) [Watt m-2] |
Benchmark Period Mean (intersection) [Watt m-2] |
Benchmark Period Mean (complement) [Watt m-2] |
Bias [Watt m-2] |
RMSE [Watt m-2] |
Phase Shift [months] |
Bias Score [1] |
RMSE Score [1] |
Seasonal Cycle Score [1] |
Spatial Distribution Score [1] |
Interannual Variability Score [1] |
Overall Score [1] |
|||
|---|---|---|---|---|---|---|---|---|---|---|---|---|---|---|---|---|---|
| Benchmark | [-] | 33.0 | |||||||||||||||
| CRUNCEPv7 | [-] | 35.1 | 34.9 | 32.8 | 37.1 | 2.86 | 19.3 | 0.271 | 0.806 | 0.600 | 0.982 | 0.984 | 0.647 | 0.770 | |||
| GSWP3v1 | [-] | 32.3 | 32.2 | 32.8 | 37.1 | -0.0780 | 17.2 | 0.288 | 0.824 | 0.610 | 0.981 | 0.848 | 0.728 | 0.767 | |||
| WATCH | [-] | 30.4 | 30.2 | 33.2 | 38.1 | -2.44 | 16.0 | 0.234 | 0.864 | 0.628 | 0.984 | 0.921 | 0.680 | 0.784 |
Download Data |
Period Mean (original grids) [Watt m-2] |
Model Period Mean (intersection) [Watt m-2] |
Model Period Mean (complement) [Watt m-2] |
Benchmark Period Mean (intersection) [Watt m-2] |
Benchmark Period Mean (complement) [Watt m-2] |
Bias [Watt m-2] |
RMSE [Watt m-2] |
Phase Shift [months] |
Bias Score [1] |
RMSE Score [1] |
Seasonal Cycle Score [1] |
Spatial Distribution Score [1] |
Interannual Variability Score [1] |
Overall Score [1] |
|||
|---|---|---|---|---|---|---|---|---|---|---|---|---|---|---|---|---|---|
| Benchmark | [-] | 35.1 | |||||||||||||||
| CRUNCEPv7 | [-] | 40.8 | 40.8 | 36.7 | 14.1 | 3.07 | 10.8 | 0.654 | 0.579 | 0.530 | 0.948 | 0.900 | 0.637 | 0.688 | |||
| GSWP3v1 | [-] | 39.7 | 39.8 | 36.7 | 14.1 | 2.08 | 10.6 | 0.510 | 0.585 | 0.527 | 0.956 | 0.885 | 0.646 | 0.688 | |||
| WATCH | [-] | 40.4 | 40.4 | 36.2 | 14.0 | 3.09 | 10.7 | 0.625 | 0.566 | 0.524 | 0.942 | 0.956 | 0.762 | 0.712 |
Download Data |
Period Mean (original grids) [Watt m-2] |
Model Period Mean (intersection) [Watt m-2] |
Model Period Mean (complement) [Watt m-2] |
Benchmark Period Mean (intersection) [Watt m-2] |
Benchmark Period Mean (complement) [Watt m-2] |
Bias [Watt m-2] |
RMSE [Watt m-2] |
Phase Shift [months] |
Bias Score [1] |
RMSE Score [1] |
Seasonal Cycle Score [1] |
Spatial Distribution Score [1] |
Interannual Variability Score [1] |
Overall Score [1] |
|||
|---|---|---|---|---|---|---|---|---|---|---|---|---|---|---|---|---|---|
| Benchmark | [-] | 19.8 | |||||||||||||||
| CRUNCEPv7 | [-] | 26.8 | 26.9 | 20.7 | 10.0 | 5.61 | 11.4 | 1.02 | 0.622 | 0.523 | 0.888 | 0.973 | 0.675 | 0.701 | |||
| GSWP3v1 | [-] | 22.5 | 22.5 | 20.7 | 10.0 | 1.77 | 10.1 | 1.13 | 0.714 | 0.527 | 0.867 | 0.870 | 0.680 | 0.697 | |||
| WATCH | [-] | 19.3 | 19.3 | 21.0 | 10.1 | -1.72 | 10.6 | 1.05 | 0.657 | 0.529 | 0.872 | 0.849 | 0.689 | 0.687 |
Download Data |
Period Mean (original grids) [Watt m-2] |
Model Period Mean (intersection) [Watt m-2] |
Model Period Mean (complement) [Watt m-2] |
Benchmark Period Mean (intersection) [Watt m-2] |
Benchmark Period Mean (complement) [Watt m-2] |
Bias [Watt m-2] |
RMSE [Watt m-2] |
Phase Shift [months] |
Bias Score [1] |
RMSE Score [1] |
Seasonal Cycle Score [1] |
Spatial Distribution Score [1] |
Interannual Variability Score [1] |
Overall Score [1] |
|||
|---|---|---|---|---|---|---|---|---|---|---|---|---|---|---|---|---|---|
| Benchmark | [-] | 23.6 | |||||||||||||||
| CRUNCEPv7 | [-] | 47.6 | 47.6 | 43.1 | 14.1 | 3.75 | 16.6 | 0.898 | 0.586 | 0.485 | 0.886 | 0.880 | 0.562 | 0.647 | |||
| GSWP3v1 | [-] | 45.0 | 45.0 | 43.1 | 14.1 | 1.14 | 14.4 | 0.858 | 0.624 | 0.492 | 0.887 | 0.876 | 0.604 | 0.663 | |||
| WATCH | [-] | 42.6 | 42.6 | 42.8 | 14.3 | -0.881 | 15.8 | 0.985 | 0.573 | 0.471 | 0.866 | 0.900 | 0.614 | 0.649 |
Download Data |
Period Mean (original grids) [Watt m-2] |
Model Period Mean (intersection) [Watt m-2] |
Model Period Mean (complement) [Watt m-2] |
Benchmark Period Mean (intersection) [Watt m-2] |
Benchmark Period Mean (complement) [Watt m-2] |
Bias [Watt m-2] |
RMSE [Watt m-2] |
Phase Shift [months] |
Bias Score [1] |
RMSE Score [1] |
Seasonal Cycle Score [1] |
Spatial Distribution Score [1] |
Interannual Variability Score [1] |
Overall Score [1] |
|||
|---|---|---|---|---|---|---|---|---|---|---|---|---|---|---|---|---|---|
| Benchmark | [-] | 64.3 | |||||||||||||||
| CRUNCEPv7 | [-] | 81.5 | 81.3 | 66.2 | 16.5 | 13.1 | 21.0 | 0.697 | 0.529 | 0.548 | 0.934 | 0.983 | 0.535 | 0.680 | |||
| GSWP3v1 | [-] | 78.4 | 78.2 | 66.2 | 16.5 | 10.2 | 18.6 | 0.552 | 0.562 | 0.573 | 0.948 | 0.985 | 0.543 | 0.697 | |||
| WATCH | [-] | 70.5 | 70.3 | 65.0 | 16.0 | 3.63 | 17.0 | 0.592 | 0.600 | 0.562 | 0.941 | 0.982 | 0.528 | 0.696 |
Download Data |
Period Mean (original grids) [Watt m-2] |
Model Period Mean (intersection) [Watt m-2] |
Model Period Mean (complement) [Watt m-2] |
Benchmark Period Mean (intersection) [Watt m-2] |
Benchmark Period Mean (complement) [Watt m-2] |
Bias [Watt m-2] |
RMSE [Watt m-2] |
Phase Shift [months] |
Bias Score [1] |
RMSE Score [1] |
Seasonal Cycle Score [1] |
Spatial Distribution Score [1] |
Interannual Variability Score [1] |
Overall Score [1] |
|||
|---|---|---|---|---|---|---|---|---|---|---|---|---|---|---|---|---|---|
| Benchmark | [-] | 34.3 | |||||||||||||||
| CRUNCEPv7 | [-] | 42.0 | 41.9 | 34.2 | 35.0 | 9.42 | 24.2 | 0.362 | 0.711 | 0.561 | 0.973 | 0.945 | 0.675 | 0.737 | |||
| GSWP3v1 | [-] | 37.5 | 37.5 | 34.2 | 35.0 | 4.47 | 18.3 | 0.207 | 0.791 | 0.608 | 0.984 | 0.976 | 0.766 | 0.789 | |||
| WATCH | [-] | 38.8 | 38.7 | 34.6 | 35.8 | 5.42 | 21.9 | 0.205 | 0.768 | 0.557 | 0.983 | 0.982 | 0.779 | 0.771 |
Download Data |
Period Mean (original grids) [Watt m-2] |
Model Period Mean (intersection) [Watt m-2] |
Model Period Mean (complement) [Watt m-2] |
Benchmark Period Mean (intersection) [Watt m-2] |
Benchmark Period Mean (complement) [Watt m-2] |
Bias [Watt m-2] |
RMSE [Watt m-2] |
Phase Shift [months] |
Bias Score [1] |
RMSE Score [1] |
Seasonal Cycle Score [1] |
Spatial Distribution Score [1] |
Interannual Variability Score [1] |
Overall Score [1] |
|||
|---|---|---|---|---|---|---|---|---|---|---|---|---|---|---|---|---|---|
| Benchmark | [-] | 24.8 | |||||||||||||||
| CRUNCEPv7 | [-] | 34.1 | 34.1 | 27.0 | 14.3 | 6.78 | 11.3 | 0.907 | 0.478 | 0.447 | 0.901 | 0.791 | 0.543 | 0.601 | |||
| GSWP3v1 | [-] | 33.8 | 33.8 | 27.0 | 14.3 | 6.58 | 11.1 | 0.872 | 0.518 | 0.438 | 0.909 | 0.852 | 0.586 | 0.624 | |||
| WATCH | [-] | 32.2 | 32.2 | 27.6 | 14.7 | 4.02 | 11.4 | 1.07 | 0.481 | 0.413 | 0.880 | 0.973 | 0.605 | 0.628 |
Download Data |
Period Mean (original grids) [Watt m-2] |
Model Period Mean (intersection) [Watt m-2] |
Model Period Mean (complement) [Watt m-2] |
Benchmark Period Mean (intersection) [Watt m-2] |
Benchmark Period Mean (complement) [Watt m-2] |
Bias [Watt m-2] |
RMSE [Watt m-2] |
Phase Shift [months] |
Bias Score [1] |
RMSE Score [1] |
Seasonal Cycle Score [1] |
Spatial Distribution Score [1] |
Interannual Variability Score [1] |
Overall Score [1] |
|||
|---|---|---|---|---|---|---|---|---|---|---|---|---|---|---|---|---|---|
| Benchmark | [-] | 20.7 | |||||||||||||||
| CRUNCEPv7 | [-] | 30.7 | 30.6 | 21.1 | 12.1 | 9.05 | 12.2 | 1.02 | 0.422 | 0.453 | 0.855 | 0.933 | 0.654 | 0.628 | |||
| GSWP3v1 | [-] | 27.4 | 27.3 | 21.1 | 12.1 | 6.00 | 9.62 | 0.994 | 0.560 | 0.479 | 0.867 | 0.988 | 0.652 | 0.671 | |||
| WATCH | [-] | 30.0 | 29.9 | 22.1 | 12.4 | 7.36 | 12.8 | 1.32 | 0.513 | 0.397 | 0.805 | 0.822 | 0.679 | 0.602 |
Download Data |
Period Mean (original grids) [Watt m-2] |
Model Period Mean (intersection) [Watt m-2] |
Model Period Mean (complement) [Watt m-2] |
Benchmark Period Mean (intersection) [Watt m-2] |
Benchmark Period Mean (complement) [Watt m-2] |
Bias [Watt m-2] |
RMSE [Watt m-2] |
Phase Shift [months] |
Bias Score [1] |
RMSE Score [1] |
Seasonal Cycle Score [1] |
Spatial Distribution Score [1] |
Interannual Variability Score [1] |
Overall Score [1] |
|||
|---|---|---|---|---|---|---|---|---|---|---|---|---|---|---|---|---|---|
| Benchmark | [-] | 20.3 | |||||||||||||||
| CRUNCEPv7 | [-] | 26.2 | 26.3 | 20.6 | 10.6 | 5.71 | 11.9 | 0.662 | 0.607 | 0.512 | 0.916 | 0.830 | 0.644 | 0.670 | |||
| GSWP3v1 | [-] | 23.7 | 23.7 | 20.6 | 10.6 | 3.05 | 10.4 | 0.622 | 0.685 | 0.526 | 0.920 | 0.905 | 0.665 | 0.704 | |||
| WATCH | [-] | 23.4 | 23.5 | 20.9 | 11.2 | 2.65 | 11.6 | 0.683 | 0.658 | 0.487 | 0.908 | 0.860 | 0.671 | 0.678 |
Download Data |
Period Mean (original grids) [Watt m-2] |
Model Period Mean (intersection) [Watt m-2] |
Model Period Mean (complement) [Watt m-2] |
Benchmark Period Mean (intersection) [Watt m-2] |
Benchmark Period Mean (complement) [Watt m-2] |
Bias [Watt m-2] |
RMSE [Watt m-2] |
Phase Shift [months] |
Bias Score [1] |
RMSE Score [1] |
Seasonal Cycle Score [1] |
Spatial Distribution Score [1] |
Interannual Variability Score [1] |
Overall Score [1] |
|||
|---|---|---|---|---|---|---|---|---|---|---|---|---|---|---|---|---|---|
| Benchmark | [-] | 30.8 | |||||||||||||||
| CRUNCEPv7 | [-] | 36.0 | 36.0 | 31.1 | 10.8 | 4.52 | 10.7 | 0.919 | 0.626 | 0.497 | 0.874 | 0.988 | 0.723 | 0.701 | |||
| GSWP3v1 | [-] | 34.2 | 34.2 | 31.1 | 10.8 | 2.76 | 9.44 | 0.757 | 0.701 | 0.515 | 0.903 | 0.994 | 0.728 | 0.726 | |||
| WATCH | [-] | 38.0 | 38.1 | 31.2 | 11.1 | 6.44 | 12.7 | 1.39 | 0.571 | 0.444 | 0.776 | 0.892 | 0.717 | 0.641 |
Download Data |
Period Mean (original grids) [Watt m-2] |
Model Period Mean (intersection) [Watt m-2] |
Model Period Mean (complement) [Watt m-2] |
Benchmark Period Mean (intersection) [Watt m-2] |
Benchmark Period Mean (complement) [Watt m-2] |
Bias [Watt m-2] |
RMSE [Watt m-2] |
Phase Shift [months] |
Bias Score [1] |
RMSE Score [1] |
Seasonal Cycle Score [1] |
Spatial Distribution Score [1] |
Interannual Variability Score [1] |
Overall Score [1] |
|||
|---|---|---|---|---|---|---|---|---|---|---|---|---|---|---|---|---|---|
| Benchmark | [-] | 26.8 | |||||||||||||||
| CRUNCEPv7 | [-] | 28.8 | 28.8 | 27.1 | 15.2 | 1.84 | 8.42 | 1.63 | 0.686 | 0.372 | 0.766 | 0.710 | 0.417 | 0.554 | |||
| GSWP3v1 | [-] | 27.1 | 27.1 | 27.1 | 15.2 | 0.130 | 8.33 | 2.25 | 0.737 | 0.366 | 0.635 | 0.812 | 0.454 | 0.562 | |||
| WATCH | [-] | 23.7 | 23.7 | 28.6 | 15.4 | -4.77 | 10.5 | 2.06 | 0.530 | 0.353 | 0.684 | 0.837 | 0.471 | 0.538 |
Download Data |
Period Mean (original grids) [Watt m-2] |
Model Period Mean (intersection) [Watt m-2] |
Model Period Mean (complement) [Watt m-2] |
Benchmark Period Mean (intersection) [Watt m-2] |
Benchmark Period Mean (complement) [Watt m-2] |
Bias [Watt m-2] |
RMSE [Watt m-2] |
Phase Shift [months] |
Bias Score [1] |
RMSE Score [1] |
Seasonal Cycle Score [1] |
Spatial Distribution Score [1] |
Interannual Variability Score [1] |
Overall Score [1] |
|||
|---|---|---|---|---|---|---|---|---|---|---|---|---|---|---|---|---|---|
| Benchmark | [-] | 29.5 | |||||||||||||||
| CRUNCEPv7 | [-] | 32.7 | 32.6 | 29.9 | 14.5 | 2.75 | 9.25 | 1.19 | 0.693 | 0.452 | 0.843 | 0.687 | 0.495 | 0.604 | |||
| GSWP3v1 | [-] | 31.6 | 31.6 | 29.9 | 14.5 | 1.66 | 8.89 | 1.03 | 0.743 | 0.444 | 0.860 | 0.807 | 0.525 | 0.637 | |||
| WATCH | [-] | 27.6 | 27.6 | 31.2 | 14.8 | -3.52 | 10.5 | 1.30 | 0.589 | 0.426 | 0.818 | 0.708 | 0.531 | 0.583 |
Download Data |
Period Mean (original grids) [Watt m-2] |
Model Period Mean (intersection) [Watt m-2] |
Model Period Mean (complement) [Watt m-2] |
Benchmark Period Mean (intersection) [Watt m-2] |
Benchmark Period Mean (complement) [Watt m-2] |
Bias [Watt m-2] |
RMSE [Watt m-2] |
Phase Shift [months] |
Bias Score [1] |
RMSE Score [1] |
Seasonal Cycle Score [1] |
Spatial Distribution Score [1] |
Interannual Variability Score [1] |
Overall Score [1] |
|||
|---|---|---|---|---|---|---|---|---|---|---|---|---|---|---|---|---|---|
| Benchmark | [-] | 28.0 | |||||||||||||||
| CRUNCEPv7 | [-] | 33.5 | 33.5 | 29.7 | 12.6 | 3.52 | 13.5 | 0.829 | 0.504 | 0.473 | 0.908 | 0.753 | 0.545 | 0.609 | |||
| GSWP3v1 | [-] | 33.1 | 33.1 | 29.7 | 12.6 | 2.96 | 12.0 | 0.745 | 0.573 | 0.484 | 0.918 | 0.930 | 0.579 | 0.661 | |||
| WATCH | [-] | 33.0 | 33.1 | 29.9 | 12.9 | 2.75 | 13.0 | 0.849 | 0.545 | 0.467 | 0.902 | 0.955 | 0.573 | 0.651 |
Temporally integrated period mean