Mean State
Download Data |
Period Mean (original grids) [Pg] |
Model Period Mean (intersection) [Pg] |
Model Period Mean (complement) [Pg] |
Benchmark Period Mean (intersection) [Pg] |
Benchmark Period Mean (complement) [Pg] |
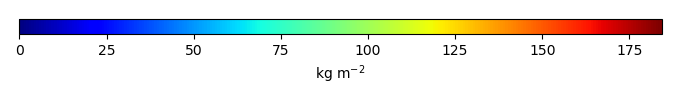
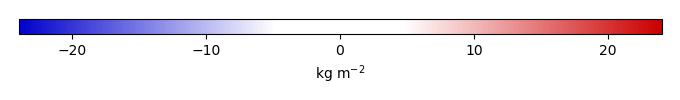
Bias [kg m-2] |
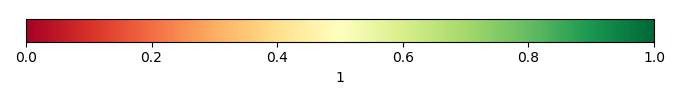
Bias Score [1] |
Spatial Distribution Score [1] |
Overall Score [1] |
|||
|---|---|---|---|---|---|---|---|---|---|---|---|---|
| Benchmark | [-] | 34.1 | ||||||||||
| CRUJRA | [-] | 38.9 | 39.6 | 0.253 | 33.8 | 0.315 | 1.73 | 0.666 | 0.875 | 0.771 | ||
| CRUNCEPv7 | [-] | 41.4 | 42.1 | 0.279 | 33.8 | 0.315 | 2.30 | 0.618 | 0.799 | 0.708 | ||
| GSWP3v1 | [-] | 30.5 | 30.9 | 0.269 | 33.8 | 0.315 | -0.226 | 0.729 | 0.948 | 0.839 | ||
| WATCH | [-] | 25.6 | 26.2 | 0.188 | 33.8 | 0.315 | -1.35 | 0.739 | 0.860 | 0.799 |
Download Data |
Period Mean (original grids) [Pg] |
Model Period Mean (intersection) [Pg] |
Model Period Mean (complement) [Pg] |
Benchmark Period Mean (intersection) [Pg] |
Benchmark Period Mean (complement) [Pg] |
Bias [kg m-2] |
Bias Score [1] |
Spatial Distribution Score [1] |
Overall Score [1] |
|||
|---|---|---|---|---|---|---|---|---|---|---|---|---|
| Benchmark | [-] | 44.8 | ||||||||||
| CRUJRA | [-] | 18.8 | 17.6 | 0.0276 | 44.4 | 0.478 | -3.90 | 0.509 | 0.841 | 0.675 | ||
| CRUNCEPv7 | [-] | 17.5 | 16.5 | 0.0170 | 44.4 | 0.478 | -4.09 | 0.509 | 0.847 | 0.678 | ||
| GSWP3v1 | [-] | 15.3 | 14.4 | 0.0241 | 44.4 | 0.478 | -4.37 | 0.502 | 0.776 | 0.639 | ||
| WATCH | [-] | 17.4 | 16.5 | 0.0314 | 44.4 | 0.478 | -4.07 | 0.530 | 0.819 | 0.674 |
Download Data |
Period Mean (original grids) [Pg] |
Model Period Mean (intersection) [Pg] |
Model Period Mean (complement) [Pg] |
Benchmark Period Mean (intersection) [Pg] |
Benchmark Period Mean (complement) [Pg] |
Bias [kg m-2] |
Bias Score [1] |
Spatial Distribution Score [1] |
Overall Score [1] |
|||
|---|---|---|---|---|---|---|---|---|---|---|---|---|
| Benchmark | [-] | 60.1 | ||||||||||
| CRUJRA | [-] | 46.4 | 45.3 | 0.857 | 59.3 | 0.762 | -1.02 | 0.595 | 0.779 | 0.687 | ||
| CRUNCEPv7 | [-] | 40.1 | 38.8 | 0.989 | 59.3 | 0.762 | -1.70 | 0.587 | 0.785 | 0.686 | ||
| GSWP3v1 | [-] | 28.7 | 27.8 | 0.749 | 59.3 | 0.762 | -2.94 | 0.548 | 0.836 | 0.692 | ||
| WATCH | [-] | 32.4 | 31.6 | 0.679 | 59.3 | 0.762 | -2.57 | 0.592 | 0.878 | 0.735 |
Download Data |
Period Mean (original grids) [Pg] |
Model Period Mean (intersection) [Pg] |
Model Period Mean (complement) [Pg] |
Benchmark Period Mean (intersection) [Pg] |
Benchmark Period Mean (complement) [Pg] |
Bias [kg m-2] |
Bias Score [1] |
Spatial Distribution Score [1] |
Overall Score [1] |
|||
|---|---|---|---|---|---|---|---|---|---|---|---|---|
| Benchmark | [-] | 11.1 | ||||||||||
| CRUJRA | [-] | 182. | 11.7 | 170. | 10.3 | 0.803 | 16.5 | 0.380 | 0.106 | 0.243 | ||
| CRUNCEPv7 | [-] | 248. | 14.7 | 234. | 10.3 | 0.803 | 23.0 | 0.397 | 0.0745 | 0.236 | ||
| GSWP3v1 | [-] | 101. | 9.11 | 91.2 | 10.3 | 0.803 | 7.12 | 0.427 | 0.186 | 0.307 | ||
| WATCH | [-] | 127. | 9.47 | 118. | 10.3 | 0.803 | 10.4 | 0.439 | 0.186 | 0.313 |
Download Data |
Period Mean (original grids) [Pg] |
Model Period Mean (intersection) [Pg] |
Model Period Mean (complement) [Pg] |
Benchmark Period Mean (intersection) [Pg] |
Benchmark Period Mean (complement) [Pg] |
Bias [kg m-2] |
Bias Score [1] |
Spatial Distribution Score [1] |
Overall Score [1] |
|||
|---|---|---|---|---|---|---|---|---|---|---|---|---|
| Benchmark | [-] | 55.7 | ||||||||||
| CRUJRA | [-] | 23.6 | 22.1 | 1.36 | 50.7 | 4.99 | -5.18 | 0.683 | 0.249 | 0.466 | ||
| CRUNCEPv7 | [-] | 25.3 | 23.5 | 1.53 | 50.7 | 4.99 | -4.37 | 0.693 | 0.301 | 0.497 | ||
| GSWP3v1 | [-] | 20.6 | 19.1 | 1.31 | 50.7 | 4.99 | -6.12 | 0.649 | 0.274 | 0.461 | ||
| WATCH | [-] | 18.4 | 17.1 | 1.18 | 50.7 | 4.99 | -7.06 | 0.621 | 0.222 | 0.421 |
Download Data |
Period Mean (original grids) [Pg] |
Model Period Mean (intersection) [Pg] |
Model Period Mean (complement) [Pg] |
Benchmark Period Mean (intersection) [Pg] |
Benchmark Period Mean (complement) [Pg] |
Bias [kg m-2] |
Bias Score [1] |
Spatial Distribution Score [1] |
Overall Score [1] |
|||
|---|---|---|---|---|---|---|---|---|---|---|---|---|
| Benchmark | [-] | 65.6 | ||||||||||
| CRUJRA | [-] | 246. | 83.2 | 157. | 65.2 | 0.461 | 4.72 | 0.659 | 0.882 | 0.770 | ||
| CRUNCEPv7 | [-] | 294. | 93.5 | 195. | 65.2 | 0.461 | 7.25 | 0.621 | 0.942 | 0.781 | ||
| GSWP3v1 | [-] | 133. | 59.0 | 71.0 | 65.2 | 0.461 | -1.06 | 0.711 | 0.837 | 0.774 | ||
| WATCH | [-] | 137. | 45.2 | 88.2 | 65.2 | 0.461 | -4.38 | 0.664 | 0.677 | 0.671 |
Download Data |
Period Mean (original grids) [Pg] |
Model Period Mean (intersection) [Pg] |
Model Period Mean (complement) [Pg] |
Benchmark Period Mean (intersection) [Pg] |
Benchmark Period Mean (complement) [Pg] |
Bias [kg m-2] |
Bias Score [1] |
Spatial Distribution Score [1] |
Overall Score [1] |
|||
|---|---|---|---|---|---|---|---|---|---|---|---|---|
| Benchmark | [-] | 143. | ||||||||||
| CRUJRA | [-] | 116. | 107. | 13.3 | 142. | 0.973 | -1.69 | 0.639 | 0.751 | 0.695 | ||
| CRUNCEPv7 | [-] | 122. | 112. | 14.0 | 141. | 2.09 | -1.29 | 0.660 | 0.741 | 0.700 | ||
| GSWP3v1 | [-] | 91.8 | 88.3 | 5.88 | 141. | 2.09 | -2.73 | 0.621 | 0.909 | 0.765 | ||
| WATCH | [-] | 115. | 102. | 15.5 | 141. | 2.09 | -1.98 | 0.614 | 0.835 | 0.725 |
Download Data |
Period Mean (original grids) [Pg] |
Model Period Mean (intersection) [Pg] |
Model Period Mean (complement) [Pg] |
Benchmark Period Mean (intersection) [Pg] |
Benchmark Period Mean (complement) [Pg] |
Bias [kg m-2] |
Bias Score [1] |
Spatial Distribution Score [1] |
Overall Score [1] |
|||
|---|---|---|---|---|---|---|---|---|---|---|---|---|
| Benchmark | [-] | 58.4 | ||||||||||
| CRUJRA | [-] | 39.8 | 38.3 | 0.905 | 56.8 | 1.57 | -1.61 | 0.674 | 0.814 | 0.744 | ||
| CRUNCEPv7 | [-] | 37.4 | 35.7 | 0.948 | 56.8 | 1.57 | -1.91 | 0.633 | 0.766 | 0.700 | ||
| GSWP3v1 | [-] | 33.0 | 31.1 | 0.855 | 56.8 | 1.57 | -2.67 | 0.656 | 0.862 | 0.759 | ||
| WATCH | [-] | 31.0 | 29.6 | 0.759 | 56.8 | 1.57 | -2.95 | 0.664 | 0.930 | 0.797 |
Download Data |
Period Mean (original grids) [Pg] |
Model Period Mean (intersection) [Pg] |
Model Period Mean (complement) [Pg] |
Benchmark Period Mean (intersection) [Pg] |
Benchmark Period Mean (complement) [Pg] |
Bias [kg m-2] |
Bias Score [1] |
Spatial Distribution Score [1] |
Overall Score [1] |
|||
|---|---|---|---|---|---|---|---|---|---|---|---|---|
| Benchmark | [-] | 7.78 | ||||||||||
| CRUJRA | [-] | 193. | 13.8 | 181. | 7.36 | 0.414 | 27.5 | 0.445 | 0.148 | 0.296 | ||
| CRUNCEPv7 | [-] | 254. | 13.8 | 243. | 7.36 | 0.414 | 26.1 | 0.437 | 0.0664 | 0.252 | ||
| GSWP3v1 | [-] | 119. | 9.41 | 111. | 7.36 | 0.414 | 11.0 | 0.450 | 0.207 | 0.328 | ||
| WATCH | [-] | 84.2 | 7.63 | 77.6 | 7.36 | 0.414 | 7.98 | 0.448 | 0.304 | 0.376 |
Download Data |
Period Mean (original grids) [Pg] |
Model Period Mean (intersection) [Pg] |
Model Period Mean (complement) [Pg] |
Benchmark Period Mean (intersection) [Pg] |
Benchmark Period Mean (complement) [Pg] |
Bias [kg m-2] |
Bias Score [1] |
Spatial Distribution Score [1] |
Overall Score [1] |
|||
|---|---|---|---|---|---|---|---|---|---|---|---|---|
| Benchmark | [-] | 58.9 | ||||||||||
| CRUJRA | [-] | 30.5 | 28.7 | 1.46 | 57.4 | 1.53 | -2.43 | 0.549 | 0.427 | 0.488 | ||
| CRUNCEPv7 | [-] | 30.2 | 28.1 | 1.77 | 57.4 | 1.53 | -2.42 | 0.531 | 0.377 | 0.454 | ||
| GSWP3v1 | [-] | 27.6 | 25.8 | 1.60 | 57.4 | 1.53 | -2.75 | 0.541 | 0.473 | 0.507 | ||
| WATCH | [-] | 25.8 | 24.4 | 1.31 | 57.4 | 1.53 | -3.03 | 0.549 | 0.556 | 0.553 |
Download Data |
Period Mean (original grids) [Pg] |
Model Period Mean (intersection) [Pg] |
Model Period Mean (complement) [Pg] |
Benchmark Period Mean (intersection) [Pg] |
Benchmark Period Mean (complement) [Pg] |
Bias [kg m-2] |
Bias Score [1] |
Spatial Distribution Score [1] |
Overall Score [1] |
|||
|---|---|---|---|---|---|---|---|---|---|---|---|---|
| Benchmark | [-] | 61.8 | ||||||||||
| CRUJRA | [-] | 61.0 | 55.0 | 5.05 | 60.2 | 1.58 | 0.921 | 0.735 | 0.919 | 0.827 | ||
| CRUNCEPv7 | [-] | 67.9 | 60.9 | 5.98 | 60.2 | 1.58 | 2.18 | 0.700 | 0.954 | 0.827 | ||
| GSWP3v1 | [-] | 44.2 | 39.3 | 4.23 | 60.2 | 1.58 | -2.36 | 0.718 | 0.846 | 0.782 | ||
| WATCH | [-] | 33.7 | 30.5 | 2.76 | 60.2 | 1.58 | -4.23 | 0.657 | 0.612 | 0.635 |
Download Data |
Period Mean (original grids) [Pg] |
Model Period Mean (intersection) [Pg] |
Model Period Mean (complement) [Pg] |
Benchmark Period Mean (intersection) [Pg] |
Benchmark Period Mean (complement) [Pg] |
Bias [kg m-2] |
Bias Score [1] |
Spatial Distribution Score [1] |
Overall Score [1] |
|||
|---|---|---|---|---|---|---|---|---|---|---|---|---|
| Benchmark | [-] | 1.09e+03 | ||||||||||
| CRUJRA | [-] | 1.55e+03 | 776. | 772. | 1.03e+03 | 54.5 | -1.28 | 0.632 | 0.585 | 0.609 | ||
| CRUNCEPv7 | [-] | 1.92e+03 | 821. | 1.10e+03 | 1.03e+03 | 55.6 | -0.830 | 0.621 | 0.437 | 0.529 | ||
| GSWP3v1 | [-] | 1.06e+03 | 608. | 446. | 1.03e+03 | 55.6 | -2.80 | 0.621 | 0.752 | 0.686 | ||
| WATCH | [-] | 1.09e+03 | 595. | 491. | 1.03e+03 | 55.6 | -2.95 | 0.619 | 0.744 | 0.681 |
Download Data |
Period Mean (original grids) [Pg] |
Model Period Mean (intersection) [Pg] |
Model Period Mean (complement) [Pg] |
Benchmark Period Mean (intersection) [Pg] |
Benchmark Period Mean (complement) [Pg] |
Bias [kg m-2] |
Bias Score [1] |
Spatial Distribution Score [1] |
Overall Score [1] |
|||
|---|---|---|---|---|---|---|---|---|---|---|---|---|
| Benchmark | [-] | 64.3 | ||||||||||
| CRUJRA | [-] | 18.7 | 18.5 | 0.407 | 63.6 | 0.698 | -2.64 | 0.506 | 0.777 | 0.642 | ||
| CRUNCEPv7 | [-] | 18.3 | 18.0 | 0.405 | 63.6 | 0.726 | -2.65 | 0.500 | 0.760 | 0.630 | ||
| GSWP3v1 | [-] | 14.0 | 13.8 | 0.386 | 63.6 | 0.726 | -2.91 | 0.482 | 0.820 | 0.651 | ||
| WATCH | [-] | 15.6 | 15.4 | 0.362 | 63.6 | 0.726 | -2.83 | 0.490 | 0.812 | 0.651 |
Download Data |
Period Mean (original grids) [Pg] |
Model Period Mean (intersection) [Pg] |
Model Period Mean (complement) [Pg] |
Benchmark Period Mean (intersection) [Pg] |
Benchmark Period Mean (complement) [Pg] |
Bias [kg m-2] |
Bias Score [1] |
Spatial Distribution Score [1] |
Overall Score [1] |
|||
|---|---|---|---|---|---|---|---|---|---|---|---|---|
| Benchmark | [-] | 13.3 | ||||||||||
| CRUJRA | [-] | 190. | 11.1 | 180. | 12.1 | 1.24 | 4.60 | 0.467 | 0.360 | 0.413 | ||
| CRUNCEPv7 | [-] | 326. | 17.3 | 310. | 12.1 | 1.24 | 10.0 | 0.425 | 0.140 | 0.283 | ||
| GSWP3v1 | [-] | 123. | 8.60 | 114. | 12.1 | 1.24 | -0.123 | 0.473 | 0.574 | 0.524 | ||
| WATCH | [-] | 154. | 9.88 | 144. | 12.1 | 1.24 | 2.12 | 0.499 | 0.316 | 0.407 |
Download Data |
Period Mean (original grids) [Pg] |
Model Period Mean (intersection) [Pg] |
Model Period Mean (complement) [Pg] |
Benchmark Period Mean (intersection) [Pg] |
Benchmark Period Mean (complement) [Pg] |
Bias [kg m-2] |
Bias Score [1] |
Spatial Distribution Score [1] |
Overall Score [1] |
|||
|---|---|---|---|---|---|---|---|---|---|---|---|---|
| Benchmark | [-] | 42.5 | ||||||||||
| CRUJRA | [-] | 18.6 | 17.2 | 0.887 | 40.2 | 2.26 | -4.96 | 0.581 | 0.774 | 0.677 | ||
| CRUNCEPv7 | [-] | 21.0 | 19.3 | 1.14 | 40.2 | 2.26 | -3.97 | 0.574 | 0.835 | 0.704 | ||
| GSWP3v1 | [-] | 16.9 | 15.5 | 0.942 | 40.2 | 2.26 | -5.56 | 0.571 | 0.733 | 0.652 | ||
| WATCH | [-] | 15.4 | 14.3 | 0.741 | 40.2 | 2.26 | -6.18 | 0.564 | 0.649 | 0.607 |
Download Data |
Period Mean (original grids) [Pg] |
Model Period Mean (intersection) [Pg] |
Model Period Mean (complement) [Pg] |
Benchmark Period Mean (intersection) [Pg] |
Benchmark Period Mean (complement) [Pg] |
Bias [kg m-2] |
Bias Score [1] |
Spatial Distribution Score [1] |
Overall Score [1] |
|||
|---|---|---|---|---|---|---|---|---|---|---|---|---|
| Benchmark | [-] | 45.3 | ||||||||||
| CRUJRA | [-] | 39.8 | 38.8 | 0.367 | 44.4 | 0.888 | -0.902 | 0.763 | 0.759 | 0.761 | ||
| CRUNCEPv7 | [-] | 42.8 | 41.7 | 0.410 | 44.4 | 0.888 | -0.109 | 0.748 | 0.836 | 0.792 | ||
| GSWP3v1 | [-] | 32.2 | 31.2 | 0.326 | 44.4 | 0.888 | -2.77 | 0.722 | 0.773 | 0.747 | ||
| WATCH | [-] | 31.5 | 30.6 | 0.272 | 44.4 | 0.888 | -2.98 | 0.725 | 0.707 | 0.716 |
Download Data |
Period Mean (original grids) [Pg] |
Model Period Mean (intersection) [Pg] |
Model Period Mean (complement) [Pg] |
Benchmark Period Mean (intersection) [Pg] |
Benchmark Period Mean (complement) [Pg] |
Bias [kg m-2] |
Bias Score [1] |
Spatial Distribution Score [1] |
Overall Score [1] |
|||
|---|---|---|---|---|---|---|---|---|---|---|---|---|
| Benchmark | [-] | 51.3 | ||||||||||
| CRUJRA | [-] | 103. | 49.8 | 52.6 | 49.6 | 1.76 | 0.823 | 0.654 | 0.877 | 0.766 | ||
| CRUNCEPv7 | [-] | 145. | 61.9 | 81.7 | 49.6 | 1.76 | 4.53 | 0.624 | 0.721 | 0.672 | ||
| GSWP3v1 | [-] | 75.2 | 39.4 | 36.1 | 49.6 | 1.76 | -2.45 | 0.632 | 0.880 | 0.756 | ||
| WATCH | [-] | 68.6 | 36.5 | 32.5 | 49.6 | 1.76 | -3.38 | 0.621 | 0.890 | 0.755 |
Download Data |
Period Mean (original grids) [Pg] |
Model Period Mean (intersection) [Pg] |
Model Period Mean (complement) [Pg] |
Benchmark Period Mean (intersection) [Pg] |
Benchmark Period Mean (complement) [Pg] |
Bias [kg m-2] |
Bias Score [1] |
Spatial Distribution Score [1] |
Overall Score [1] |
|||
|---|---|---|---|---|---|---|---|---|---|---|---|---|
| Benchmark | [-] | 34.3 | ||||||||||
| CRUJRA | [-] | 12.6 | 12.8 | 0.434 | 34.0 | 0.216 | -5.11 | 0.544 | 0.848 | 0.696 | ||
| CRUNCEPv7 | [-] | 12.9 | 13.1 | 0.522 | 34.0 | 0.216 | -5.04 | 0.549 | 0.830 | 0.689 | ||
| GSWP3v1 | [-] | 11.5 | 11.8 | 0.377 | 34.0 | 0.216 | -5.39 | 0.539 | 0.874 | 0.706 | ||
| WATCH | [-] | 12.5 | 12.7 | 0.489 | 34.0 | 0.216 | -5.19 | 0.539 | 0.859 | 0.699 |
Download Data |
Period Mean (original grids) [Pg] |
Model Period Mean (intersection) [Pg] |
Model Period Mean (complement) [Pg] |
Benchmark Period Mean (intersection) [Pg] |
Benchmark Period Mean (complement) [Pg] |
Bias [kg m-2] |
Bias Score [1] |
Spatial Distribution Score [1] |
Overall Score [1] |
|||
|---|---|---|---|---|---|---|---|---|---|---|---|---|
| Benchmark | [-] | 101. | ||||||||||
| CRUJRA | [-] | 84.2 | 83.3 | 0.372 | 100. | 0.811 | -1.50 | 0.728 | 0.434 | 0.581 | ||
| CRUNCEPv7 | [-] | 86.4 | 85.4 | 0.425 | 100. | 0.811 | -1.19 | 0.725 | 0.587 | 0.656 | ||
| GSWP3v1 | [-] | 68.5 | 67.8 | 0.372 | 100. | 0.811 | -3.35 | 0.692 | 0.464 | 0.578 | ||
| WATCH | [-] | 69.1 | 68.4 | 0.317 | 100. | 0.811 | -3.30 | 0.708 | 0.329 | 0.519 |
Download Data |
Period Mean (original grids) [Pg] |
Model Period Mean (intersection) [Pg] |
Model Period Mean (complement) [Pg] |
Benchmark Period Mean (intersection) [Pg] |
Benchmark Period Mean (complement) [Pg] |
Bias [kg m-2] |
Bias Score [1] |
Spatial Distribution Score [1] |
Overall Score [1] |
|||
|---|---|---|---|---|---|---|---|---|---|---|---|---|
| Benchmark | [-] | 60.7 | ||||||||||
| CRUJRA | [-] | 64.1 | 64.6 | 0.499 | 60.4 | 0.300 | 1.12 | 0.671 | 0.903 | 0.787 | ||
| CRUNCEPv7 | [-] | 62.6 | 63.0 | 0.653 | 60.4 | 0.300 | 1.03 | 0.652 | 0.913 | 0.783 | ||
| GSWP3v1 | [-] | 47.2 | 47.5 | 0.479 | 60.4 | 0.300 | -1.44 | 0.672 | 0.836 | 0.754 | ||
| WATCH | [-] | 48.4 | 48.9 | 0.413 | 60.4 | 0.300 | -1.30 | 0.689 | 0.802 | 0.746 |
Download Data |
Period Mean (original grids) [Pg] |
Model Period Mean (intersection) [Pg] |
Model Period Mean (complement) [Pg] |
Benchmark Period Mean (intersection) [Pg] |
Benchmark Period Mean (complement) [Pg] |
Bias [kg m-2] |
Bias Score [1] |
Spatial Distribution Score [1] |
Overall Score [1] |
|||
|---|---|---|---|---|---|---|---|---|---|---|---|---|
| Benchmark | [-] | 29.6 | ||||||||||
| CRUJRA | [-] | 14.9 | 14.2 | 0.245 | 28.2 | 1.46 | -3.15 | 0.551 | 0.721 | 0.636 | ||
| CRUNCEPv7 | [-] | 17.7 | 16.8 | 0.278 | 28.2 | 1.46 | -2.29 | 0.558 | 0.730 | 0.644 | ||
| GSWP3v1 | [-] | 15.7 | 14.8 | 0.272 | 28.2 | 1.46 | -3.23 | 0.571 | 0.493 | 0.532 | ||
| WATCH | [-] | 15.3 | 14.5 | 0.227 | 28.2 | 1.46 | -3.44 | 0.561 | 0.510 | 0.536 |
Temporally integrated period mean