Mean State
Download Data |
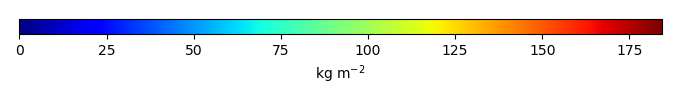
Period Mean (original grids) [Pg] |
Model Period Mean (intersection) [Pg] |
Model Period Mean (complement) [Pg] |
Benchmark Period Mean (intersection) [Pg] |
Benchmark Period Mean (complement) [Pg] |
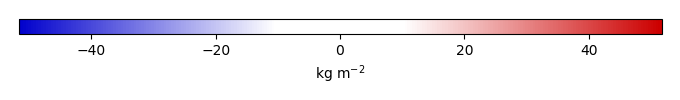
Bias [kg m-2] |
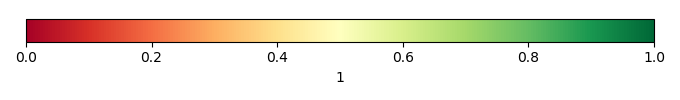
Bias Score [1] |
Spatial Distribution Score [1] |
Overall Score [1] |
|||
|---|---|---|---|---|---|---|---|---|---|---|---|---|
| Benchmark | [-] | 76.5 | ||||||||||
| CRUJRA | [-] | 182. | 167. | 14.2 | 76.1 | 0.362 | 34.4 | 0.356 | 0.125 | 0.240 | ||
| CRUNCEPv7 | [-] | 248. | 232. | 16.7 | 76.1 | 0.362 | 57.1 | 0.241 | 0.0749 | 0.158 | ||
| GSWP3v1 | [-] | 101. | 90.3 | 10.0 | 76.1 | 0.362 | 6.17 | 0.533 | 0.297 | 0.415 | ||
| WATCH | [-] | 127. | 116. | 10.9 | 76.1 | 0.362 | 16.0 | 0.465 | 0.253 | 0.359 |
Download Data |
Period Mean (original grids) [Pg] |
Model Period Mean (intersection) [Pg] |
Model Period Mean (complement) [Pg] |
Benchmark Period Mean (intersection) [Pg] |
Benchmark Period Mean (complement) [Pg] |
Bias [kg m-2] |
Bias Score [1] |
Spatial Distribution Score [1] |
Overall Score [1] |
|||
|---|---|---|---|---|---|---|---|---|---|---|---|---|
| Benchmark | [-] | 113. | ||||||||||
| CRUJRA | [-] | 246. | 157. | 83.9 | 113. | 0.00185 | 8.93 | 0.604 | 0.841 | 0.722 | ||
| CRUNCEPv7 | [-] | 294. | 194. | 94.1 | 113. | 0.00185 | 16.5 | 0.520 | 0.552 | 0.536 | ||
| GSWP3v1 | [-] | 133. | 70.5 | 59.6 | 113. | 0.00185 | -9.00 | 0.560 | 0.825 | 0.693 | ||
| WATCH | [-] | 137. | 87.7 | 45.7 | 113. | 0.00185 | -5.38 | 0.644 | 0.747 | 0.696 |
Download Data |
Period Mean (original grids) [Pg] |
Model Period Mean (intersection) [Pg] |
Model Period Mean (complement) [Pg] |
Benchmark Period Mean (intersection) [Pg] |
Benchmark Period Mean (complement) [Pg] |
Bias [kg m-2] |
Bias Score [1] |
Spatial Distribution Score [1] |
Overall Score [1] |
|||
|---|---|---|---|---|---|---|---|---|---|---|---|---|
| Benchmark | [-] | 12.2 | ||||||||||
| CRUJRA | [-] | 116. | 12.6 | 107. | 12.2 | 0.951 | 0.609 | 0.363 | 0.486 | |||
| CRUNCEPv7 | [-] | 122. | 13.3 | 113. | 12.2 | 1.52 | 0.534 | 0.265 | 0.400 | |||
| GSWP3v1 | [-] | 91.8 | 5.31 | 88.9 | 12.2 | -6.98 | 0.546 | 0.822 | 0.684 | |||
| WATCH | [-] | 115. | 15.0 | 102. | 12.2 | 2.54 | 0.616 | 0.513 | 0.564 |
Download Data |
Period Mean (original grids) [Pg] |
Model Period Mean (intersection) [Pg] |
Model Period Mean (complement) [Pg] |
Benchmark Period Mean (intersection) [Pg] |
Benchmark Period Mean (complement) [Pg] |
Bias [kg m-2] |
Bias Score [1] |
Spatial Distribution Score [1] |
Overall Score [1] |
|||
|---|---|---|---|---|---|---|---|---|---|---|---|---|
| Benchmark | [-] | 97.3 | ||||||||||
| CRUJRA | [-] | 193. | 180. | 15.3 | 97.2 | 0.0996 | 26.9 | 0.484 | 0.237 | 0.360 | ||
| CRUNCEPv7 | [-] | 254. | 242. | 14.9 | 97.2 | 0.0996 | 46.5 | 0.406 | 0.104 | 0.255 | ||
| GSWP3v1 | [-] | 119. | 110. | 10.0 | 97.2 | 0.0996 | 4.55 | 0.545 | 0.395 | 0.470 | ||
| WATCH | [-] | 84.2 | 76.8 | 8.49 | 97.2 | 0.0996 | -6.18 | 0.583 | 0.641 | 0.612 |
Download Data |
Period Mean (original grids) [Pg] |
Model Period Mean (intersection) [Pg] |
Model Period Mean (complement) [Pg] |
Benchmark Period Mean (intersection) [Pg] |
Benchmark Period Mean (complement) [Pg] |
Bias [kg m-2] |
Bias Score [1] |
Spatial Distribution Score [1] |
Overall Score [1] |
|||
|---|---|---|---|---|---|---|---|---|---|---|---|---|
| Benchmark | [-] | 5.12 | ||||||||||
| CRUJRA | [-] | 61.0 | 4.01 | 56.1 | 5.12 | -4.22 | 0.659 | 0.686 | 0.672 | |||
| CRUNCEPv7 | [-] | 67.9 | 4.90 | 62.0 | 5.12 | -0.930 | 0.698 | 0.894 | 0.796 | |||
| GSWP3v1 | [-] | 44.2 | 3.46 | 40.1 | 5.12 | -6.30 | 0.638 | 0.616 | 0.627 | |||
| WATCH | [-] | 33.7 | 2.09 | 31.1 | 5.12 | -11.3 | 0.535 | 0.486 | 0.511 |
Download Data |
Period Mean (original grids) [Pg] |
Model Period Mean (intersection) [Pg] |
Model Period Mean (complement) [Pg] |
Benchmark Period Mean (intersection) [Pg] |
Benchmark Period Mean (complement) [Pg] |
Bias [kg m-2] |
Bias Score [1] |
Spatial Distribution Score [1] |
Overall Score [1] |
|||
|---|---|---|---|---|---|---|---|---|---|---|---|---|
| Benchmark | [-] | 475. | ||||||||||
| CRUJRA | [-] | 1.55e+03 | 754. | 795. | 474. | 1.51 | 13.1 | 0.510 | 0.374 | 0.442 | ||
| CRUNCEPv7 | [-] | 1.92e+03 | 1.08e+03 | 836. | 474. | 1.51 | 27.6 | 0.429 | 0.188 | 0.308 | ||
| GSWP3v1 | [-] | 1.06e+03 | 433. | 622. | 474. | 1.51 | -1.41 | 0.534 | 0.642 | 0.588 | ||
| WATCH | [-] | 1.09e+03 | 478. | 608. | 474. | 1.51 | 0.756 | 0.559 | 0.503 | 0.531 |
Download Data |
Period Mean (original grids) [Pg] |
Model Period Mean (intersection) [Pg] |
Model Period Mean (complement) [Pg] |
Benchmark Period Mean (intersection) [Pg] |
Benchmark Period Mean (complement) [Pg] |
Bias [kg m-2] |
Bias Score [1] |
Spatial Distribution Score [1] |
Overall Score [1] |
|||
|---|---|---|---|---|---|---|---|---|---|---|---|---|
| Benchmark | [-] | 116. | ||||||||||
| CRUJRA | [-] | 190. | 179. | 11.5 | 116. | 0.373 | 12.2 | 0.494 | 0.365 | 0.430 | ||
| CRUNCEPv7 | [-] | 326. | 313. | 14.0 | 116. | 0.373 | 34.5 | 0.413 | 0.146 | 0.279 | ||
| GSWP3v1 | [-] | 123. | 115. | 7.60 | 116. | 0.373 | 0.749 | 0.492 | 0.623 | 0.557 | ||
| WATCH | [-] | 154. | 145. | 8.77 | 116. | 0.373 | 6.01 | 0.506 | 0.296 | 0.401 |
Download Data |
Period Mean (original grids) [Pg] |
Model Period Mean (intersection) [Pg] |
Model Period Mean (complement) [Pg] |
Benchmark Period Mean (intersection) [Pg] |
Benchmark Period Mean (complement) [Pg] |
Bias [kg m-2] |
Bias Score [1] |
Spatial Distribution Score [1] |
Overall Score [1] |
|||
|---|---|---|---|---|---|---|---|---|---|---|---|---|
| Benchmark | [-] | 0.0131 | ||||||||||
| CRUJRA | [-] | 39.8 | 0.0237 | 39.1 | 0.0131 | 4.81 | 0.442 | 1.30e-20 | 0.221 | |||
| CRUNCEPv7 | [-] | 42.8 | 0.0285 | 42.1 | 0.0131 | 6.98 | 0.306 | 3.26e-20 | 0.153 | |||
| GSWP3v1 | [-] | 32.2 | 0.0178 | 31.5 | 0.0131 | 2.19 | 0.692 | 2.46e-23 | 0.346 | |||
| WATCH | [-] | 31.5 | 0.0166 | 30.9 | 0.0131 | 1.63 | 0.759 | 2.98e-22 | 0.380 |
Download Data |
Period Mean (original grids) [Pg] |
Model Period Mean (intersection) [Pg] |
Model Period Mean (complement) [Pg] |
Benchmark Period Mean (intersection) [Pg] |
Benchmark Period Mean (complement) [Pg] |
Bias [kg m-2] |
Bias Score [1] |
Spatial Distribution Score [1] |
Overall Score [1] |
|||
|---|---|---|---|---|---|---|---|---|---|---|---|---|
| Benchmark | [-] | 46.1 | ||||||||||
| CRUJRA | [-] | 103. | 52.5 | 49.9 | 46.1 | 0.00725 | 2.79 | 0.601 | 0.872 | 0.737 | ||
| CRUNCEPv7 | [-] | 145. | 81.7 | 61.9 | 46.1 | 0.00725 | 16.6 | 0.544 | 0.683 | 0.614 | ||
| GSWP3v1 | [-] | 75.2 | 36.0 | 39.5 | 46.1 | 0.00725 | -4.90 | 0.560 | 0.579 | 0.570 | ||
| WATCH | [-] | 68.6 | 32.4 | 36.6 | 46.1 | 0.00725 | -6.67 | 0.585 | 0.489 | 0.537 |
Download Data |
Period Mean (original grids) [Pg] |
Model Period Mean (intersection) [Pg] |
Model Period Mean (complement) [Pg] |
Benchmark Period Mean (intersection) [Pg] |
Benchmark Period Mean (complement) [Pg] |
Bias [kg m-2] |
Bias Score [1] |
Spatial Distribution Score [1] |
Overall Score [1] |
|||
|---|---|---|---|---|---|---|---|---|---|---|---|---|
| Benchmark | [-] | 0.232 | ||||||||||
| CRUJRA | [-] | 12.6 | 0.322 | 13.0 | 0.232 | 0.810 | 0.526 | 0.800 | 0.663 | |||
| CRUNCEPv7 | [-] | 12.9 | 0.398 | 13.2 | 0.232 | 1.94 | 0.597 | 0.713 | 0.655 | |||
| GSWP3v1 | [-] | 11.5 | 0.289 | 11.9 | 0.232 | 0.143 | 0.533 | 0.808 | 0.671 | |||
| WATCH | [-] | 12.5 | 0.397 | 12.8 | 0.232 | 1.89 | 0.531 | 0.778 | 0.655 |
Temporally integrated period mean