Mean State
Download Data |
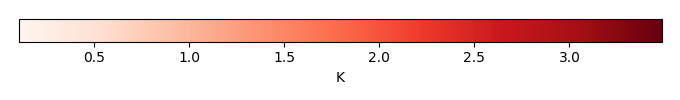
Period Mean (original grids) [K] |
Model Period Mean (intersection) [K] |
Model Period Mean (complement) [K] |
Benchmark Period Mean (intersection) [K] |
Benchmark Period Mean (complement) [K] |
Bias [K] |
RMSE [K] |
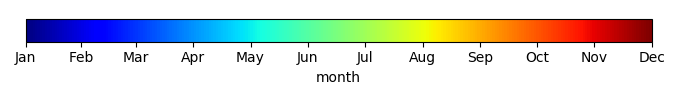
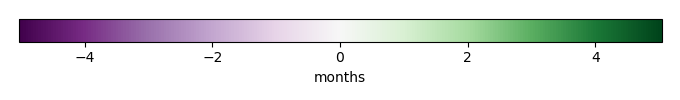
Phase Shift [months] |
Bias Score [1] |
RMSE Score [1] |
Seasonal Cycle Score [1] |
Spatial Distribution Score [1] |
Interannual Variability Score [1] |
Overall Score [1] |
|||
|---|---|---|---|---|---|---|---|---|---|---|---|---|---|---|---|---|---|
| Benchmark | [-] | 293. | |||||||||||||||
| CRUJRA | [-] | 295. | 295. | 298. | 293. | 296. | 1.97 | 2.19 | 0.781 | 0.201 | 0.510 | 0.901 | 0.995 | 0.797 | 0.652 | ||
| CRUNCEPv7 | [-] | 295. | 295. | 298. | 293. | 296. | 2.11 | 2.33 | 0.941 | 0.192 | 0.491 | 0.882 | 1.00 | 0.802 | 0.643 | ||
| GSWP3v1 | [-] | 294. | 293. | 297. | 293. | 296. | 0.843 | 1.30 | 0.638 | 0.446 | 0.486 | 0.928 | 0.997 | 0.773 | 0.686 | ||
| WATCH | [-] | 294. | 294. | 297. | 293. | 296. | 1.69 | 2.03 | 0.585 | 0.225 | 0.429 | 0.932 | 0.997 | 0.735 | 0.625 |
Download Data |
Period Mean (original grids) [K] |
Model Period Mean (intersection) [K] |
Model Period Mean (complement) [K] |
Benchmark Period Mean (intersection) [K] |
Benchmark Period Mean (complement) [K] |
Bias [K] |
RMSE [K] |
Phase Shift [months] |
Bias Score [1] |
RMSE Score [1] |
Seasonal Cycle Score [1] |
Spatial Distribution Score [1] |
Interannual Variability Score [1] |
Overall Score [1] |
|||
|---|---|---|---|---|---|---|---|---|---|---|---|---|---|---|---|---|---|
| Benchmark | [-] | 293. | |||||||||||||||
| CRUJRA | [-] | 295. | 295. | 298. | 293. | 294. | 2.57 | 2.76 | 0.229 | 0.395 | 0.715 | 0.979 | 0.989 | 0.849 | 0.773 | ||
| CRUNCEPv7 | [-] | 295. | 295. | 297. | 293. | 294. | 2.04 | 2.64 | 0.306 | 0.479 | 0.628 | 0.972 | 0.961 | 0.891 | 0.760 | ||
| GSWP3v1 | [-] | 294. | 294. | 296. | 293. | 294. | 1.17 | 1.50 | 0.181 | 0.620 | 0.750 | 0.985 | 0.987 | 0.860 | 0.825 | ||
| WATCH | [-] | 295. | 295. | 296. | 293. | 294. | 1.81 | 2.22 | 0.260 | 0.491 | 0.668 | 0.976 | 0.998 | 0.891 | 0.782 |
Download Data |
Period Mean (original grids) [K] |
Model Period Mean (intersection) [K] |
Model Period Mean (complement) [K] |
Benchmark Period Mean (intersection) [K] |
Benchmark Period Mean (complement) [K] |
Bias [K] |
RMSE [K] |
Phase Shift [months] |
Bias Score [1] |
RMSE Score [1] |
Seasonal Cycle Score [1] |
Spatial Distribution Score [1] |
Interannual Variability Score [1] |
Overall Score [1] |
|||
|---|---|---|---|---|---|---|---|---|---|---|---|---|---|---|---|---|---|
| Benchmark | [-] | 288. | |||||||||||||||
| CRUJRA | [-] | 291. | 291. | 294. | 288. | 293. | 2.43 | 2.66 | 0.720 | 0.454 | 0.765 | 0.908 | 0.994 | 0.872 | 0.793 | ||
| CRUNCEPv7 | [-] | 291. | 291. | 294. | 288. | 293. | 2.48 | 2.67 | 0.888 | 0.446 | 0.742 | 0.881 | 0.999 | 0.829 | 0.773 | ||
| GSWP3v1 | [-] | 289. | 289. | 293. | 288. | 293. | 1.00 | 1.36 | 0.598 | 0.662 | 0.786 | 0.927 | 1.00 | 0.839 | 0.834 | ||
| WATCH | [-] | 290. | 290. | 292. | 288. | 293. | 1.35 | 1.85 | 0.588 | 0.585 | 0.736 | 0.926 | 0.999 | 0.850 | 0.806 |
Download Data |
Period Mean (original grids) [K] |
Model Period Mean (intersection) [K] |
Model Period Mean (complement) [K] |
Benchmark Period Mean (intersection) [K] |
Benchmark Period Mean (complement) [K] |
Bias [K] |
RMSE [K] |
Phase Shift [months] |
Bias Score [1] |
RMSE Score [1] |
Seasonal Cycle Score [1] |
Spatial Distribution Score [1] |
Interannual Variability Score [1] |
Overall Score [1] |
|||
|---|---|---|---|---|---|---|---|---|---|---|---|---|---|---|---|---|---|
| Benchmark | [-] | 257. | |||||||||||||||
| CRUJRA | [-] | 257. | 257. | 261. | 256. | 261. | 0.574 | 1.70 | 0.0315 | 0.930 | 0.926 | 0.998 | 0.991 | 0.864 | 0.939 | ||
| CRUNCEPv7 | [-] | 257. | 256. | 261. | 256. | 261. | 0.587 | 1.91 | 0.0676 | 0.933 | 0.906 | 0.995 | 0.999 | 0.888 | 0.938 | ||
| GSWP3v1 | [-] | 256. | 256. | 264. | 256. | 261. | 0.394 | 1.75 | 0.0380 | 0.932 | 0.918 | 0.997 | 0.999 | 0.908 | 0.945 | ||
| WATCH | [-] | 256. | 256. | 260. | 256. | 261. | -0.0449 | 1.91 | 0.0292 | 0.939 | 0.901 | 0.998 | 1.00 | 0.907 | 0.941 |
Download Data |
Period Mean (original grids) [K] |
Model Period Mean (intersection) [K] |
Model Period Mean (complement) [K] |
Benchmark Period Mean (intersection) [K] |
Benchmark Period Mean (complement) [K] |
Bias [K] |
RMSE [K] |
Phase Shift [months] |
Bias Score [1] |
RMSE Score [1] |
Seasonal Cycle Score [1] |
Spatial Distribution Score [1] |
Interannual Variability Score [1] |
Overall Score [1] |
|||
|---|---|---|---|---|---|---|---|---|---|---|---|---|---|---|---|---|---|
| Benchmark | [-] | 294. | |||||||||||||||
| CRUJRA | [-] | 296. | 296. | 298. | 294. | 295. | 2.16 | 2.46 | 1.67 | 0.125 | 0.507 | 0.742 | 0.989 | 0.749 | 0.603 | ||
| CRUNCEPv7 | [-] | 297. | 297. | 298. | 294. | 295. | 3.11 | 3.26 | 1.60 | 0.0596 | 0.477 | 0.757 | 0.937 | 0.744 | 0.575 | ||
| GSWP3v1 | [-] | 295. | 295. | 297. | 294. | 295. | 1.21 | 1.66 | 1.28 | 0.281 | 0.505 | 0.809 | 0.960 | 0.814 | 0.646 | ||
| WATCH | [-] | 295. | 295. | 296. | 294. | 295. | 1.19 | 1.83 | 1.22 | 0.243 | 0.415 | 0.827 | 0.954 | 0.859 | 0.619 |
Download Data |
Period Mean (original grids) [K] |
Model Period Mean (intersection) [K] |
Model Period Mean (complement) [K] |
Benchmark Period Mean (intersection) [K] |
Benchmark Period Mean (complement) [K] |
Bias [K] |
RMSE [K] |
Phase Shift [months] |
Bias Score [1] |
RMSE Score [1] |
Seasonal Cycle Score [1] |
Spatial Distribution Score [1] |
Interannual Variability Score [1] |
Overall Score [1] |
|||
|---|---|---|---|---|---|---|---|---|---|---|---|---|---|---|---|---|---|
| Benchmark | [-] | 265. | |||||||||||||||
| CRUJRA | [-] | 265. | 265. | 270. | 265. | 269. | 0.109 | 1.18 | 0.0296 | 0.952 | 0.938 | 0.998 | 0.997 | 0.923 | 0.958 | ||
| CRUNCEPv7 | [-] | 266. | 266. | 272. | 265. | 269. | 0.538 | 1.48 | 0.0277 | 0.935 | 0.930 | 0.998 | 0.992 | 0.971 | 0.959 | ||
| GSWP3v1 | [-] | 265. | 265. | 272. | 265. | 269. | -0.198 | 1.13 | 0.0191 | 0.945 | 0.945 | 0.999 | 0.997 | 0.965 | 0.966 | ||
| WATCH | [-] | 265. | 265. | 270. | 265. | 269. | -0.277 | 1.27 | 0.0202 | 0.955 | 0.931 | 0.999 | 1.00 | 0.929 | 0.957 |
Download Data |
Period Mean (original grids) [K] |
Model Period Mean (intersection) [K] |
Model Period Mean (complement) [K] |
Benchmark Period Mean (intersection) [K] |
Benchmark Period Mean (complement) [K] |
Bias [K] |
RMSE [K] |
Phase Shift [months] |
Bias Score [1] |
RMSE Score [1] |
Seasonal Cycle Score [1] |
Spatial Distribution Score [1] |
Interannual Variability Score [1] |
Overall Score [1] |
|||
|---|---|---|---|---|---|---|---|---|---|---|---|---|---|---|---|---|---|
| Benchmark | [-] | 274. | |||||||||||||||
| CRUJRA | [-] | 275. | 275. | 284. | 274. | 283. | 1.24 | 1.96 | 0.0396 | 0.851 | 0.909 | 0.997 | 1.00 | 0.929 | 0.932 | ||
| CRUNCEPv7 | [-] | 275. | 275. | 285. | 274. | 280. | 1.21 | 2.20 | 0.0399 | 0.848 | 0.883 | 0.997 | 0.999 | 0.922 | 0.922 | ||
| GSWP3v1 | [-] | 274. | 274. | 285. | 274. | 280. | 0.670 | 1.54 | 0.0163 | 0.881 | 0.923 | 0.999 | 0.999 | 0.928 | 0.942 | ||
| WATCH | [-] | 274. | 274. | 283. | 274. | 280. | 0.476 | 1.74 | 0.0261 | 0.879 | 0.900 | 0.998 | 0.999 | 0.861 | 0.923 |
Download Data |
Period Mean (original grids) [K] |
Model Period Mean (intersection) [K] |
Model Period Mean (complement) [K] |
Benchmark Period Mean (intersection) [K] |
Benchmark Period Mean (complement) [K] |
Bias [K] |
RMSE [K] |
Phase Shift [months] |
Bias Score [1] |
RMSE Score [1] |
Seasonal Cycle Score [1] |
Spatial Distribution Score [1] |
Interannual Variability Score [1] |
Overall Score [1] |
|||
|---|---|---|---|---|---|---|---|---|---|---|---|---|---|---|---|---|---|
| Benchmark | [-] | 291. | |||||||||||||||
| CRUJRA | [-] | 292. | 293. | 298. | 291. | 296. | 1.70 | 2.29 | 0.291 | 0.600 | 0.817 | 0.977 | 0.997 | 0.913 | 0.854 | ||
| CRUNCEPv7 | [-] | 292. | 292. | 298. | 291. | 296. | 1.17 | 2.14 | 0.303 | 0.631 | 0.791 | 0.976 | 0.990 | 0.853 | 0.839 | ||
| GSWP3v1 | [-] | 291. | 291. | 297. | 291. | 296. | 0.736 | 1.51 | 0.255 | 0.717 | 0.846 | 0.978 | 0.999 | 0.929 | 0.886 | ||
| WATCH | [-] | 292. | 292. | 296. | 291. | 296. | 1.11 | 1.96 | 0.268 | 0.667 | 0.799 | 0.979 | 0.999 | 0.852 | 0.849 |
Download Data |
Period Mean (original grids) [K] |
Model Period Mean (intersection) [K] |
Model Period Mean (complement) [K] |
Benchmark Period Mean (intersection) [K] |
Benchmark Period Mean (complement) [K] |
Bias [K] |
RMSE [K] |
Phase Shift [months] |
Bias Score [1] |
RMSE Score [1] |
Seasonal Cycle Score [1] |
Spatial Distribution Score [1] |
Interannual Variability Score [1] |
Overall Score [1] |
|||
|---|---|---|---|---|---|---|---|---|---|---|---|---|---|---|---|---|---|
| Benchmark | [-] | 259. | |||||||||||||||
| CRUJRA | [-] | 259. | 259. | 261. | 259. | 260. | 0.122 | 1.35 | 0.0193 | 0.959 | 0.927 | 0.999 | 0.995 | 0.870 | 0.946 | ||
| CRUNCEPv7 | [-] | 259. | 259. | 261. | 259. | 260. | -0.0883 | 1.60 | 0.0227 | 0.962 | 0.910 | 0.998 | 0.999 | 0.911 | 0.949 | ||
| GSWP3v1 | [-] | 259. | 259. | 263. | 259. | 260. | -0.224 | 1.48 | 0.0263 | 0.954 | 0.923 | 0.998 | 1.00 | 0.921 | 0.953 | ||
| WATCH | [-] | 259. | 259. | 260. | 259. | 260. | -0.272 | 1.60 | 0.0201 | 0.964 | 0.909 | 0.999 | 1.00 | 0.923 | 0.951 |
Download Data |
Period Mean (original grids) [K] |
Model Period Mean (intersection) [K] |
Model Period Mean (complement) [K] |
Benchmark Period Mean (intersection) [K] |
Benchmark Period Mean (complement) [K] |
Bias [K] |
RMSE [K] |
Phase Shift [months] |
Bias Score [1] |
RMSE Score [1] |
Seasonal Cycle Score [1] |
Spatial Distribution Score [1] |
Interannual Variability Score [1] |
Overall Score [1] |
|||
|---|---|---|---|---|---|---|---|---|---|---|---|---|---|---|---|---|---|
| Benchmark | [-] | 287. | |||||||||||||||
| CRUJRA | [-] | 290. | 290. | 290. | 287. | 289. | 2.59 | 2.80 | 0.151 | 0.579 | 0.832 | 0.989 | 0.991 | 0.893 | 0.853 | ||
| CRUNCEPv7 | [-] | 290. | 290. | 291. | 287. | 289. | 2.60 | 2.76 | 0.207 | 0.582 | 0.834 | 0.985 | 0.994 | 0.905 | 0.856 | ||
| GSWP3v1 | [-] | 289. | 289. | 290. | 287. | 289. | 1.16 | 1.34 | 0.138 | 0.770 | 0.891 | 0.991 | 1.00 | 0.943 | 0.914 | ||
| WATCH | [-] | 289. | 289. | 288. | 287. | 289. | 1.37 | 1.67 | 0.191 | 0.733 | 0.858 | 0.987 | 0.999 | 0.938 | 0.895 |
Download Data |
Period Mean (original grids) [K] |
Model Period Mean (intersection) [K] |
Model Period Mean (complement) [K] |
Benchmark Period Mean (intersection) [K] |
Benchmark Period Mean (complement) [K] |
Bias [K] |
RMSE [K] |
Phase Shift [months] |
Bias Score [1] |
RMSE Score [1] |
Seasonal Cycle Score [1] |
Spatial Distribution Score [1] |
Interannual Variability Score [1] |
Overall Score [1] |
|||
|---|---|---|---|---|---|---|---|---|---|---|---|---|---|---|---|---|---|
| Benchmark | [-] | 277. | |||||||||||||||
| CRUJRA | [-] | 278. | 277. | 281. | 277. | 281. | 0.705 | 1.52 | 0.291 | 0.817 | 0.873 | 0.980 | 0.990 | 0.950 | 0.914 | ||
| CRUNCEPv7 | [-] | 278. | 278. | 281. | 277. | 281. | 0.782 | 1.54 | 0.261 | 0.817 | 0.870 | 0.982 | 0.993 | 0.919 | 0.909 | ||
| GSWP3v1 | [-] | 277. | 277. | 280. | 277. | 281. | 0.00878 | 1.14 | 0.219 | 0.859 | 0.905 | 0.985 | 0.994 | 0.942 | 0.932 | ||
| WATCH | [-] | 277. | 277. | 280. | 277. | 281. | 0.427 | 1.42 | 0.190 | 0.841 | 0.870 | 0.987 | 0.996 | 0.897 | 0.910 |
Download Data |
Period Mean (original grids) [K] |
Model Period Mean (intersection) [K] |
Model Period Mean (complement) [K] |
Benchmark Period Mean (intersection) [K] |
Benchmark Period Mean (complement) [K] |
Bias [K] |
RMSE [K] |
Phase Shift [months] |
Bias Score [1] |
RMSE Score [1] |
Seasonal Cycle Score [1] |
Spatial Distribution Score [1] |
Interannual Variability Score [1] |
Overall Score [1] |
|||
|---|---|---|---|---|---|---|---|---|---|---|---|---|---|---|---|---|---|
| Benchmark | [-] | 281. | |||||||||||||||
| CRUJRA | [-] | 281. | 282. | 277. | 280. | 288. | 1.69 | 2.23 | 0.342 | 0.645 | 0.818 | 0.958 | 0.999 | 0.881 | 0.853 | ||
| CRUNCEPv7 | [-] | 277. | 282. | 241. | 280. | 287. | 1.45 | 2.25 | 0.416 | 0.657 | 0.794 | 0.947 | 0.998 | 0.895 | 0.848 | ||
| GSWP3v1 | [-] | 277. | 281. | 244. | 280. | 287. | 0.686 | 1.46 | 0.269 | 0.759 | 0.835 | 0.968 | 0.999 | 0.909 | 0.884 | ||
| WATCH | [-] | 277. | 281. | 244. | 280. | 287. | 0.891 | 1.78 | 0.287 | 0.722 | 0.791 | 0.966 | 0.999 | 0.883 | 0.859 |
Download Data |
Period Mean (original grids) [K] |
Model Period Mean (intersection) [K] |
Model Period Mean (complement) [K] |
Benchmark Period Mean (intersection) [K] |
Benchmark Period Mean (complement) [K] |
Bias [K] |
RMSE [K] |
Phase Shift [months] |
Bias Score [1] |
RMSE Score [1] |
Seasonal Cycle Score [1] |
Spatial Distribution Score [1] |
Interannual Variability Score [1] |
Overall Score [1] |
|||
|---|---|---|---|---|---|---|---|---|---|---|---|---|---|---|---|---|---|
| Benchmark | [-] | 289. | |||||||||||||||
| CRUJRA | [-] | 290. | 290. | 293. | 289. | 292. | 1.95 | 2.31 | 0.230 | 0.711 | 0.871 | 0.983 | 1.00 | 0.847 | 0.880 | ||
| CRUNCEPv7 | [-] | 289. | 289. | 292. | 288. | 292. | 0.570 | 1.87 | 0.313 | 0.793 | 0.838 | 0.976 | 0.997 | 0.909 | 0.892 | ||
| GSWP3v1 | [-] | 289. | 289. | 292. | 288. | 292. | 0.623 | 1.29 | 0.238 | 0.852 | 0.882 | 0.982 | 1.00 | 0.909 | 0.918 | ||
| WATCH | [-] | 289. | 289. | 291. | 288. | 291. | 0.889 | 1.66 | 0.276 | 0.817 | 0.854 | 0.978 | 0.999 | 0.913 | 0.903 |
Download Data |
Period Mean (original grids) [K] |
Model Period Mean (intersection) [K] |
Model Period Mean (complement) [K] |
Benchmark Period Mean (intersection) [K] |
Benchmark Period Mean (complement) [K] |
Bias [K] |
RMSE [K] |
Phase Shift [months] |
Bias Score [1] |
RMSE Score [1] |
Seasonal Cycle Score [1] |
Spatial Distribution Score [1] |
Interannual Variability Score [1] |
Overall Score [1] |
|||
|---|---|---|---|---|---|---|---|---|---|---|---|---|---|---|---|---|---|
| Benchmark | [-] | 260. | |||||||||||||||
| CRUJRA | [-] | 261. | 261. | 260. | 260. | 262. | 0.736 | 1.75 | 0.0568 | 0.930 | 0.904 | 0.996 | 0.999 | 0.820 | 0.925 | ||
| CRUNCEPv7 | [-] | 260. | 260. | 259. | 260. | 262. | 0.124 | 1.63 | 0.0682 | 0.938 | 0.904 | 0.995 | 0.986 | 0.895 | 0.937 | ||
| GSWP3v1 | [-] | 260. | 260. | 262. | 260. | 262. | 0.385 | 1.52 | 0.0456 | 0.938 | 0.915 | 0.997 | 0.998 | 0.920 | 0.947 | ||
| WATCH | [-] | 260. | 260. | 259. | 260. | 262. | 0.406 | 1.53 | 0.0533 | 0.944 | 0.907 | 0.996 | 0.997 | 0.934 | 0.948 |
Download Data |
Period Mean (original grids) [K] |
Model Period Mean (intersection) [K] |
Model Period Mean (complement) [K] |
Benchmark Period Mean (intersection) [K] |
Benchmark Period Mean (complement) [K] |
Bias [K] |
RMSE [K] |
Phase Shift [months] |
Bias Score [1] |
RMSE Score [1] |
Seasonal Cycle Score [1] |
Spatial Distribution Score [1] |
Interannual Variability Score [1] |
Overall Score [1] |
|||
|---|---|---|---|---|---|---|---|---|---|---|---|---|---|---|---|---|---|
| Benchmark | [-] | 289. | |||||||||||||||
| CRUJRA | [-] | 291. | 291. | 295. | 289. | 293. | 2.96 | 3.30 | 0.435 | 0.395 | 0.749 | 0.959 | 0.997 | 0.841 | 0.782 | ||
| CRUNCEPv7 | [-] | 291. | 291. | 295. | 289. | 293. | 3.06 | 3.46 | 0.530 | 0.376 | 0.712 | 0.946 | 0.994 | 0.873 | 0.769 | ||
| GSWP3v1 | [-] | 289. | 289. | 294. | 289. | 293. | 1.40 | 2.00 | 0.369 | 0.568 | 0.766 | 0.961 | 0.999 | 0.905 | 0.828 | ||
| WATCH | [-] | 289. | 289. | 293. | 289. | 293. | 1.52 | 2.30 | 0.437 | 0.535 | 0.708 | 0.951 | 0.999 | 0.897 | 0.800 |
Download Data |
Period Mean (original grids) [K] |
Model Period Mean (intersection) [K] |
Model Period Mean (complement) [K] |
Benchmark Period Mean (intersection) [K] |
Benchmark Period Mean (complement) [K] |
Bias [K] |
RMSE [K] |
Phase Shift [months] |
Bias Score [1] |
RMSE Score [1] |
Seasonal Cycle Score [1] |
Spatial Distribution Score [1] |
Interannual Variability Score [1] |
Overall Score [1] |
|||
|---|---|---|---|---|---|---|---|---|---|---|---|---|---|---|---|---|---|
| Benchmark | [-] | 280. | |||||||||||||||
| CRUJRA | [-] | 282. | 282. | 290. | 280. | 287. | 2.21 | 2.35 | 0.0681 | 0.770 | 0.920 | 0.995 | 0.999 | 0.953 | 0.926 | ||
| CRUNCEPv7 | [-] | 282. | 282. | 291. | 280. | 287. | 1.92 | 2.14 | 0.0503 | 0.793 | 0.909 | 0.997 | 0.993 | 0.949 | 0.925 | ||
| GSWP3v1 | [-] | 281. | 281. | 289. | 280. | 287. | 1.06 | 1.27 | 0.0255 | 0.876 | 0.936 | 0.998 | 1.00 | 0.972 | 0.953 | ||
| WATCH | [-] | 281. | 281. | 289. | 280. | 287. | 1.01 | 1.40 | 0.0432 | 0.876 | 0.913 | 0.997 | 1.00 | 0.947 | 0.941 |
Download Data |
Period Mean (original grids) [K] |
Model Period Mean (intersection) [K] |
Model Period Mean (complement) [K] |
Benchmark Period Mean (intersection) [K] |
Benchmark Period Mean (complement) [K] |
Bias [K] |
RMSE [K] |
Phase Shift [months] |
Bias Score [1] |
RMSE Score [1] |
Seasonal Cycle Score [1] |
Spatial Distribution Score [1] |
Interannual Variability Score [1] |
Overall Score [1] |
|||
|---|---|---|---|---|---|---|---|---|---|---|---|---|---|---|---|---|---|
| Benchmark | [-] | 268. | |||||||||||||||
| CRUJRA | [-] | 269. | 269. | 274. | 268. | 274. | 1.20 | 1.76 | 0.0336 | 0.876 | 0.911 | 0.998 | 0.997 | 0.892 | 0.930 | ||
| CRUNCEPv7 | [-] | 269. | 269. | 274. | 268. | 274. | 0.849 | 1.54 | 0.0363 | 0.895 | 0.908 | 0.998 | 0.995 | 0.944 | 0.941 | ||
| GSWP3v1 | [-] | 268. | 268. | 274. | 268. | 274. | 0.439 | 1.14 | 0.0361 | 0.922 | 0.926 | 0.998 | 0.997 | 0.952 | 0.953 | ||
| WATCH | [-] | 269. | 269. | 273. | 268. | 274. | 0.735 | 1.45 | 0.0470 | 0.908 | 0.906 | 0.997 | 0.999 | 0.927 | 0.940 |
Download Data |
Period Mean (original grids) [K] |
Model Period Mean (intersection) [K] |
Model Period Mean (complement) [K] |
Benchmark Period Mean (intersection) [K] |
Benchmark Period Mean (complement) [K] |
Bias [K] |
RMSE [K] |
Phase Shift [months] |
Bias Score [1] |
RMSE Score [1] |
Seasonal Cycle Score [1] |
Spatial Distribution Score [1] |
Interannual Variability Score [1] |
Overall Score [1] |
|||
|---|---|---|---|---|---|---|---|---|---|---|---|---|---|---|---|---|---|
| Benchmark | [-] | 276. | |||||||||||||||
| CRUJRA | [-] | 278. | 278. | 284. | 276. | 280. | 2.68 | 3.00 | 0.0411 | 0.694 | 0.871 | 0.997 | 1.00 | 0.945 | 0.896 | ||
| CRUNCEPv7 | [-] | 277. | 277. | 283. | 276. | 280. | 1.79 | 2.50 | 0.0354 | 0.761 | 0.836 | 0.997 | 0.997 | 0.897 | 0.887 | ||
| GSWP3v1 | [-] | 277. | 277. | 283. | 276. | 280. | 1.52 | 2.00 | 0.0516 | 0.787 | 0.891 | 0.997 | 0.998 | 0.943 | 0.918 | ||
| WATCH | [-] | 277. | 277. | 282. | 275. | 280. | 1.51 | 2.30 | 0.0459 | 0.773 | 0.857 | 0.997 | 1.00 | 0.893 | 0.896 |
Download Data |
Period Mean (original grids) [K] |
Model Period Mean (intersection) [K] |
Model Period Mean (complement) [K] |
Benchmark Period Mean (intersection) [K] |
Benchmark Period Mean (complement) [K] |
Bias [K] |
RMSE [K] |
Phase Shift [months] |
Bias Score [1] |
RMSE Score [1] |
Seasonal Cycle Score [1] |
Spatial Distribution Score [1] |
Interannual Variability Score [1] |
Overall Score [1] |
|||
|---|---|---|---|---|---|---|---|---|---|---|---|---|---|---|---|---|---|
| Benchmark | [-] | 294. | |||||||||||||||
| CRUJRA | [-] | 296. | 296. | 298. | 294. | 294. | 2.12 | 2.45 | 1.64 | 0.148 | 0.546 | 0.749 | 0.997 | 0.824 | 0.635 | ||
| CRUNCEPv7 | [-] | 296. | 296. | 298. | 294. | 294. | 2.20 | 2.50 | 2.13 | 0.137 | 0.521 | 0.661 | 1.00 | 0.882 | 0.620 | ||
| GSWP3v1 | [-] | 295. | 295. | 297. | 294. | 294. | 0.925 | 1.38 | 1.11 | 0.399 | 0.552 | 0.833 | 0.996 | 0.871 | 0.700 | ||
| WATCH | [-] | 295. | 295. | 297. | 294. | 294. | 1.06 | 1.75 | 1.23 | 0.335 | 0.407 | 0.813 | 1.00 | 0.791 | 0.626 |
Download Data |
Period Mean (original grids) [K] |
Model Period Mean (intersection) [K] |
Model Period Mean (complement) [K] |
Benchmark Period Mean (intersection) [K] |
Benchmark Period Mean (complement) [K] |
Bias [K] |
RMSE [K] |
Phase Shift [months] |
Bias Score [1] |
RMSE Score [1] |
Seasonal Cycle Score [1] |
Spatial Distribution Score [1] |
Interannual Variability Score [1] |
Overall Score [1] |
|||
|---|---|---|---|---|---|---|---|---|---|---|---|---|---|---|---|---|---|
| Benchmark | [-] | 290. | |||||||||||||||
| CRUJRA | [-] | 292. | 292. | 293. | 290. | 288. | 2.09 | 2.25 | 0.601 | 0.456 | 0.770 | 0.921 | 0.999 | 0.921 | 0.806 | ||
| CRUNCEPv7 | [-] | 292. | 292. | 294. | 290. | 288. | 2.43 | 2.59 | 0.778 | 0.410 | 0.742 | 0.888 | 0.997 | 0.919 | 0.783 | ||
| GSWP3v1 | [-] | 291. | 291. | 293. | 290. | 288. | 1.06 | 1.31 | 0.478 | 0.637 | 0.798 | 0.938 | 1.00 | 0.935 | 0.851 | ||
| WATCH | [-] | 291. | 291. | 291. | 290. | 288. | 1.24 | 1.67 | 0.479 | 0.579 | 0.717 | 0.939 | 0.994 | 0.858 | 0.801 |
Download Data |
Period Mean (original grids) [K] |
Model Period Mean (intersection) [K] |
Model Period Mean (complement) [K] |
Benchmark Period Mean (intersection) [K] |
Benchmark Period Mean (complement) [K] |
Bias [K] |
RMSE [K] |
Phase Shift [months] |
Bias Score [1] |
RMSE Score [1] |
Seasonal Cycle Score [1] |
Spatial Distribution Score [1] |
Interannual Variability Score [1] |
Overall Score [1] |
|||
|---|---|---|---|---|---|---|---|---|---|---|---|---|---|---|---|---|---|
| Benchmark | [-] | 278. | |||||||||||||||
| CRUJRA | [-] | 280. | 279. | 285. | 278. | 281. | 2.29 | 2.98 | 0.196 | 0.487 | 0.769 | 0.978 | 0.990 | 0.929 | 0.820 | ||
| CRUNCEPv7 | [-] | 280. | 280. | 285. | 278. | 281. | 2.59 | 3.21 | 0.305 | 0.458 | 0.749 | 0.964 | 0.999 | 0.922 | 0.807 | ||
| GSWP3v1 | [-] | 279. | 278. | 284. | 278. | 281. | 1.24 | 2.18 | 0.122 | 0.596 | 0.793 | 0.989 | 1.00 | 0.922 | 0.849 | ||
| WATCH | [-] | 279. | 279. | 284. | 277. | 281. | 1.82 | 2.76 | 0.166 | 0.549 | 0.731 | 0.986 | 1.00 | 0.892 | 0.815 |
Temporally integrated period mean