Mean State
Download Data |
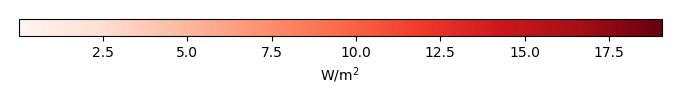
Period Mean (original grids) [W/m2] |
Model Period Mean (intersection) [W/m2] |
Model Period Mean (complement) [W/m2] |
Benchmark Period Mean (intersection) [W/m2] |
Benchmark Period Mean (complement) [W/m2] |
Bias [W/m2] |
RMSE [W/m2] |
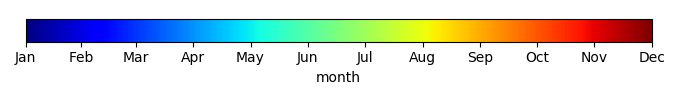
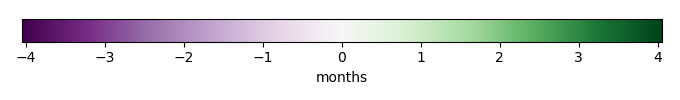
Phase Shift [months] |
Bias Score [1] |
RMSE Score [1] |
Seasonal Cycle Score [1] |
Spatial Distribution Score [1] |
Interannual Variability Score [1] |
Overall Score [1] |
|||
|---|---|---|---|---|---|---|---|---|---|---|---|---|---|---|---|---|---|
| Benchmark | [-] | 218. | |||||||||||||||
| CRUJRA | [-] | 225. | 224. | 218. | 219. | 6.59 | 17.7 | 1.12 | 0.652 | 0.499 | 0.852 | 0.989 | 0.452 | 0.657 | |||
| CRUNCEPv7 | [-] | 228. | 228. | 218. | 219. | 9.56 | 18.7 | 1.04 | 0.589 | 0.502 | 0.866 | 0.989 | 0.474 | 0.654 | |||
| GSWP3v1 | [-] | 215. | 215. | 218. | 219. | -2.67 | 17.1 | 0.845 | 0.743 | 0.489 | 0.903 | 0.937 | 0.819 | 0.730 | |||
| WATCH | [-] | 168. | 167. | 217. | 220. | -47.6 | 55.0 | 1.80 | 0.150 | 0.382 | 0.730 | 0.921 | 0.580 | 0.524 |
Download Data |
Period Mean (original grids) [W/m2] |
Model Period Mean (intersection) [W/m2] |
Model Period Mean (complement) [W/m2] |
Benchmark Period Mean (intersection) [W/m2] |
Benchmark Period Mean (complement) [W/m2] |
Bias [W/m2] |
RMSE [W/m2] |
Phase Shift [months] |
Bias Score [1] |
RMSE Score [1] |
Seasonal Cycle Score [1] |
Spatial Distribution Score [1] |
Interannual Variability Score [1] |
Overall Score [1] |
|||
|---|---|---|---|---|---|---|---|---|---|---|---|---|---|---|---|---|---|
| Benchmark | [-] | 243. | |||||||||||||||
| CRUJRA | [-] | 242. | 242. | 243. | 228. | -0.638 | 20.1 | 0.690 | 0.588 | 0.544 | 0.934 | 0.975 | 0.681 | 0.711 | |||
| CRUNCEPv7 | [-] | 245. | 245. | 243. | 228. | 2.40 | 20.3 | 0.724 | 0.586 | 0.543 | 0.930 | 0.972 | 0.739 | 0.719 | |||
| GSWP3v1 | [-] | 240. | 241. | 243. | 228. | -2.41 | 14.7 | 0.393 | 0.807 | 0.547 | 0.972 | 0.988 | 0.863 | 0.787 | |||
| WATCH | [-] | 198. | 199. | 243. | 227. | -43.5 | 48.7 | 0.634 | 0.221 | 0.505 | 0.949 | 0.755 | 0.598 | 0.589 |
Download Data |
Period Mean (original grids) [W/m2] |
Model Period Mean (intersection) [W/m2] |
Model Period Mean (complement) [W/m2] |
Benchmark Period Mean (intersection) [W/m2] |
Benchmark Period Mean (complement) [W/m2] |
Bias [W/m2] |
RMSE [W/m2] |
Phase Shift [months] |
Bias Score [1] |
RMSE Score [1] |
Seasonal Cycle Score [1] |
Spatial Distribution Score [1] |
Interannual Variability Score [1] |
Overall Score [1] |
|||
|---|---|---|---|---|---|---|---|---|---|---|---|---|---|---|---|---|---|
| Benchmark | [-] | 233. | |||||||||||||||
| CRUJRA | [-] | 229. | 229. | 233. | 234. | -3.84 | 18.5 | 0.959 | 0.720 | 0.588 | 0.861 | 0.865 | 0.544 | 0.694 | |||
| CRUNCEPv7 | [-] | 232. | 232. | 233. | 234. | -0.895 | 18.3 | 0.994 | 0.735 | 0.586 | 0.860 | 0.887 | 0.534 | 0.698 | |||
| GSWP3v1 | [-] | 232. | 232. | 233. | 234. | -0.710 | 16.8 | 0.786 | 0.840 | 0.570 | 0.897 | 0.981 | 0.756 | 0.769 | |||
| WATCH | [-] | 212. | 212. | 228. | 228. | -16.6 | 27.3 | 1.39 | 0.547 | 0.526 | 0.800 | 0.933 | 0.645 | 0.663 |
Download Data |
Period Mean (original grids) [W/m2] |
Model Period Mean (intersection) [W/m2] |
Model Period Mean (complement) [W/m2] |
Benchmark Period Mean (intersection) [W/m2] |
Benchmark Period Mean (complement) [W/m2] |
Bias [W/m2] |
RMSE [W/m2] |
Phase Shift [months] |
Bias Score [1] |
RMSE Score [1] |
Seasonal Cycle Score [1] |
Spatial Distribution Score [1] |
Interannual Variability Score [1] |
Overall Score [1] |
|||
|---|---|---|---|---|---|---|---|---|---|---|---|---|---|---|---|---|---|
| Benchmark | [-] | 111. | |||||||||||||||
| CRUJRA | [-] | 112. | 113. | 112. | 108. | 0.809 | 23.0 | 0.890 | 0.954 | 0.780 | 0.937 | 0.978 | 0.597 | 0.838 | |||
| CRUNCEPv7 | [-] | 112. | 112. | 112. | 108. | -0.235 | 22.5 | 0.895 | 0.956 | 0.783 | 0.937 | 0.976 | 0.589 | 0.837 | |||
| GSWP3v1 | [-] | 106. | 107. | 112. | 108. | -5.28 | 21.6 | 0.895 | 0.937 | 0.793 | 0.937 | 0.995 | 0.741 | 0.866 | |||
| WATCH | [-] | 98.6 | 98.6 | 118. | 117. | -18.6 | 19.9 | 0.485 | 0.809 | 0.821 | 0.958 | 0.997 | 0.715 | 0.854 |
Download Data |
Period Mean (original grids) [W/m2] |
Model Period Mean (intersection) [W/m2] |
Model Period Mean (complement) [W/m2] |
Benchmark Period Mean (intersection) [W/m2] |
Benchmark Period Mean (complement) [W/m2] |
Bias [W/m2] |
RMSE [W/m2] |
Phase Shift [months] |
Bias Score [1] |
RMSE Score [1] |
Seasonal Cycle Score [1] |
Spatial Distribution Score [1] |
Interannual Variability Score [1] |
Overall Score [1] |
|||
|---|---|---|---|---|---|---|---|---|---|---|---|---|---|---|---|---|---|
| Benchmark | [-] | 212. | |||||||||||||||
| CRUJRA | [-] | 218. | 218. | 209. | 219. | 10.8 | 20.7 | 1.32 | 0.577 | 0.459 | 0.798 | 0.999 | 0.522 | 0.636 | |||
| CRUNCEPv7 | [-] | 216. | 216. | 209. | 219. | 9.22 | 20.2 | 1.45 | 0.609 | 0.448 | 0.776 | 0.999 | 0.523 | 0.634 | |||
| GSWP3v1 | [-] | 203. | 202. | 209. | 219. | -2.31 | 17.6 | 1.09 | 0.708 | 0.437 | 0.829 | 0.964 | 0.778 | 0.692 | |||
| WATCH | [-] | 159. | 159. | 208. | 214. | -39.7 | 47.7 | 2.03 | 0.240 | 0.326 | 0.674 | 0.341 | 0.554 | 0.410 |
Download Data |
Period Mean (original grids) [W/m2] |
Model Period Mean (intersection) [W/m2] |
Model Period Mean (complement) [W/m2] |
Benchmark Period Mean (intersection) [W/m2] |
Benchmark Period Mean (complement) [W/m2] |
Bias [W/m2] |
RMSE [W/m2] |
Phase Shift [months] |
Bias Score [1] |
RMSE Score [1] |
Seasonal Cycle Score [1] |
Spatial Distribution Score [1] |
Interannual Variability Score [1] |
Overall Score [1] |
|||
|---|---|---|---|---|---|---|---|---|---|---|---|---|---|---|---|---|---|
| Benchmark | [-] | 126. | |||||||||||||||
| CRUJRA | [-] | 133. | 133. | 126. | 139. | 7.25 | 21.6 | 0.353 | 0.898 | 0.784 | 0.972 | 0.984 | 0.602 | 0.837 | |||
| CRUNCEPv7 | [-] | 134. | 134. | 126. | 139. | 8.17 | 22.1 | 0.380 | 0.887 | 0.785 | 0.969 | 0.987 | 0.676 | 0.848 | |||
| GSWP3v1 | [-] | 126. | 125. | 126. | 139. | -0.0545 | 14.7 | 0.342 | 0.956 | 0.833 | 0.972 | 0.964 | 0.643 | 0.867 | |||
| WATCH | [-] | 109. | 109. | 130. | 142. | -21.0 | 21.2 | 0.437 | 0.760 | 0.809 | 0.965 | 0.993 | 0.712 | 0.842 |
Download Data |
Period Mean (original grids) [W/m2] |
Model Period Mean (intersection) [W/m2] |
Model Period Mean (complement) [W/m2] |
Benchmark Period Mean (intersection) [W/m2] |
Benchmark Period Mean (complement) [W/m2] |
Bias [W/m2] |
RMSE [W/m2] |
Phase Shift [months] |
Bias Score [1] |
RMSE Score [1] |
Seasonal Cycle Score [1] |
Spatial Distribution Score [1] |
Interannual Variability Score [1] |
Overall Score [1] |
|||
|---|---|---|---|---|---|---|---|---|---|---|---|---|---|---|---|---|---|
| Benchmark | [-] | 174. | |||||||||||||||
| CRUJRA | [-] | 186. | 185. | 175. | 163. | 11.0 | 26.4 | 0.485 | 0.748 | 0.759 | 0.960 | 0.793 | 0.581 | 0.767 | |||
| CRUNCEPv7 | [-] | 188. | 188. | 175. | 164. | 12.5 | 26.7 | 0.468 | 0.744 | 0.758 | 0.960 | 0.817 | 0.673 | 0.785 | |||
| GSWP3v1 | [-] | 171. | 170. | 175. | 164. | -4.69 | 17.9 | 0.365 | 0.868 | 0.775 | 0.969 | 0.977 | 0.625 | 0.832 | |||
| WATCH | [-] | 166. | 166. | 180. | 170. | -14.4 | 23.1 | 0.569 | 0.777 | 0.733 | 0.943 | 0.995 | 0.681 | 0.810 |
Download Data |
Period Mean (original grids) [W/m2] |
Model Period Mean (intersection) [W/m2] |
Model Period Mean (complement) [W/m2] |
Benchmark Period Mean (intersection) [W/m2] |
Benchmark Period Mean (complement) [W/m2] |
Bias [W/m2] |
RMSE [W/m2] |
Phase Shift [months] |
Bias Score [1] |
RMSE Score [1] |
Seasonal Cycle Score [1] |
Spatial Distribution Score [1] |
Interannual Variability Score [1] |
Overall Score [1] |
|||
|---|---|---|---|---|---|---|---|---|---|---|---|---|---|---|---|---|---|
| Benchmark | [-] | 210. | |||||||||||||||
| CRUJRA | [-] | 230. | 230. | 210. | 218. | 19.6 | 29.0 | 0.344 | 0.570 | 0.608 | 0.973 | 0.986 | 0.612 | 0.726 | |||
| CRUNCEPv7 | [-] | 230. | 231. | 210. | 218. | 19.8 | 28.8 | 0.321 | 0.574 | 0.616 | 0.975 | 0.988 | 0.665 | 0.739 | |||
| GSWP3v1 | [-] | 207. | 207. | 210. | 218. | -1.45 | 19.3 | 0.328 | 0.807 | 0.623 | 0.973 | 0.937 | 0.745 | 0.784 | |||
| WATCH | [-] | 189. | 189. | 210. | 216. | -20.7 | 32.5 | 0.664 | 0.565 | 0.525 | 0.928 | 0.858 | 0.722 | 0.687 |
Download Data |
Period Mean (original grids) [W/m2] |
Model Period Mean (intersection) [W/m2] |
Model Period Mean (complement) [W/m2] |
Benchmark Period Mean (intersection) [W/m2] |
Benchmark Period Mean (complement) [W/m2] |
Bias [W/m2] |
RMSE [W/m2] |
Phase Shift [months] |
Bias Score [1] |
RMSE Score [1] |
Seasonal Cycle Score [1] |
Spatial Distribution Score [1] |
Interannual Variability Score [1] |
Overall Score [1] |
|||
|---|---|---|---|---|---|---|---|---|---|---|---|---|---|---|---|---|---|
| Benchmark | [-] | 98.9 | |||||||||||||||
| CRUJRA | [-] | 103. | 103. | 99.3 | 90.5 | 3.07 | 23.2 | 0.844 | 0.946 | 0.783 | 0.931 | 0.972 | 0.572 | 0.831 | |||
| CRUNCEPv7 | [-] | 103. | 103. | 99.3 | 90.5 | 3.33 | 23.2 | 0.920 | 0.944 | 0.784 | 0.920 | 0.950 | 0.605 | 0.831 | |||
| GSWP3v1 | [-] | 96.0 | 96.3 | 99.3 | 90.5 | -3.59 | 20.4 | 0.692 | 0.950 | 0.806 | 0.953 | 0.886 | 0.671 | 0.845 | |||
| WATCH | [-] | 82.5 | 82.7 | 107. | 98.8 | -24.1 | 26.0 | 0.477 | 0.763 | 0.799 | 0.968 | 0.981 | 0.695 | 0.834 |
Download Data |
Period Mean (original grids) [W/m2] |
Model Period Mean (intersection) [W/m2] |
Model Period Mean (complement) [W/m2] |
Benchmark Period Mean (intersection) [W/m2] |
Benchmark Period Mean (complement) [W/m2] |
Bias [W/m2] |
RMSE [W/m2] |
Phase Shift [months] |
Bias Score [1] |
RMSE Score [1] |
Seasonal Cycle Score [1] |
Spatial Distribution Score [1] |
Interannual Variability Score [1] |
Overall Score [1] |
|||
|---|---|---|---|---|---|---|---|---|---|---|---|---|---|---|---|---|---|
| Benchmark | [-] | 235. | |||||||||||||||
| CRUJRA | [-] | 239. | 239. | 237. | 210. | 0.0607 | 15.1 | 0.412 | 0.890 | 0.787 | 0.971 | 0.953 | 0.633 | 0.837 | |||
| CRUNCEPv7 | [-] | 237. | 237. | 237. | 210. | -2.50 | 15.4 | 0.485 | 0.880 | 0.786 | 0.966 | 0.965 | 0.682 | 0.844 | |||
| GSWP3v1 | [-] | 231. | 231. | 237. | 210. | -7.53 | 17.8 | 0.369 | 0.855 | 0.773 | 0.971 | 0.996 | 0.727 | 0.849 | |||
| WATCH | [-] | 234. | 234. | 226. | 202. | 4.41 | 15.2 | 0.597 | 0.882 | 0.752 | 0.935 | 1.00 | 0.778 | 0.850 |
Download Data |
Period Mean (original grids) [W/m2] |
Model Period Mean (intersection) [W/m2] |
Model Period Mean (complement) [W/m2] |
Benchmark Period Mean (intersection) [W/m2] |
Benchmark Period Mean (complement) [W/m2] |
Bias [W/m2] |
RMSE [W/m2] |
Phase Shift [months] |
Bias Score [1] |
RMSE Score [1] |
Seasonal Cycle Score [1] |
Spatial Distribution Score [1] |
Interannual Variability Score [1] |
Overall Score [1] |
|||
|---|---|---|---|---|---|---|---|---|---|---|---|---|---|---|---|---|---|
| Benchmark | [-] | 140. | |||||||||||||||
| CRUJRA | [-] | 156. | 156. | 138. | 155. | 18.8 | 25.4 | 0.235 | 0.783 | 0.829 | 0.984 | 0.994 | 0.686 | 0.851 | |||
| CRUNCEPv7 | [-] | 159. | 159. | 138. | 155. | 20.3 | 27.3 | 0.255 | 0.765 | 0.826 | 0.983 | 0.997 | 0.697 | 0.849 | |||
| GSWP3v1 | [-] | 135. | 135. | 138. | 155. | -0.611 | 14.4 | 0.228 | 0.939 | 0.844 | 0.985 | 0.998 | 0.646 | 0.876 | |||
| WATCH | [-] | 114. | 114. | 140. | 160. | -22.8 | 22.9 | 0.463 | 0.749 | 0.820 | 0.966 | 0.967 | 0.707 | 0.838 |
Download Data |
Period Mean (original grids) [W/m2] |
Model Period Mean (intersection) [W/m2] |
Model Period Mean (complement) [W/m2] |
Benchmark Period Mean (intersection) [W/m2] |
Benchmark Period Mean (complement) [W/m2] |
Bias [W/m2] |
RMSE [W/m2] |
Phase Shift [months] |
Bias Score [1] |
RMSE Score [1] |
Seasonal Cycle Score [1] |
Spatial Distribution Score [1] |
Interannual Variability Score [1] |
Overall Score [1] |
|||
|---|---|---|---|---|---|---|---|---|---|---|---|---|---|---|---|---|---|
| Benchmark | [-] | 187. | |||||||||||||||
| CRUJRA | [-] | 189. | 189. | 186. | 187. | 2.91 | 26.8 | 0.549 | 0.779 | 0.696 | 0.943 | 0.995 | 0.585 | 0.783 | |||
| CRUNCEPv7 | [-] | 191. | 191. | 186. | 187. | 3.66 | 21.8 | 0.562 | 0.783 | 0.720 | 0.941 | 0.997 | 0.586 | 0.791 | |||
| GSWP3v1 | [-] | 182. | 182. | 186. | 187. | -5.34 | 18.5 | 0.425 | 0.855 | 0.726 | 0.958 | 0.998 | 0.726 | 0.831 | |||
| WATCH | [-] | 168. | 168. | 187. | 186. | -19.3 | 27.9 | 0.679 | 0.658 | 0.694 | 0.919 | 0.985 | 0.664 | 0.769 |
Download Data |
Period Mean (original grids) [W/m2] |
Model Period Mean (intersection) [W/m2] |
Model Period Mean (complement) [W/m2] |
Benchmark Period Mean (intersection) [W/m2] |
Benchmark Period Mean (complement) [W/m2] |
Bias [W/m2] |
RMSE [W/m2] |
Phase Shift [months] |
Bias Score [1] |
RMSE Score [1] |
Seasonal Cycle Score [1] |
Spatial Distribution Score [1] |
Interannual Variability Score [1] |
Overall Score [1] |
|||
|---|---|---|---|---|---|---|---|---|---|---|---|---|---|---|---|---|---|
| Benchmark | [-] | 249. | |||||||||||||||
| CRUJRA | [-] | 246. | 245. | 250. | 235. | -5.00 | 17.4 | 0.390 | 0.803 | 0.785 | 0.969 | 0.987 | 0.675 | 0.834 | |||
| CRUNCEPv7 | [-] | 249. | 249. | 250. | 234. | -1.83 | 17.2 | 0.387 | 0.815 | 0.778 | 0.969 | 0.994 | 0.711 | 0.841 | |||
| GSWP3v1 | [-] | 240. | 240. | 250. | 234. | -10.3 | 17.6 | 0.354 | 0.803 | 0.771 | 0.971 | 0.999 | 0.707 | 0.837 | |||
| WATCH | [-] | 217. | 217. | 256. | 239. | -39.4 | 37.1 | 0.416 | 0.479 | 0.779 | 0.967 | 0.994 | 0.634 | 0.772 |
Download Data |
Period Mean (original grids) [W/m2] |
Model Period Mean (intersection) [W/m2] |
Model Period Mean (complement) [W/m2] |
Benchmark Period Mean (intersection) [W/m2] |
Benchmark Period Mean (complement) [W/m2] |
Bias [W/m2] |
RMSE [W/m2] |
Phase Shift [months] |
Bias Score [1] |
RMSE Score [1] |
Seasonal Cycle Score [1] |
Spatial Distribution Score [1] |
Interannual Variability Score [1] |
Overall Score [1] |
|||
|---|---|---|---|---|---|---|---|---|---|---|---|---|---|---|---|---|---|
| Benchmark | [-] | 116. | |||||||||||||||
| CRUJRA | [-] | 117. | 117. | 116. | 114. | 0.858 | 23.6 | 0.621 | 0.951 | 0.784 | 0.955 | 0.978 | 0.465 | 0.820 | |||
| CRUNCEPv7 | [-] | 118. | 117. | 116. | 114. | 0.677 | 23.1 | 0.623 | 0.950 | 0.788 | 0.955 | 0.960 | 0.448 | 0.815 | |||
| GSWP3v1 | [-] | 108. | 108. | 116. | 114. | -8.44 | 23.8 | 0.659 | 0.913 | 0.791 | 0.949 | 0.991 | 0.752 | 0.865 | |||
| WATCH | [-] | 105. | 105. | 122. | 122. | -17.1 | 19.9 | 0.462 | 0.834 | 0.823 | 0.965 | 0.994 | 0.654 | 0.849 |
Download Data |
Period Mean (original grids) [W/m2] |
Model Period Mean (intersection) [W/m2] |
Model Period Mean (complement) [W/m2] |
Benchmark Period Mean (intersection) [W/m2] |
Benchmark Period Mean (complement) [W/m2] |
Bias [W/m2] |
RMSE [W/m2] |
Phase Shift [months] |
Bias Score [1] |
RMSE Score [1] |
Seasonal Cycle Score [1] |
Spatial Distribution Score [1] |
Interannual Variability Score [1] |
Overall Score [1] |
|||
|---|---|---|---|---|---|---|---|---|---|---|---|---|---|---|---|---|---|
| Benchmark | [-] | 230. | |||||||||||||||
| CRUJRA | [-] | 224. | 224. | 229. | 232. | -4.28 | 25.6 | 0.855 | 0.650 | 0.653 | 0.917 | 0.672 | 0.655 | 0.700 | |||
| CRUNCEPv7 | [-] | 224. | 224. | 229. | 232. | -4.21 | 25.5 | 0.839 | 0.652 | 0.657 | 0.920 | 0.695 | 0.677 | 0.710 | |||
| GSWP3v1 | [-] | 225. | 226. | 229. | 232. | -2.36 | 17.1 | 0.281 | 0.809 | 0.688 | 0.971 | 0.995 | 0.768 | 0.820 | |||
| WATCH | [-] | 213. | 214. | 232. | 234. | -18.2 | 30.1 | 0.813 | 0.594 | 0.643 | 0.884 | 0.764 | 0.764 | 0.715 |
Download Data |
Period Mean (original grids) [W/m2] |
Model Period Mean (intersection) [W/m2] |
Model Period Mean (complement) [W/m2] |
Benchmark Period Mean (intersection) [W/m2] |
Benchmark Period Mean (complement) [W/m2] |
Bias [W/m2] |
RMSE [W/m2] |
Phase Shift [months] |
Bias Score [1] |
RMSE Score [1] |
Seasonal Cycle Score [1] |
Spatial Distribution Score [1] |
Interannual Variability Score [1] |
Overall Score [1] |
|||
|---|---|---|---|---|---|---|---|---|---|---|---|---|---|---|---|---|---|
| Benchmark | [-] | 177. | |||||||||||||||
| CRUJRA | [-] | 184. | 184. | 176. | 204. | 9.32 | 18.2 | 0.347 | 0.865 | 0.798 | 0.977 | 0.981 | 0.480 | 0.816 | |||
| CRUNCEPv7 | [-] | 185. | 185. | 176. | 204. | 10.0 | 19.0 | 0.369 | 0.852 | 0.795 | 0.976 | 0.973 | 0.479 | 0.812 | |||
| GSWP3v1 | [-] | 172. | 172. | 176. | 204. | -2.36 | 14.9 | 0.261 | 0.946 | 0.798 | 0.983 | 0.996 | 0.649 | 0.862 | |||
| WATCH | [-] | 178. | 177. | 180. | 210. | -1.83 | 15.8 | 0.315 | 0.903 | 0.792 | 0.977 | 0.995 | 0.664 | 0.854 |
Download Data |
Period Mean (original grids) [W/m2] |
Model Period Mean (intersection) [W/m2] |
Model Period Mean (complement) [W/m2] |
Benchmark Period Mean (intersection) [W/m2] |
Benchmark Period Mean (complement) [W/m2] |
Bias [W/m2] |
RMSE [W/m2] |
Phase Shift [months] |
Bias Score [1] |
RMSE Score [1] |
Seasonal Cycle Score [1] |
Spatial Distribution Score [1] |
Interannual Variability Score [1] |
Overall Score [1] |
|||
|---|---|---|---|---|---|---|---|---|---|---|---|---|---|---|---|---|---|
| Benchmark | [-] | 136. | |||||||||||||||
| CRUJRA | [-] | 147. | 148. | 137. | 128. | 11.2 | 22.7 | 0.273 | 0.862 | 0.791 | 0.981 | 0.990 | 0.494 | 0.818 | |||
| CRUNCEPv7 | [-] | 149. | 149. | 137. | 128. | 12.1 | 23.2 | 0.321 | 0.851 | 0.791 | 0.977 | 0.980 | 0.488 | 0.813 | |||
| GSWP3v1 | [-] | 135. | 135. | 137. | 128. | -1.63 | 14.4 | 0.185 | 0.953 | 0.836 | 0.987 | 0.997 | 0.652 | 0.877 | |||
| WATCH | [-] | 131. | 131. | 141. | 135. | -9.29 | 15.0 | 0.503 | 0.879 | 0.818 | 0.960 | 0.938 | 0.711 | 0.854 |
Download Data |
Period Mean (original grids) [W/m2] |
Model Period Mean (intersection) [W/m2] |
Model Period Mean (complement) [W/m2] |
Benchmark Period Mean (intersection) [W/m2] |
Benchmark Period Mean (complement) [W/m2] |
Bias [W/m2] |
RMSE [W/m2] |
Phase Shift [months] |
Bias Score [1] |
RMSE Score [1] |
Seasonal Cycle Score [1] |
Spatial Distribution Score [1] |
Interannual Variability Score [1] |
Overall Score [1] |
|||
|---|---|---|---|---|---|---|---|---|---|---|---|---|---|---|---|---|---|
| Benchmark | [-] | 199. | |||||||||||||||
| CRUJRA | [-] | 189. | 190. | 200. | 176. | -10.2 | 19.6 | 0.244 | 0.865 | 0.817 | 0.983 | 0.926 | 0.507 | 0.819 | |||
| CRUNCEPv7 | [-] | 190. | 190. | 200. | 176. | -10.0 | 19.6 | 0.240 | 0.867 | 0.816 | 0.984 | 0.929 | 0.522 | 0.822 | |||
| GSWP3v1 | [-] | 194. | 194. | 200. | 176. | -5.87 | 15.0 | 0.152 | 0.915 | 0.841 | 0.990 | 0.982 | 0.679 | 0.874 | |||
| WATCH | [-] | 201. | 202. | 208. | 181. | -6.20 | 15.4 | 0.252 | 0.907 | 0.817 | 0.982 | 0.994 | 0.640 | 0.859 |
Download Data |
Period Mean (original grids) [W/m2] |
Model Period Mean (intersection) [W/m2] |
Model Period Mean (complement) [W/m2] |
Benchmark Period Mean (intersection) [W/m2] |
Benchmark Period Mean (complement) [W/m2] |
Bias [W/m2] |
RMSE [W/m2] |
Phase Shift [months] |
Bias Score [1] |
RMSE Score [1] |
Seasonal Cycle Score [1] |
Spatial Distribution Score [1] |
Interannual Variability Score [1] |
Overall Score [1] |
|||
|---|---|---|---|---|---|---|---|---|---|---|---|---|---|---|---|---|---|
| Benchmark | [-] | 206. | |||||||||||||||
| CRUJRA | [-] | 210. | 210. | 206. | 229. | 4.68 | 18.7 | 1.37 | 0.616 | 0.475 | 0.801 | 0.907 | 0.556 | 0.638 | |||
| CRUNCEPv7 | [-] | 211. | 211. | 206. | 229. | 6.29 | 19.0 | 1.42 | 0.617 | 0.471 | 0.792 | 0.935 | 0.578 | 0.644 | |||
| GSWP3v1 | [-] | 200. | 200. | 206. | 229. | -4.44 | 16.2 | 0.734 | 0.705 | 0.471 | 0.906 | 0.999 | 0.806 | 0.726 | |||
| WATCH | [-] | 176. | 176. | 206. | 231. | -29.8 | 37.6 | 1.64 | 0.278 | 0.385 | 0.766 | 0.870 | 0.555 | 0.540 |
Download Data |
Period Mean (original grids) [W/m2] |
Model Period Mean (intersection) [W/m2] |
Model Period Mean (complement) [W/m2] |
Benchmark Period Mean (intersection) [W/m2] |
Benchmark Period Mean (complement) [W/m2] |
Bias [W/m2] |
RMSE [W/m2] |
Phase Shift [months] |
Bias Score [1] |
RMSE Score [1] |
Seasonal Cycle Score [1] |
Spatial Distribution Score [1] |
Interannual Variability Score [1] |
Overall Score [1] |
|||
|---|---|---|---|---|---|---|---|---|---|---|---|---|---|---|---|---|---|
| Benchmark | [-] | 216. | |||||||||||||||
| CRUJRA | [-] | 217. | 217. | 216. | 214. | 1.05 | 22.5 | 0.770 | 0.692 | 0.638 | 0.916 | 0.772 | 0.499 | 0.693 | |||
| CRUNCEPv7 | [-] | 219. | 219. | 216. | 214. | 2.76 | 22.3 | 0.857 | 0.708 | 0.635 | 0.904 | 0.824 | 0.515 | 0.704 | |||
| GSWP3v1 | [-] | 211. | 211. | 216. | 214. | -4.62 | 18.2 | 0.768 | 0.823 | 0.641 | 0.903 | 0.991 | 0.711 | 0.785 | |||
| WATCH | [-] | 190. | 190. | 210. | 210. | -19.2 | 29.8 | 1.34 | 0.566 | 0.593 | 0.794 | 0.898 | 0.666 | 0.685 |
Download Data |
Period Mean (original grids) [W/m2] |
Model Period Mean (intersection) [W/m2] |
Model Period Mean (complement) [W/m2] |
Benchmark Period Mean (intersection) [W/m2] |
Benchmark Period Mean (complement) [W/m2] |
Bias [W/m2] |
RMSE [W/m2] |
Phase Shift [months] |
Bias Score [1] |
RMSE Score [1] |
Seasonal Cycle Score [1] |
Spatial Distribution Score [1] |
Interannual Variability Score [1] |
Overall Score [1] |
|||
|---|---|---|---|---|---|---|---|---|---|---|---|---|---|---|---|---|---|
| Benchmark | [-] | 208. | |||||||||||||||
| CRUJRA | [-] | 213. | 212. | 211. | 183. | -2.17 | 30.9 | 0.461 | 0.689 | 0.706 | 0.955 | 0.737 | 0.630 | 0.737 | |||
| CRUNCEPv7 | [-] | 212. | 212. | 211. | 183. | -2.59 | 30.2 | 0.416 | 0.695 | 0.708 | 0.958 | 0.772 | 0.650 | 0.748 | |||
| GSWP3v1 | [-] | 209. | 208. | 211. | 183. | -7.33 | 23.1 | 0.365 | 0.791 | 0.729 | 0.961 | 0.997 | 0.704 | 0.818 | |||
| WATCH | [-] | 205. | 205. | 207. | 176. | -5.79 | 30.4 | 0.507 | 0.698 | 0.713 | 0.945 | 0.994 | 0.686 | 0.792 |
Temporally integrated period mean