Mean State
Download Data |
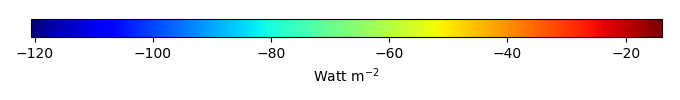
Period Mean (original grids) [Watt m-2] |
Bias [Watt m-2] |
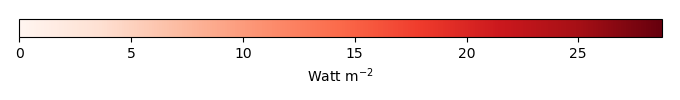
RMSE [Watt m-2] |
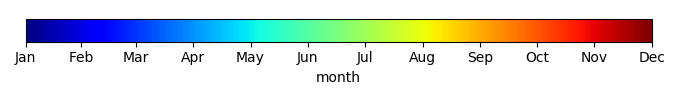
Phase Shift [months] |
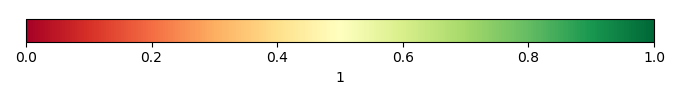
Bias Score [1] |
RMSE Score [1] |
Seasonal Cycle Score [1] |
Interannual Variability Score [1] |
Overall Score [1] |
|||
|---|---|---|---|---|---|---|---|---|---|---|---|---|
| Benchmark | [-] | -49.2 | ||||||||||
| CRUJRA | [-] | -68.2 | -15.0 | 26.0 | 1.03 | 0.133 | 0.430 | 0.930 | 0.530 | 0.491 | ||
| CRUNCEPv7 | [-] | -69.6 | -17.6 | 28.1 | 1.03 | 0.119 | 0.416 | 0.930 | 0.493 | 0.475 | ||
| GSWP3v1 | [-] | -57.8 | -4.14 | 23.1 | 0.508 | 0.157 | 0.429 | 0.966 | 0.577 | 0.511 | ||
| WATCH | [-] | -54.2 | 12.8 | 33.7 | 0.00 | 0.0826 | 0.367 | 1.00 | 0.559 | 0.475 |
Download Data |
Period Mean (original grids) [Watt m-2] |
Bias [Watt m-2] |
RMSE [Watt m-2] |
Phase Shift [months] |
Bias Score [1] |
RMSE Score [1] |
Seasonal Cycle Score [1] |
Interannual Variability Score [1] |
Overall Score [1] |
|||
|---|---|---|---|---|---|---|---|---|---|---|---|---|
| Benchmark | [-] | -64.6 | ||||||||||
| CRUJRA | [-] | -68.2 | -8.80 | 19.6 | 2.97 | 0.140 | 0.410 | 0.543 | 0.732 | 0.447 | ||
| CRUNCEPv7 | [-] | -70.6 | -12.8 | 20.6 | 3.10 | 0.134 | 0.412 | 0.495 | 0.743 | 0.439 | ||
| GSWP3v1 | [-] | -67.2 | -5.05 | 13.7 | 1.02 | 0.195 | 0.475 | 0.861 | 0.791 | 0.559 | ||
| WATCH | [-] | -64.6 | -3.79 | 13.9 | 1.39 | 0.150 | 0.500 | 0.771 | 0.837 | 0.552 |
Download Data |
Period Mean (original grids) [Watt m-2] |
Bias [Watt m-2] |
RMSE [Watt m-2] |
Phase Shift [months] |
Bias Score [1] |
RMSE Score [1] |
Seasonal Cycle Score [1] |
Interannual Variability Score [1] |
Overall Score [1] |
|||
|---|---|---|---|---|---|---|---|---|---|---|---|---|
| Benchmark | [-] | -109. | ||||||||||
| CRUJRA | [-] | -108. | -2.94 | 9.72 | 0.00 | 0.287 | 0.630 | 1.00 | 0.896 | 0.689 | ||
| CRUNCEPv7 | [-] | -112. | -6.88 | 11.6 | 0.00 | 0.236 | 0.644 | 1.00 | 0.920 | 0.689 | ||
| GSWP3v1 | [-] | -112. | -4.76 | 12.8 | 1.03 | 0.262 | 0.587 | 0.930 | 0.784 | 0.630 | ||
| WATCH | [-] | -107. | -1.65 | 8.20 | 1.03 | 0.306 | 0.700 | 0.930 | 0.849 | 0.697 |
Download Data |
Period Mean (original grids) [Watt m-2] |
Bias [Watt m-2] |
RMSE [Watt m-2] |
Phase Shift [months] |
Bias Score [1] |
RMSE Score [1] |
Seasonal Cycle Score [1] |
Interannual Variability Score [1] |
Overall Score [1] |
|||
|---|---|---|---|---|---|---|---|---|---|---|---|---|
| Benchmark | [-] | -31.3 | ||||||||||
| CRUJRA | [-] | -55.4 | -27.6 | 30.8 | 3.07 | 0.0324 | 0.266 | 0.494 | 0.976 | 0.407 | ||
| CRUNCEPv7 | [-] | -56.4 | -29.0 | 32.7 | 3.07 | 0.0284 | 0.240 | 0.494 | 0.750 | 0.350 | ||
| GSWP3v1 | [-] | -37.6 | -4.87 | 19.1 | 4.05 | 0.309 | 0.159 | 0.251 | 0.455 | 0.267 | ||
| WATCH | [-] | -38.3 | -6.88 | 10.6 | 4.05 | 0.230 | 0.403 | 0.251 | 0.860 | 0.429 |
Download Data |
Period Mean (original grids) [Watt m-2] |
Bias [Watt m-2] |
RMSE [Watt m-2] |
Phase Shift [months] |
Bias Score [1] |
RMSE Score [1] |
Seasonal Cycle Score [1] |
Interannual Variability Score [1] |
Overall Score [1] |
|||
|---|---|---|---|---|---|---|---|---|---|---|---|---|
| Benchmark | [-] | -54.8 | ||||||||||
| CRUJRA | [-] | -68.4 | -13.2 | 18.9 | 5.85 | 0.217 | 0.294 | 0.0127 | 0.759 | 0.315 | ||
| CRUNCEPv7 | [-] | -69.5 | -14.2 | 19.7 | 6.04 | 0.199 | 0.291 | 0.000148 | 0.791 | 0.315 | ||
| GSWP3v1 | [-] | -63.9 | -7.44 | 12.3 | 0.413 | 0.359 | 0.449 | 0.972 | 0.849 | 0.616 | ||
| WATCH | [-] | -66.6 | -10.4 | 15.4 | 2.51 | 0.229 | 0.440 | 0.537 | 0.836 | 0.496 |
Download Data |
Period Mean (original grids) [Watt m-2] |
Bias [Watt m-2] |
RMSE [Watt m-2] |
Phase Shift [months] |
Bias Score [1] |
RMSE Score [1] |
Seasonal Cycle Score [1] |
Interannual Variability Score [1] |
Overall Score [1] |
|||
|---|---|---|---|---|---|---|---|---|---|---|---|---|
| Benchmark | [-] | -88.8 | ||||||||||
| CRUJRA | [-] | -88.8 | 0.0105 | 14.8 | 0.775 | 0.623 | 0.526 | 0.948 | 0.697 | 0.664 | ||
| CRUNCEPv7 | [-] | -90.8 | -2.00 | 13.1 | 0.00 | 0.662 | 0.546 | 1.00 | 0.760 | 0.703 | ||
| GSWP3v1 | [-] | -89.0 | -0.253 | 9.71 | 0.258 | 0.807 | 0.580 | 0.983 | 0.912 | 0.772 | ||
| WATCH | [-] | -86.5 | 2.78 | 9.61 | 0.00 | 0.737 | 0.568 | 1.00 | 0.898 | 0.754 |
Temporally integrated period mean