Mean State
Download Data |
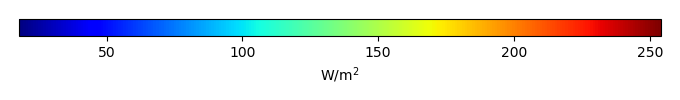
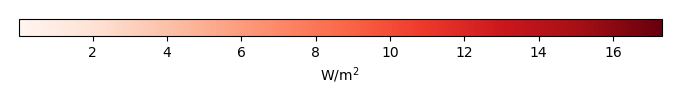
Period Mean (original grids) [W/m2] |
Model Period Mean (intersection) [W/m2] |
Model Period Mean (complement) [W/m2] |
Benchmark Period Mean (intersection) [W/m2] |
Benchmark Period Mean (complement) [W/m2] |
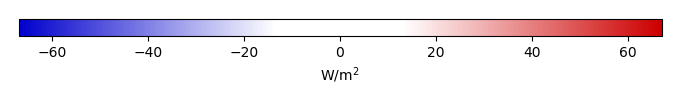
Bias [W/m2] |
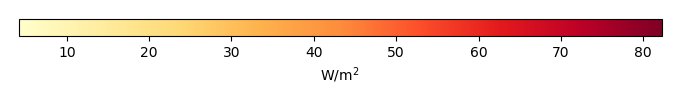
RMSE [W/m2] |
Phase Shift [months] |
Bias Score [1] |
RMSE Score [1] |
Seasonal Cycle Score [1] |
Spatial Distribution Score [1] |
Interannual Variability Score [1] |
Overall Score [1] |
|||
|---|---|---|---|---|---|---|---|---|---|---|---|---|---|---|---|---|---|
| Benchmark | [-] | 187. | |||||||||||||||
| CRUJRA | [-] | 189. | 189. | 186. | 206. | 2.93 | 15.9 | 1.31 | 0.684 | 0.481 | 0.825 | 0.973 | 0.462 | 0.651 | |||
| CRUNCEPv7 | [-] | 192. | 192. | 186. | 206. | 5.24 | 16.6 | 1.20 | 0.628 | 0.484 | 0.844 | 0.971 | 0.483 | 0.649 | |||
| GSWP3v1 | [-] | 182. | 182. | 186. | 206. | -4.45 | 15.1 | 0.823 | 0.728 | 0.493 | 0.901 | 0.939 | 0.801 | 0.726 | |||
| WATCH | [-] | 141. | 141. | 185. | 208. | -42.4 | 48.5 | 1.82 | 0.165 | 0.390 | 0.727 | 0.870 | 0.581 | 0.520 |
Download Data |
Period Mean (original grids) [W/m2] |
Model Period Mean (intersection) [W/m2] |
Model Period Mean (complement) [W/m2] |
Benchmark Period Mean (intersection) [W/m2] |
Benchmark Period Mean (complement) [W/m2] |
Bias [W/m2] |
RMSE [W/m2] |
Phase Shift [months] |
Bias Score [1] |
RMSE Score [1] |
Seasonal Cycle Score [1] |
Spatial Distribution Score [1] |
Interannual Variability Score [1] |
Overall Score [1] |
|||
|---|---|---|---|---|---|---|---|---|---|---|---|---|---|---|---|---|---|
| Benchmark | [-] | 198. | |||||||||||||||
| CRUJRA | [-] | 196. | 197. | 198. | 214. | -1.08 | 18.9 | 1.36 | 0.570 | 0.460 | 0.808 | 0.957 | 0.680 | 0.656 | |||
| CRUNCEPv7 | [-] | 198. | 198. | 198. | 214. | 0.401 | 18.8 | 1.49 | 0.568 | 0.466 | 0.781 | 0.946 | 0.742 | 0.661 | |||
| GSWP3v1 | [-] | 195. | 195. | 198. | 214. | -2.80 | 14.2 | 0.767 | 0.714 | 0.516 | 0.906 | 0.964 | 0.852 | 0.745 | |||
| WATCH | [-] | 160. | 161. | 198. | 213. | -36.0 | 40.6 | 1.02 | 0.230 | 0.480 | 0.877 | 0.904 | 0.594 | 0.594 |
Download Data |
Period Mean (original grids) [W/m2] |
Model Period Mean (intersection) [W/m2] |
Model Period Mean (complement) [W/m2] |
Benchmark Period Mean (intersection) [W/m2] |
Benchmark Period Mean (complement) [W/m2] |
Bias [W/m2] |
RMSE [W/m2] |
Phase Shift [months] |
Bias Score [1] |
RMSE Score [1] |
Seasonal Cycle Score [1] |
Spatial Distribution Score [1] |
Interannual Variability Score [1] |
Overall Score [1] |
|||
|---|---|---|---|---|---|---|---|---|---|---|---|---|---|---|---|---|---|
| Benchmark | [-] | 199. | |||||||||||||||
| CRUJRA | [-] | 193. | 193. | 198. | 219. | -5.75 | 17.9 | 1.15 | 0.680 | 0.560 | 0.831 | 0.857 | 0.546 | 0.672 | |||
| CRUNCEPv7 | [-] | 195. | 195. | 198. | 219. | -3.72 | 17.4 | 1.18 | 0.705 | 0.553 | 0.828 | 0.866 | 0.535 | 0.673 | |||
| GSWP3v1 | [-] | 196. | 196. | 198. | 219. | -2.87 | 15.6 | 0.787 | 0.797 | 0.569 | 0.893 | 0.996 | 0.748 | 0.762 | |||
| WATCH | [-] | 179. | 179. | 195. | 213. | -16.1 | 25.4 | 1.42 | 0.518 | 0.522 | 0.796 | 0.944 | 0.643 | 0.657 |
Download Data |
Period Mean (original grids) [W/m2] |
Model Period Mean (intersection) [W/m2] |
Model Period Mean (complement) [W/m2] |
Benchmark Period Mean (intersection) [W/m2] |
Benchmark Period Mean (complement) [W/m2] |
Bias [W/m2] |
RMSE [W/m2] |
Phase Shift [months] |
Bias Score [1] |
RMSE Score [1] |
Seasonal Cycle Score [1] |
Spatial Distribution Score [1] |
Interannual Variability Score [1] |
Overall Score [1] |
|||
|---|---|---|---|---|---|---|---|---|---|---|---|---|---|---|---|---|---|
| Benchmark | [-] | 70.7 | |||||||||||||||
| CRUJRA | [-] | 73.7 | 73.8 | 70.5 | 72.8 | 2.67 | 21.0 | 0.321 | 0.881 | 0.752 | 0.978 | 0.995 | 0.685 | 0.841 | |||
| CRUNCEPv7 | [-] | 75.8 | 75.9 | 70.5 | 72.8 | 3.73 | 21.2 | 0.340 | 0.867 | 0.756 | 0.977 | 0.971 | 0.680 | 0.835 | |||
| GSWP3v1 | [-] | 73.1 | 73.3 | 70.5 | 72.8 | 1.86 | 18.4 | 0.331 | 0.906 | 0.772 | 0.978 | 0.996 | 0.741 | 0.861 | |||
| WATCH | [-] | 65.6 | 65.7 | 74.7 | 74.7 | -9.24 | 17.8 | 0.477 | 0.858 | 0.774 | 0.968 | 0.990 | 0.694 | 0.843 |
Download Data |
Period Mean (original grids) [W/m2] |
Model Period Mean (intersection) [W/m2] |
Model Period Mean (complement) [W/m2] |
Benchmark Period Mean (intersection) [W/m2] |
Benchmark Period Mean (complement) [W/m2] |
Bias [W/m2] |
RMSE [W/m2] |
Phase Shift [months] |
Bias Score [1] |
RMSE Score [1] |
Seasonal Cycle Score [1] |
Spatial Distribution Score [1] |
Interannual Variability Score [1] |
Overall Score [1] |
|||
|---|---|---|---|---|---|---|---|---|---|---|---|---|---|---|---|---|---|
| Benchmark | [-] | 194. | |||||||||||||||
| CRUJRA | [-] | 188. | 188. | 190. | 207. | -0.100 | 17.9 | 1.36 | 0.604 | 0.453 | 0.798 | 0.862 | 0.516 | 0.614 | |||
| CRUNCEPv7 | [-] | 186. | 186. | 190. | 207. | -1.72 | 18.0 | 1.47 | 0.613 | 0.444 | 0.776 | 0.845 | 0.518 | 0.607 | |||
| GSWP3v1 | [-] | 175. | 175. | 190. | 207. | -11.2 | 19.1 | 1.25 | 0.542 | 0.437 | 0.802 | 0.963 | 0.769 | 0.658 | |||
| WATCH | [-] | 138. | 137. | 189. | 203. | -43.7 | 48.5 | 2.01 | 0.162 | 0.330 | 0.677 | 0.561 | 0.571 | 0.438 |
Download Data |
Period Mean (original grids) [W/m2] |
Model Period Mean (intersection) [W/m2] |
Model Period Mean (complement) [W/m2] |
Benchmark Period Mean (intersection) [W/m2] |
Benchmark Period Mean (complement) [W/m2] |
Bias [W/m2] |
RMSE [W/m2] |
Phase Shift [months] |
Bias Score [1] |
RMSE Score [1] |
Seasonal Cycle Score [1] |
Spatial Distribution Score [1] |
Interannual Variability Score [1] |
Overall Score [1] |
|||
|---|---|---|---|---|---|---|---|---|---|---|---|---|---|---|---|---|---|
| Benchmark | [-] | 97.8 | |||||||||||||||
| CRUJRA | [-] | 107. | 107. | 97.6 | 118. | 9.73 | 20.1 | 0.245 | 0.864 | 0.792 | 0.984 | 0.999 | 0.648 | 0.846 | |||
| CRUNCEPv7 | [-] | 108. | 108. | 97.6 | 118. | 11.0 | 20.9 | 0.266 | 0.846 | 0.793 | 0.982 | 0.998 | 0.724 | 0.856 | |||
| GSWP3v1 | [-] | 100. | 100. | 97.6 | 118. | 2.99 | 15.5 | 0.231 | 0.921 | 0.817 | 0.985 | 0.995 | 0.687 | 0.870 | |||
| WATCH | [-] | 87.3 | 87.4 | 102. | 119. | -14.4 | 16.1 | 0.320 | 0.812 | 0.814 | 0.976 | 0.987 | 0.727 | 0.855 |
Download Data |
Period Mean (original grids) [W/m2] |
Model Period Mean (intersection) [W/m2] |
Model Period Mean (complement) [W/m2] |
Benchmark Period Mean (intersection) [W/m2] |
Benchmark Period Mean (complement) [W/m2] |
Bias [W/m2] |
RMSE [W/m2] |
Phase Shift [months] |
Bias Score [1] |
RMSE Score [1] |
Seasonal Cycle Score [1] |
Spatial Distribution Score [1] |
Interannual Variability Score [1] |
Overall Score [1] |
|||
|---|---|---|---|---|---|---|---|---|---|---|---|---|---|---|---|---|---|
| Benchmark | [-] | 139. | |||||||||||||||
| CRUJRA | [-] | 146. | 146. | 138. | 154. | 8.14 | 23.7 | 0.429 | 0.767 | 0.734 | 0.964 | 0.986 | 0.664 | 0.808 | |||
| CRUNCEPv7 | [-] | 149. | 149. | 138. | 149. | 10.6 | 23.3 | 0.448 | 0.759 | 0.746 | 0.961 | 0.974 | 0.717 | 0.817 | |||
| GSWP3v1 | [-] | 135. | 135. | 138. | 149. | -2.61 | 15.9 | 0.340 | 0.883 | 0.767 | 0.972 | 0.999 | 0.666 | 0.842 | |||
| WATCH | [-] | 131. | 131. | 143. | 155. | -11.8 | 20.3 | 0.636 | 0.786 | 0.719 | 0.933 | 0.981 | 0.706 | 0.807 |
Download Data |
Period Mean (original grids) [W/m2] |
Model Period Mean (intersection) [W/m2] |
Model Period Mean (complement) [W/m2] |
Benchmark Period Mean (intersection) [W/m2] |
Benchmark Period Mean (complement) [W/m2] |
Bias [W/m2] |
RMSE [W/m2] |
Phase Shift [months] |
Bias Score [1] |
RMSE Score [1] |
Seasonal Cycle Score [1] |
Spatial Distribution Score [1] |
Interannual Variability Score [1] |
Overall Score [1] |
|||
|---|---|---|---|---|---|---|---|---|---|---|---|---|---|---|---|---|---|
| Benchmark | [-] | 181. | |||||||||||||||
| CRUJRA | [-] | 193. | 193. | 179. | 205. | 13.7 | 25.8 | 0.354 | 0.578 | 0.576 | 0.971 | 0.985 | 0.608 | 0.716 | |||
| CRUNCEPv7 | [-] | 193. | 193. | 179. | 205. | 13.7 | 25.4 | 0.335 | 0.581 | 0.587 | 0.973 | 0.961 | 0.653 | 0.724 | |||
| GSWP3v1 | [-] | 174. | 174. | 179. | 205. | -3.72 | 18.1 | 0.320 | 0.770 | 0.610 | 0.974 | 0.938 | 0.722 | 0.771 | |||
| WATCH | [-] | 159. | 159. | 180. | 203. | -19.6 | 30.1 | 0.645 | 0.535 | 0.515 | 0.928 | 0.933 | 0.719 | 0.691 |
Download Data |
Period Mean (original grids) [W/m2] |
Model Period Mean (intersection) [W/m2] |
Model Period Mean (complement) [W/m2] |
Benchmark Period Mean (intersection) [W/m2] |
Benchmark Period Mean (complement) [W/m2] |
Bias [W/m2] |
RMSE [W/m2] |
Phase Shift [months] |
Bias Score [1] |
RMSE Score [1] |
Seasonal Cycle Score [1] |
Spatial Distribution Score [1] |
Interannual Variability Score [1] |
Overall Score [1] |
|||
|---|---|---|---|---|---|---|---|---|---|---|---|---|---|---|---|---|---|
| Benchmark | [-] | 62.8 | |||||||||||||||
| CRUJRA | [-] | 69.6 | 69.9 | 63.2 | 54.4 | 5.58 | 18.8 | 0.299 | 0.892 | 0.769 | 0.980 | 0.983 | 0.690 | 0.847 | |||
| CRUNCEPv7 | [-] | 68.8 | 69.2 | 63.2 | 54.4 | 4.51 | 19.9 | 0.302 | 0.885 | 0.758 | 0.980 | 0.945 | 0.718 | 0.841 | |||
| GSWP3v1 | [-] | 64.7 | 65.0 | 63.2 | 54.4 | 0.684 | 15.6 | 0.199 | 0.931 | 0.792 | 0.987 | 0.990 | 0.748 | 0.873 | |||
| WATCH | [-] | 53.2 | 53.5 | 68.8 | 57.9 | -16.0 | 19.4 | 0.173 | 0.786 | 0.789 | 0.989 | 0.959 | 0.685 | 0.833 |
Download Data |
Period Mean (original grids) [W/m2] |
Model Period Mean (intersection) [W/m2] |
Model Period Mean (complement) [W/m2] |
Benchmark Period Mean (intersection) [W/m2] |
Benchmark Period Mean (complement) [W/m2] |
Bias [W/m2] |
RMSE [W/m2] |
Phase Shift [months] |
Bias Score [1] |
RMSE Score [1] |
Seasonal Cycle Score [1] |
Spatial Distribution Score [1] |
Interannual Variability Score [1] |
Overall Score [1] |
|||
|---|---|---|---|---|---|---|---|---|---|---|---|---|---|---|---|---|---|
| Benchmark | [-] | 198. | |||||||||||||||
| CRUJRA | [-] | 198. | 198. | 198. | 197. | -1.47 | 13.9 | 0.466 | 0.865 | 0.780 | 0.968 | 0.971 | 0.617 | 0.830 | |||
| CRUNCEPv7 | [-] | 196. | 196. | 198. | 197. | -4.02 | 14.4 | 0.511 | 0.855 | 0.775 | 0.965 | 0.977 | 0.660 | 0.834 | |||
| GSWP3v1 | [-] | 192. | 192. | 198. | 197. | -7.59 | 15.6 | 0.385 | 0.846 | 0.765 | 0.971 | 0.999 | 0.718 | 0.844 | |||
| WATCH | [-] | 195. | 195. | 193. | 189. | 0.443 | 14.4 | 0.589 | 0.861 | 0.755 | 0.939 | 0.999 | 0.793 | 0.850 |
Download Data |
Period Mean (original grids) [W/m2] |
Model Period Mean (intersection) [W/m2] |
Model Period Mean (complement) [W/m2] |
Benchmark Period Mean (intersection) [W/m2] |
Benchmark Period Mean (complement) [W/m2] |
Bias [W/m2] |
RMSE [W/m2] |
Phase Shift [months] |
Bias Score [1] |
RMSE Score [1] |
Seasonal Cycle Score [1] |
Spatial Distribution Score [1] |
Interannual Variability Score [1] |
Overall Score [1] |
|||
|---|---|---|---|---|---|---|---|---|---|---|---|---|---|---|---|---|---|
| Benchmark | [-] | 120. | |||||||||||||||
| CRUJRA | [-] | 129. | 129. | 118. | 145. | 12.6 | 22.2 | 0.218 | 0.804 | 0.799 | 0.986 | 0.993 | 0.725 | 0.851 | |||
| CRUNCEPv7 | [-] | 132. | 132. | 118. | 145. | 14.6 | 24.3 | 0.228 | 0.771 | 0.802 | 0.985 | 0.992 | 0.729 | 0.847 | |||
| GSWP3v1 | [-] | 113. | 113. | 118. | 145. | -2.30 | 13.6 | 0.227 | 0.921 | 0.839 | 0.985 | 0.990 | 0.660 | 0.872 | |||
| WATCH | [-] | 95.7 | 95.7 | 121. | 150. | -22.2 | 21.7 | 0.452 | 0.727 | 0.816 | 0.966 | 0.949 | 0.710 | 0.831 |
Download Data |
Period Mean (original grids) [W/m2] |
Model Period Mean (intersection) [W/m2] |
Model Period Mean (complement) [W/m2] |
Benchmark Period Mean (intersection) [W/m2] |
Benchmark Period Mean (complement) [W/m2] |
Bias [W/m2] |
RMSE [W/m2] |
Phase Shift [months] |
Bias Score [1] |
RMSE Score [1] |
Seasonal Cycle Score [1] |
Spatial Distribution Score [1] |
Interannual Variability Score [1] |
Overall Score [1] |
|||
|---|---|---|---|---|---|---|---|---|---|---|---|---|---|---|---|---|---|
| Benchmark | [-] | 163. | |||||||||||||||
| CRUJRA | [-] | 146. | 146. | 142. | 173. | 5.26 | 23.2 | 0.568 | 0.704 | 0.653 | 0.935 | 0.957 | 0.616 | 0.753 | |||
| CRUNCEPv7 | [-] | 144. | 144. | 142. | 173. | 1.68 | 19.7 | 0.586 | 0.746 | 0.686 | 0.933 | 0.995 | 0.614 | 0.777 | |||
| GSWP3v1 | [-] | 137. | 137. | 142. | 173. | -4.59 | 16.0 | 0.394 | 0.818 | 0.705 | 0.958 | 0.998 | 0.713 | 0.816 | |||
| WATCH | [-] | 126. | 126. | 143. | 172. | -16.8 | 23.9 | 0.697 | 0.649 | 0.673 | 0.914 | 0.987 | 0.661 | 0.760 |
Download Data |
Period Mean (original grids) [W/m2] |
Model Period Mean (intersection) [W/m2] |
Model Period Mean (complement) [W/m2] |
Benchmark Period Mean (intersection) [W/m2] |
Benchmark Period Mean (complement) [W/m2] |
Bias [W/m2] |
RMSE [W/m2] |
Phase Shift [months] |
Bias Score [1] |
RMSE Score [1] |
Seasonal Cycle Score [1] |
Spatial Distribution Score [1] |
Interannual Variability Score [1] |
Overall Score [1] |
|||
|---|---|---|---|---|---|---|---|---|---|---|---|---|---|---|---|---|---|
| Benchmark | [-] | 177. | |||||||||||||||
| CRUJRA | [-] | 166. | 166. | 175. | 219. | -8.00 | 17.9 | 0.459 | 0.711 | 0.753 | 0.954 | 0.983 | 0.668 | 0.804 | |||
| CRUNCEPv7 | [-] | 168. | 168. | 175. | 217. | -6.31 | 17.8 | 0.410 | 0.721 | 0.750 | 0.963 | 0.983 | 0.709 | 0.813 | |||
| GSWP3v1 | [-] | 162. | 162. | 175. | 217. | -12.0 | 18.0 | 0.296 | 0.708 | 0.763 | 0.978 | 0.960 | 0.674 | 0.808 | |||
| WATCH | [-] | 147. | 147. | 180. | 222. | -31.6 | 30.2 | 0.411 | 0.454 | 0.766 | 0.962 | 0.985 | 0.617 | 0.759 |
Download Data |
Period Mean (original grids) [W/m2] |
Model Period Mean (intersection) [W/m2] |
Model Period Mean (complement) [W/m2] |
Benchmark Period Mean (intersection) [W/m2] |
Benchmark Period Mean (complement) [W/m2] |
Bias [W/m2] |
RMSE [W/m2] |
Phase Shift [months] |
Bias Score [1] |
RMSE Score [1] |
Seasonal Cycle Score [1] |
Spatial Distribution Score [1] |
Interannual Variability Score [1] |
Overall Score [1] |
|||
|---|---|---|---|---|---|---|---|---|---|---|---|---|---|---|---|---|---|
| Benchmark | [-] | 69.7 | |||||||||||||||
| CRUJRA | [-] | 72.8 | 72.6 | 69.6 | 71.1 | 1.33 | 20.8 | 0.113 | 0.891 | 0.750 | 0.992 | 0.888 | 0.607 | 0.813 | |||
| CRUNCEPv7 | [-] | 75.4 | 75.2 | 69.6 | 71.1 | 3.21 | 20.9 | 0.131 | 0.879 | 0.755 | 0.991 | 0.911 | 0.614 | 0.818 | |||
| GSWP3v1 | [-] | 70.7 | 70.6 | 69.6 | 71.1 | -0.616 | 17.1 | 0.0938 | 0.915 | 0.784 | 0.994 | 0.981 | 0.747 | 0.867 | |||
| WATCH | [-] | 66.1 | 65.9 | 73.0 | 74.1 | -8.19 | 18.5 | 0.207 | 0.858 | 0.767 | 0.986 | 0.995 | 0.691 | 0.844 |
Download Data |
Period Mean (original grids) [W/m2] |
Model Period Mean (intersection) [W/m2] |
Model Period Mean (complement) [W/m2] |
Benchmark Period Mean (intersection) [W/m2] |
Benchmark Period Mean (complement) [W/m2] |
Bias [W/m2] |
RMSE [W/m2] |
Phase Shift [months] |
Bias Score [1] |
RMSE Score [1] |
Seasonal Cycle Score [1] |
Spatial Distribution Score [1] |
Interannual Variability Score [1] |
Overall Score [1] |
|||
|---|---|---|---|---|---|---|---|---|---|---|---|---|---|---|---|---|---|
| Benchmark | [-] | 204. | |||||||||||||||
| CRUJRA | [-] | 190. | 190. | 201. | 219. | -8.98 | 24.2 | 0.972 | 0.608 | 0.639 | 0.899 | 0.780 | 0.644 | 0.702 | |||
| CRUNCEPv7 | [-] | 190. | 190. | 201. | 219. | -9.17 | 24.0 | 0.944 | 0.610 | 0.642 | 0.906 | 0.791 | 0.668 | 0.710 | |||
| GSWP3v1 | [-] | 192. | 192. | 201. | 219. | -6.91 | 16.8 | 0.470 | 0.768 | 0.678 | 0.943 | 0.986 | 0.754 | 0.801 | |||
| WATCH | [-] | 181. | 181. | 202. | 221. | -20.1 | 29.1 | 0.893 | 0.546 | 0.638 | 0.873 | 0.850 | 0.766 | 0.718 |
Download Data |
Period Mean (original grids) [W/m2] |
Model Period Mean (intersection) [W/m2] |
Model Period Mean (complement) [W/m2] |
Benchmark Period Mean (intersection) [W/m2] |
Benchmark Period Mean (complement) [W/m2] |
Bias [W/m2] |
RMSE [W/m2] |
Phase Shift [months] |
Bias Score [1] |
RMSE Score [1] |
Seasonal Cycle Score [1] |
Spatial Distribution Score [1] |
Interannual Variability Score [1] |
Overall Score [1] |
|||
|---|---|---|---|---|---|---|---|---|---|---|---|---|---|---|---|---|---|
| Benchmark | [-] | 150. | |||||||||||||||
| CRUJRA | [-] | 154. | 154. | 148. | 192. | 6.73 | 17.5 | 0.400 | 0.860 | 0.778 | 0.974 | 0.992 | 0.577 | 0.827 | |||
| CRUNCEPv7 | [-] | 155. | 155. | 148. | 192. | 7.59 | 17.9 | 0.415 | 0.842 | 0.782 | 0.973 | 0.982 | 0.576 | 0.823 | |||
| GSWP3v1 | [-] | 145. | 145. | 148. | 192. | -2.06 | 13.6 | 0.274 | 0.938 | 0.797 | 0.982 | 0.987 | 0.700 | 0.867 | |||
| WATCH | [-] | 147. | 147. | 151. | 197. | -3.24 | 15.9 | 0.399 | 0.883 | 0.771 | 0.968 | 0.983 | 0.683 | 0.843 |
Download Data |
Period Mean (original grids) [W/m2] |
Model Period Mean (intersection) [W/m2] |
Model Period Mean (complement) [W/m2] |
Benchmark Period Mean (intersection) [W/m2] |
Benchmark Period Mean (complement) [W/m2] |
Bias [W/m2] |
RMSE [W/m2] |
Phase Shift [months] |
Bias Score [1] |
RMSE Score [1] |
Seasonal Cycle Score [1] |
Spatial Distribution Score [1] |
Interannual Variability Score [1] |
Overall Score [1] |
|||
|---|---|---|---|---|---|---|---|---|---|---|---|---|---|---|---|---|---|
| Benchmark | [-] | 110. | |||||||||||||||
| CRUJRA | [-] | 121. | 121. | 110. | 117. | 11.1 | 21.0 | 0.199 | 0.847 | 0.799 | 0.987 | 0.976 | 0.558 | 0.828 | |||
| CRUNCEPv7 | [-] | 122. | 123. | 110. | 117. | 12.7 | 21.6 | 0.262 | 0.827 | 0.803 | 0.983 | 0.975 | 0.557 | 0.825 | |||
| GSWP3v1 | [-] | 111. | 111. | 110. | 117. | 1.63 | 13.7 | 0.114 | 0.925 | 0.840 | 0.992 | 0.999 | 0.676 | 0.879 | |||
| WATCH | [-] | 109. | 109. | 114. | 124. | -5.43 | 13.5 | 0.374 | 0.905 | 0.816 | 0.971 | 0.988 | 0.727 | 0.871 |
Download Data |
Period Mean (original grids) [W/m2] |
Model Period Mean (intersection) [W/m2] |
Model Period Mean (complement) [W/m2] |
Benchmark Period Mean (intersection) [W/m2] |
Benchmark Period Mean (complement) [W/m2] |
Bias [W/m2] |
RMSE [W/m2] |
Phase Shift [months] |
Bias Score [1] |
RMSE Score [1] |
Seasonal Cycle Score [1] |
Spatial Distribution Score [1] |
Interannual Variability Score [1] |
Overall Score [1] |
|||
|---|---|---|---|---|---|---|---|---|---|---|---|---|---|---|---|---|---|
| Benchmark | [-] | 161. | |||||||||||||||
| CRUJRA | [-] | 153. | 153. | 161. | 163. | -7.92 | 17.8 | 0.217 | 0.874 | 0.805 | 0.985 | 0.970 | 0.610 | 0.842 | |||
| CRUNCEPv7 | [-] | 154. | 154. | 161. | 163. | -6.92 | 17.1 | 0.227 | 0.880 | 0.811 | 0.984 | 0.951 | 0.614 | 0.842 | |||
| GSWP3v1 | [-] | 159. | 159. | 161. | 163. | -1.43 | 14.3 | 0.202 | 0.931 | 0.822 | 0.986 | 0.985 | 0.698 | 0.874 | |||
| WATCH | [-] | 163. | 163. | 167. | 167. | -3.13 | 16.2 | 0.273 | 0.904 | 0.797 | 0.978 | 0.981 | 0.712 | 0.861 |
Download Data |
Period Mean (original grids) [W/m2] |
Model Period Mean (intersection) [W/m2] |
Model Period Mean (complement) [W/m2] |
Benchmark Period Mean (intersection) [W/m2] |
Benchmark Period Mean (complement) [W/m2] |
Bias [W/m2] |
RMSE [W/m2] |
Phase Shift [months] |
Bias Score [1] |
RMSE Score [1] |
Seasonal Cycle Score [1] |
Spatial Distribution Score [1] |
Interannual Variability Score [1] |
Overall Score [1] |
|||
|---|---|---|---|---|---|---|---|---|---|---|---|---|---|---|---|---|---|
| Benchmark | [-] | 179. | |||||||||||||||
| CRUJRA | [-] | 181. | 181. | 178. | 218. | 3.93 | 16.9 | 1.45 | 0.606 | 0.458 | 0.783 | 0.792 | 0.558 | 0.609 | |||
| CRUNCEPv7 | [-] | 182. | 182. | 178. | 218. | 5.20 | 17.0 | 1.48 | 0.611 | 0.453 | 0.778 | 0.816 | 0.579 | 0.615 | |||
| GSWP3v1 | [-] | 173. | 173. | 178. | 218. | -3.71 | 14.5 | 0.798 | 0.732 | 0.449 | 0.896 | 0.956 | 0.805 | 0.714 | |||
| WATCH | [-] | 152. | 152. | 178. | 219. | -25.8 | 32.8 | 1.74 | 0.269 | 0.368 | 0.752 | 0.950 | 0.551 | 0.543 |
Download Data |
Period Mean (original grids) [W/m2] |
Model Period Mean (intersection) [W/m2] |
Model Period Mean (complement) [W/m2] |
Benchmark Period Mean (intersection) [W/m2] |
Benchmark Period Mean (complement) [W/m2] |
Bias [W/m2] |
RMSE [W/m2] |
Phase Shift [months] |
Bias Score [1] |
RMSE Score [1] |
Seasonal Cycle Score [1] |
Spatial Distribution Score [1] |
Interannual Variability Score [1] |
Overall Score [1] |
|||
|---|---|---|---|---|---|---|---|---|---|---|---|---|---|---|---|---|---|
| Benchmark | [-] | 185. | |||||||||||||||
| CRUJRA | [-] | 185. | 185. | 184. | 202. | 0.689 | 20.4 | 0.822 | 0.676 | 0.622 | 0.903 | 0.798 | 0.518 | 0.690 | |||
| CRUNCEPv7 | [-] | 186. | 186. | 184. | 202. | 1.52 | 20.3 | 0.964 | 0.685 | 0.616 | 0.885 | 0.846 | 0.536 | 0.697 | |||
| GSWP3v1 | [-] | 180. | 180. | 184. | 202. | -4.33 | 15.8 | 0.702 | 0.816 | 0.642 | 0.912 | 0.970 | 0.717 | 0.783 | |||
| WATCH | [-] | 162. | 163. | 179. | 198. | -16.6 | 25.5 | 1.34 | 0.570 | 0.597 | 0.793 | 0.848 | 0.667 | 0.679 |
Download Data |
Period Mean (original grids) [W/m2] |
Model Period Mean (intersection) [W/m2] |
Model Period Mean (complement) [W/m2] |
Benchmark Period Mean (intersection) [W/m2] |
Benchmark Period Mean (complement) [W/m2] |
Bias [W/m2] |
RMSE [W/m2] |
Phase Shift [months] |
Bias Score [1] |
RMSE Score [1] |
Seasonal Cycle Score [1] |
Spatial Distribution Score [1] |
Interannual Variability Score [1] |
Overall Score [1] |
|||
|---|---|---|---|---|---|---|---|---|---|---|---|---|---|---|---|---|---|
| Benchmark | [-] | 178. | |||||||||||||||
| CRUJRA | [-] | 178. | 178. | 179. | 169. | -4.26 | 27.7 | 0.592 | 0.680 | 0.687 | 0.944 | 0.780 | 0.627 | 0.734 | |||
| CRUNCEPv7 | [-] | 178. | 178. | 179. | 169. | -4.32 | 27.3 | 0.588 | 0.684 | 0.689 | 0.942 | 0.801 | 0.637 | 0.740 | |||
| GSWP3v1 | [-] | 176. | 175. | 179. | 169. | -8.13 | 21.0 | 0.401 | 0.784 | 0.713 | 0.958 | 0.998 | 0.686 | 0.808 | |||
| WATCH | [-] | 173. | 172. | 174. | 162. | -5.80 | 26.3 | 0.513 | 0.709 | 0.702 | 0.944 | 0.994 | 0.687 | 0.790 |
Temporally integrated period mean