Mean State
Download Data |
Period Mean (original grids) [Pg] |
Model Period Mean (intersection) [Pg] |
Model Period Mean (complement) [Pg] |
Benchmark Period Mean (intersection) [Pg] |
Benchmark Period Mean (complement) [Pg] |
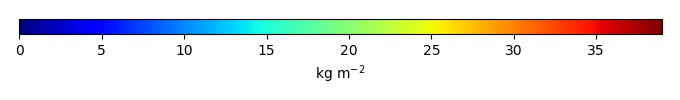
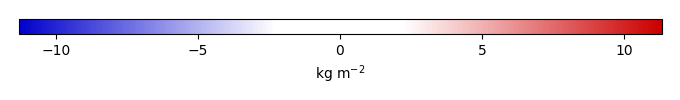
Bias [kg m-2] |
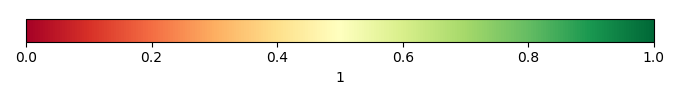
Bias Score [1] |
Spatial Distribution Score [1] |
Overall Score [1] |
|||
|---|---|---|---|---|---|---|---|---|---|---|---|---|
| Benchmark | [-] | 38.7 | ||||||||||
| CLM4.5_CRUNCEP | [-] | 58.7 | 58.9 | 0.216 | 38.7 | 0.0457 | 4.82 | 0.46 | 0.59 | 0.53 | ||
| CLM4.5_GSWP3 | [-] | 45.4 | 45.4 | 0.214 | 38.7 | 0.0457 | 1.81 | 0.61 | 0.78 | 0.69 | ||
| CLM4_CRUNCEP | [-] | 58.3 | 59.2 | 0.192 | 38.7 | 0.0457 | 4.86 | 0.54 | 0.70 | 0.62 | ||
| CLM4_GSWP3 | [-] | 49.5 | 50.3 | 0.175 | 38.7 | 0.0457 | 2.84 | 0.65 | 0.81 | 0.73 | ||
| CLM5_CRUNCEP | [-] | 42.9 | 43.3 | 0.201 | 38.7 | 0.0457 | 1.34 | 0.71 | 0.90 | 0.81 | ||
| CLM5_GSWP3 | [-] | 38.5 | 38.7 | 0.202 | 38.7 | 0.0457 | 0.293 | 0.77 | 0.95 | 0.86 |
Download Data |
Period Mean (original grids) [Pg] |
Model Period Mean (intersection) [Pg] |
Model Period Mean (complement) [Pg] |
Benchmark Period Mean (intersection) [Pg] |
Benchmark Period Mean (complement) [Pg] |
Bias [kg m-2] |
Bias Score [1] |
Spatial Distribution Score [1] |
Overall Score [1] |
|||
|---|---|---|---|---|---|---|---|---|---|---|---|---|
| Benchmark | [-] | 11.9 | ||||||||||
| CLM4.5_CRUNCEP | [-] | 2.44 | 2.14 | 0.0206 | 11.9 | 0.0196 | -1.46 | 0.43 | 0.52 | 0.48 | ||
| CLM4.5_GSWP3 | [-] | 2.26 | 2.02 | 0.0241 | 11.9 | 0.0196 | -1.47 | 0.43 | 0.38 | 0.40 | ||
| CLM4_CRUNCEP | [-] | 7.47 | 6.59 | 0.00842 | 11.9 | 0.0196 | -0.786 | 0.55 | 0.85 | 0.70 | ||
| CLM4_GSWP3 | [-] | 7.62 | 6.82 | 0.00883 | 11.9 | 0.0196 | -0.754 | 0.58 | 0.88 | 0.73 | ||
| CLM5_CRUNCEP | [-] | 3.54 | 3.10 | 0.0369 | 11.9 | 0.0196 | -1.31 | 0.46 | 0.62 | 0.54 | ||
| CLM5_GSWP3 | [-] | 3.25 | 2.85 | 0.0430 | 11.9 | 0.0196 | -1.35 | 0.45 | 0.59 | 0.52 |
Download Data |
Period Mean (original grids) [Pg] |
Model Period Mean (intersection) [Pg] |
Model Period Mean (complement) [Pg] |
Benchmark Period Mean (intersection) [Pg] |
Benchmark Period Mean (complement) [Pg] |
Bias [kg m-2] |
Bias Score [1] |
Spatial Distribution Score [1] |
Overall Score [1] |
|||
|---|---|---|---|---|---|---|---|---|---|---|---|---|
| Benchmark | [-] | 24.6 | ||||||||||
| CLM4.5_CRUNCEP | [-] | 6.79 | 6.36 | 0.272 | 24.5 | 0.0612 | -1.85 | 0.46 | 0.77 | 0.61 | ||
| CLM4.5_GSWP3 | [-] | 4.94 | 4.60 | 0.227 | 24.5 | 0.0612 | -2.04 | 0.44 | 0.70 | 0.57 | ||
| CLM4_CRUNCEP | [-] | 13.7 | 13.1 | 0.259 | 24.5 | 0.0612 | -1.15 | 0.50 | 0.75 | 0.63 | ||
| CLM4_GSWP3 | [-] | 10.9 | 10.4 | 0.239 | 24.5 | 0.0612 | -1.42 | 0.53 | 0.84 | 0.68 | ||
| CLM5_CRUNCEP | [-] | 17.0 | 16.3 | 0.393 | 24.5 | 0.0612 | -0.721 | 0.56 | 0.79 | 0.67 | ||
| CLM5_GSWP3 | [-] | 12.3 | 11.7 | 0.367 | 24.5 | 0.0612 | -1.21 | 0.51 | 0.80 | 0.65 |
Download Data |
Period Mean (original grids) [Pg] |
Model Period Mean (intersection) [Pg] |
Model Period Mean (complement) [Pg] |
Benchmark Period Mean (intersection) [Pg] |
Benchmark Period Mean (complement) [Pg] |
Bias [kg m-2] |
Bias Score [1] |
Spatial Distribution Score [1] |
Overall Score [1] |
|||
|---|---|---|---|---|---|---|---|---|---|---|---|---|
| Benchmark | [-] | 36.8 | ||||||||||
| CLM4.5_CRUNCEP | [-] | 66.7 | 63.5 | 2.96 | 35.7 | 1.10 | 15.1 | 0.40 | 0.84 | 0.62 | ||
| CLM4.5_GSWP3 | [-] | 54.1 | 51.6 | 2.16 | 35.7 | 1.10 | 10.3 | 0.53 | 0.87 | 0.70 | ||
| CLM4_CRUNCEP | [-] | 79.6 | 75.8 | 3.45 | 35.7 | 1.10 | 19.6 | 0.31 | 0.59 | 0.45 | ||
| CLM4_GSWP3 | [-] | 62.7 | 60.1 | 2.37 | 35.7 | 1.10 | 12.8 | 0.45 | 0.68 | 0.57 | ||
| CLM5_CRUNCEP | [-] | 49.4 | 46.8 | 2.28 | 35.7 | 1.10 | 8.69 | 0.62 | 0.94 | 0.78 | ||
| CLM5_GSWP3 | [-] | 39.9 | 37.9 | 1.80 | 35.7 | 1.10 | 5.14 | 0.72 | 0.92 | 0.82 |
Download Data |
Period Mean (original grids) [Pg] |
Model Period Mean (intersection) [Pg] |
Model Period Mean (complement) [Pg] |
Benchmark Period Mean (intersection) [Pg] |
Benchmark Period Mean (complement) [Pg] |
Bias [kg m-2] |
Bias Score [1] |
Spatial Distribution Score [1] |
Overall Score [1] |
|||
|---|---|---|---|---|---|---|---|---|---|---|---|---|
| Benchmark | [-] | 38.4 | ||||||||||
| CLM4.5_CRUNCEP | [-] | 44.2 | 31.5 | 13.2 | 38.3 | 0.0891 | -0.330 | 0.50 | 0.55 | 0.52 | ||
| CLM4.5_GSWP3 | [-] | 40.9 | 30.9 | 10.3 | 38.3 | 0.0891 | -0.477 | 0.53 | 0.60 | 0.57 | ||
| CLM4_CRUNCEP | [-] | 45.4 | 33.4 | 12.7 | 38.3 | 0.0891 | -0.0468 | 0.57 | 0.57 | 0.57 | ||
| CLM4_GSWP3 | [-] | 40.6 | 30.7 | 10.5 | 38.3 | 0.0891 | -0.539 | 0.58 | 0.64 | 0.61 | ||
| CLM5_CRUNCEP | [-] | 36.1 | 23.9 | 13.0 | 38.3 | 0.0891 | -1.35 | 0.54 | 0.69 | 0.61 | ||
| CLM5_GSWP3 | [-] | 31.6 | 23.2 | 9.15 | 38.3 | 0.0891 | -1.53 | 0.59 | 0.80 | 0.69 |
Download Data |
Period Mean (original grids) [Pg] |
Model Period Mean (intersection) [Pg] |
Model Period Mean (complement) [Pg] |
Benchmark Period Mean (intersection) [Pg] |
Benchmark Period Mean (complement) [Pg] |
Bias [kg m-2] |
Bias Score [1] |
Spatial Distribution Score [1] |
Overall Score [1] |
|||
|---|---|---|---|---|---|---|---|---|---|---|---|---|
| Benchmark | [-] | 43.7 | ||||||||||
| CLM4.5_CRUNCEP | [-] | 25.6 | 24.0 | 0.704 | 43.4 | 0.257 | -1.62 | 0.50 | 0.72 | 0.61 | ||
| CLM4.5_GSWP3 | [-] | 22.9 | 21.6 | 0.572 | 43.4 | 0.257 | -2.15 | 0.53 | 0.79 | 0.66 | ||
| CLM4_CRUNCEP | [-] | 30.3 | 28.7 | 0.664 | 43.4 | 0.257 | -1.07 | 0.61 | 0.81 | 0.71 | ||
| CLM4_GSWP3 | [-] | 28.1 | 26.8 | 0.491 | 43.4 | 0.257 | -1.57 | 0.61 | 0.86 | 0.73 | ||
| CLM5_CRUNCEP | [-] | 25.4 | 24.0 | 0.749 | 43.4 | 0.257 | -1.74 | 0.59 | 0.85 | 0.72 | ||
| CLM5_GSWP3 | [-] | 24.8 | 23.2 | 0.670 | 43.4 | 0.257 | -1.98 | 0.61 | 0.89 | 0.75 |
Download Data |
Period Mean (original grids) [Pg] |
Model Period Mean (intersection) [Pg] |
Model Period Mean (complement) [Pg] |
Benchmark Period Mean (intersection) [Pg] |
Benchmark Period Mean (complement) [Pg] |
Bias [kg m-2] |
Bias Score [1] |
Spatial Distribution Score [1] |
Overall Score [1] |
|||
|---|---|---|---|---|---|---|---|---|---|---|---|---|
| Benchmark | [-] | 13.7 | ||||||||||
| CLM4.5_CRUNCEP | [-] | 7.56 | 1.67 | 5.76 | 13.5 | 0.139 | -1.82 | 0.42 | 0.65 | 0.54 | ||
| CLM4.5_GSWP3 | [-] | 7.63 | 1.55 | 6.01 | 13.5 | 0.139 | -1.85 | 0.41 | 0.54 | 0.48 | ||
| CLM4_CRUNCEP | [-] | 7.52 | 1.46 | 5.92 | 13.5 | 0.139 | -1.87 | 0.41 | 0.62 | 0.52 | ||
| CLM4_GSWP3 | [-] | 7.61 | 1.66 | 5.85 | 13.5 | 0.139 | -1.85 | 0.42 | 0.58 | 0.50 | ||
| CLM5_CRUNCEP | [-] | 11.5 | 4.26 | 7.02 | 13.5 | 0.139 | -1.29 | 0.46 | 0.62 | 0.54 | ||
| CLM5_GSWP3 | [-] | 11.0 | 3.66 | 7.16 | 13.5 | 0.139 | -1.38 | 0.44 | 0.64 | 0.54 |
Download Data |
Period Mean (original grids) [Pg] |
Model Period Mean (intersection) [Pg] |
Model Period Mean (complement) [Pg] |
Benchmark Period Mean (intersection) [Pg] |
Benchmark Period Mean (complement) [Pg] |
Bias [kg m-2] |
Bias Score [1] |
Spatial Distribution Score [1] |
Overall Score [1] |
|||
|---|---|---|---|---|---|---|---|---|---|---|---|---|
| Benchmark | [-] | 352. | ||||||||||
| CLM4.5_CRUNCEP | [-] | 559. | 404. | 156. | 348. | 3.81 | 1.57 | 0.46 | 0.57 | 0.51 | ||
| CLM4.5_GSWP3 | [-] | 452. | 327. | 125. | 348. | 3.81 | 0.359 | 0.54 | 0.70 | 0.62 | ||
| CLM4_CRUNCEP | [-] | 582. | 459. | 123. | 348. | 3.81 | 2.37 | 0.47 | 0.48 | 0.48 | ||
| CLM4_GSWP3 | [-] | 467. | 376. | 90.9 | 348. | 3.81 | 0.986 | 0.54 | 0.63 | 0.58 | ||
| CLM5_CRUNCEP | [-] | 589. | 355. | 233. | 348. | 3.81 | 0.826 | 0.59 | 0.77 | 0.68 | ||
| CLM5_GSWP3 | [-] | 486. | 309. | 178. | 348. | 3.81 | 0.0653 | 0.64 | 0.85 | 0.75 |
Download Data |
Period Mean (original grids) [Pg] |
Model Period Mean (intersection) [Pg] |
Model Period Mean (complement) [Pg] |
Benchmark Period Mean (intersection) [Pg] |
Benchmark Period Mean (complement) [Pg] |
Bias [kg m-2] |
Bias Score [1] |
Spatial Distribution Score [1] |
Overall Score [1] |
|||
|---|---|---|---|---|---|---|---|---|---|---|---|---|
| Benchmark | [-] | 2.53 | ||||||||||
| CLM4.5_CRUNCEP | [-] | 1.53 | 0.121 | 1.41 | 2.53 | 0.00250 | -1.09 | 0.38 | 0.017 | 0.20 | ||
| CLM4.5_GSWP3 | [-] | 1.34 | 0.119 | 1.24 | 2.53 | 0.00250 | -1.08 | 0.39 | 0.020 | 0.20 | ||
| CLM4_CRUNCEP | [-] | 1.35 | 0.110 | 1.23 | 2.53 | 0.00250 | -1.09 | 0.38 | 0.011 | 0.20 | ||
| CLM4_GSWP3 | [-] | 1.32 | 0.117 | 1.21 | 2.53 | 0.00250 | -1.09 | 0.39 | 0.011 | 0.20 | ||
| CLM5_CRUNCEP | [-] | 1.68 | 0.229 | 1.44 | 2.53 | 0.00250 | -1.04 | 0.40 | 0.023 | 0.21 | ||
| CLM5_GSWP3 | [-] | 1.55 | 0.211 | 1.35 | 2.53 | 0.00250 | -1.04 | 0.39 | 0.021 | 0.21 |
Download Data |
Period Mean (original grids) [Pg] |
Model Period Mean (intersection) [Pg] |
Model Period Mean (complement) [Pg] |
Benchmark Period Mean (intersection) [Pg] |
Benchmark Period Mean (complement) [Pg] |
Bias [kg m-2] |
Bias Score [1] |
Spatial Distribution Score [1] |
Overall Score [1] |
|||
|---|---|---|---|---|---|---|---|---|---|---|---|---|
| Benchmark | [-] | 11.1 | ||||||||||
| CLM4.5_CRUNCEP | [-] | 11.4 | 10.6 | 0.532 | 10.9 | 0.149 | 1.23 | 0.51 | 0.58 | 0.55 | ||
| CLM4.5_GSWP3 | [-] | 8.47 | 7.78 | 0.434 | 10.9 | 0.149 | 0.0277 | 0.54 | 0.68 | 0.61 | ||
| CLM4_CRUNCEP | [-] | 5.39 | 4.73 | 0.362 | 10.9 | 0.149 | -1.15 | 0.45 | 0.57 | 0.51 | ||
| CLM4_GSWP3 | [-] | 4.64 | 4.09 | 0.284 | 10.9 | 0.149 | -1.52 | 0.45 | 0.66 | 0.56 | ||
| CLM5_CRUNCEP | [-] | 11.9 | 11.0 | 0.602 | 10.9 | 0.149 | 1.49 | 0.57 | 0.68 | 0.63 | ||
| CLM5_GSWP3 | [-] | 10.2 | 9.38 | 0.547 | 10.9 | 0.149 | 0.813 | 0.61 | 0.77 | 0.69 |
Download Data |
Period Mean (original grids) [Pg] |
Model Period Mean (intersection) [Pg] |
Model Period Mean (complement) [Pg] |
Benchmark Period Mean (intersection) [Pg] |
Benchmark Period Mean (complement) [Pg] |
Bias [kg m-2] |
Bias Score [1] |
Spatial Distribution Score [1] |
Overall Score [1] |
|||
|---|---|---|---|---|---|---|---|---|---|---|---|---|
| Benchmark | [-] | 1.55 | ||||||||||
| CLM4.5_CRUNCEP | [-] | 20.4 | 3.67 | 16.5 | 1.52 | 0.0247 | 3.74 | 0.49 | 0.47 | 0.48 | ||
| CLM4.5_GSWP3 | [-] | 14.7 | 1.63 | 12.9 | 1.52 | 0.0247 | 0.864 | 0.60 | 0.76 | 0.68 | ||
| CLM4_CRUNCEP | [-] | 16.4 | 3.22 | 13.1 | 1.52 | 0.0247 | 2.94 | 0.54 | 0.54 | 0.54 | ||
| CLM4_GSWP3 | [-] | 13.4 | 2.27 | 11.0 | 1.52 | 0.0247 | 1.54 | 0.64 | 0.77 | 0.70 | ||
| CLM5_CRUNCEP | [-] | 17.7 | 3.58 | 14.0 | 1.52 | 0.0247 | 3.61 | 0.47 | 0.49 | 0.48 | ||
| CLM5_GSWP3 | [-] | 11.9 | 1.32 | 10.5 | 1.52 | 0.0247 | 0.434 | 0.55 | 0.68 | 0.62 |
Download Data |
Period Mean (original grids) [Pg] |
Model Period Mean (intersection) [Pg] |
Model Period Mean (complement) [Pg] |
Benchmark Period Mean (intersection) [Pg] |
Benchmark Period Mean (complement) [Pg] |
Bias [kg m-2] |
Bias Score [1] |
Spatial Distribution Score [1] |
Overall Score [1] |
|||
|---|---|---|---|---|---|---|---|---|---|---|---|---|
| Benchmark | [-] | 0.219 | ||||||||||
| CLM4.5_CRUNCEP | [-] | 3.41 | 0.0679 | 3.39 | 0.219 | 0.00 | -0.490 | 0.45 | 0.13 | 0.29 | ||
| CLM4.5_GSWP3 | [-] | 2.99 | 0.0814 | 2.95 | 0.219 | 0.00 | -0.445 | 0.47 | 0.13 | 0.30 | ||
| CLM4_CRUNCEP | [-] | 5.10 | 0.0841 | 5.06 | 0.219 | 0.00 | -0.442 | 0.46 | 0.17 | 0.32 | ||
| CLM4_GSWP3 | [-] | 3.99 | 0.100 | 3.95 | 0.219 | 0.00 | -0.388 | 0.49 | 0.19 | 0.34 | ||
| CLM5_CRUNCEP | [-] | 3.48 | 0.0759 | 3.42 | 0.219 | 0.00 | -0.459 | 0.46 | 0.099 | 0.28 | ||
| CLM5_GSWP3 | [-] | 3.04 | 0.0844 | 2.99 | 0.219 | 0.00 | -0.433 | 0.47 | 0.082 | 0.27 |
Download Data |
Period Mean (original grids) [Pg] |
Model Period Mean (intersection) [Pg] |
Model Period Mean (complement) [Pg] |
Benchmark Period Mean (intersection) [Pg] |
Benchmark Period Mean (complement) [Pg] |
Bias [kg m-2] |
Bias Score [1] |
Spatial Distribution Score [1] |
Overall Score [1] |
|||
|---|---|---|---|---|---|---|---|---|---|---|---|---|
| Benchmark | [-] | 100. | ||||||||||
| CLM4.5_CRUNCEP | [-] | 181. | 180. | 0.479 | 100. | 0.0690 | 9.91 | 0.44 | 0.55 | 0.49 | ||
| CLM4.5_GSWP3 | [-] | 141. | 141. | 0.404 | 100. | 0.0690 | 5.17 | 0.59 | 0.67 | 0.63 | ||
| CLM4_CRUNCEP | [-] | 208. | 207. | 0.431 | 100. | 0.0690 | 13.1 | 0.39 | 0.39 | 0.39 | ||
| CLM4_GSWP3 | [-] | 159. | 158. | 0.331 | 100. | 0.0690 | 7.20 | 0.51 | 0.49 | 0.50 | ||
| CLM5_CRUNCEP | [-] | 152. | 151. | 0.453 | 100. | 0.0690 | 6.40 | 0.60 | 0.84 | 0.72 | ||
| CLM5_GSWP3 | [-] | 128. | 128. | 0.396 | 100. | 0.0690 | 3.63 | 0.71 | 0.92 | 0.81 |
Download Data |
Period Mean (original grids) [Pg] |
Model Period Mean (intersection) [Pg] |
Model Period Mean (complement) [Pg] |
Benchmark Period Mean (intersection) [Pg] |
Benchmark Period Mean (complement) [Pg] |
Bias [kg m-2] |
Bias Score [1] |
Spatial Distribution Score [1] |
Overall Score [1] |
|||
|---|---|---|---|---|---|---|---|---|---|---|---|---|
| Benchmark | [-] | 18.4 | ||||||||||
| CLM4.5_CRUNCEP | [-] | 15.4 | 15.3 | 0.235 | 18.4 | 0.0281 | -0.252 | 0.53 | 0.49 | 0.51 | ||
| CLM4.5_GSWP3 | [-] | 13.5 | 13.4 | 0.195 | 18.4 | 0.0281 | -0.573 | 0.52 | 0.57 | 0.54 | ||
| CLM4_CRUNCEP | [-] | 20.1 | 20.3 | 0.146 | 18.4 | 0.0281 | 0.485 | 0.53 | 0.45 | 0.49 | ||
| CLM4_GSWP3 | [-] | 17.8 | 17.9 | 0.122 | 18.4 | 0.0281 | 0.0899 | 0.55 | 0.53 | 0.54 | ||
| CLM5_CRUNCEP | [-] | 21.7 | 21.7 | 0.382 | 18.4 | 0.0281 | 0.759 | 0.62 | 0.73 | 0.67 | ||
| CLM5_GSWP3 | [-] | 21.8 | 21.8 | 0.347 | 18.4 | 0.0281 | 0.735 | 0.55 | 0.58 | 0.56 |
Download Data |
Period Mean (original grids) [Pg] |
Model Period Mean (intersection) [Pg] |
Model Period Mean (complement) [Pg] |
Benchmark Period Mean (intersection) [Pg] |
Benchmark Period Mean (complement) [Pg] |
Bias [kg m-2] |
Bias Score [1] |
Spatial Distribution Score [1] |
Overall Score [1] |
|||
|---|---|---|---|---|---|---|---|---|---|---|---|---|
| Benchmark | [-] | 7.28 | ||||||||||
| CLM4.5_CRUNCEP | [-] | 4.36 | 4.41 | 0.104 | 7.15 | 0.128 | -0.255 | 0.47 | 0.52 | 0.49 | ||
| CLM4.5_GSWP3 | [-] | 5.00 | 5.06 | 0.113 | 7.15 | 0.128 | -0.0225 | 0.47 | 0.51 | 0.49 | ||
| CLM4_CRUNCEP | [-] | 3.86 | 4.08 | 0.0995 | 7.15 | 0.128 | -0.427 | 0.49 | 0.52 | 0.50 | ||
| CLM4_GSWP3 | [-] | 4.80 | 5.04 | 0.0866 | 7.15 | 0.128 | -0.164 | 0.49 | 0.50 | 0.49 | ||
| CLM5_CRUNCEP | [-] | 5.25 | 5.14 | 0.150 | 7.15 | 0.128 | 0.169 | 0.53 | 0.53 | 0.53 | ||
| CLM5_GSWP3 | [-] | 6.25 | 6.14 | 0.145 | 7.15 | 0.128 | 0.387 | 0.52 | 0.57 | 0.55 |
Temporally integrated period mean