Mean State
Download Data |
Period Mean (original grids) [Pg] |
Model Period Mean (intersection) [Pg] |
Model Period Mean (complement) [Pg] |
Benchmark Period Mean (intersection) [Pg] |
Benchmark Period Mean (complement) [Pg] |
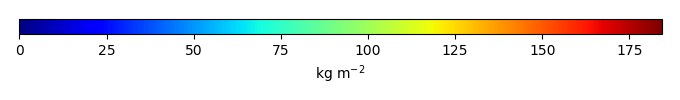
Bias [kg m-2] |
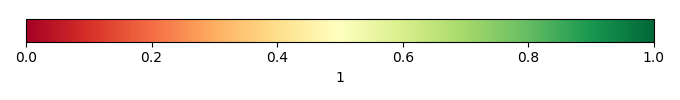
Bias Score [1] |
Spatial Distribution Score [1] |
Overall Score [1] |
|||
|---|---|---|---|---|---|---|---|---|---|---|---|---|
| Benchmark | [-] | 34.1 | ||||||||||
| CLM4.5_CRUNCEP | [-] | 38.1 | 38.5 | 0.300 | 33.8 | 0.315 | 1.53 | 0.60 | 0.77 | 0.68 | ||
| CLM4.5_GSWP3 | [-] | 30.8 | 31.1 | 0.289 | 33.8 | 0.315 | -0.144 | 0.67 | 0.91 | 0.79 | ||
| CLM4_CRUNCEP | [-] | 31.5 | 32.8 | 0.148 | 33.8 | 0.315 | 0.0325 | 0.65 | 0.89 | 0.77 | ||
| CLM4_GSWP3 | [-] | 26.6 | 27.7 | 0.129 | 33.8 | 0.315 | -1.13 | 0.70 | 0.95 | 0.82 | ||
| CLM5_CRUNCEP | [-] | 41.4 | 42.1 | 0.279 | 33.8 | 0.315 | 2.30 | 0.62 | 0.80 | 0.71 | ||
| CLM5_GSWP3 | [-] | 30.5 | 30.9 | 0.269 | 33.8 | 0.315 | -0.226 | 0.73 | 0.95 | 0.84 |
Download Data |
Period Mean (original grids) [Pg] |
Model Period Mean (intersection) [Pg] |
Model Period Mean (complement) [Pg] |
Benchmark Period Mean (intersection) [Pg] |
Benchmark Period Mean (complement) [Pg] |
Bias [kg m-2] |
Bias Score [1] |
Spatial Distribution Score [1] |
Overall Score [1] |
|||
|---|---|---|---|---|---|---|---|---|---|---|---|---|
| Benchmark | [-] | 44.8 | ||||||||||
| CLM4.5_CRUNCEP | [-] | 17.6 | 16.7 | 0.0228 | 44.4 | 0.478 | -4.03 | 0.53 | 0.76 | 0.65 | ||
| CLM4.5_GSWP3 | [-] | 16.6 | 15.8 | 0.0253 | 44.4 | 0.478 | -4.14 | 0.53 | 0.69 | 0.61 | ||
| CLM4_CRUNCEP | [-] | 22.1 | 20.8 | 0.00819 | 44.4 | 0.478 | -3.43 | 0.59 | 0.89 | 0.74 | ||
| CLM4_GSWP3 | [-] | 22.4 | 21.2 | 0.00988 | 44.4 | 0.478 | -3.36 | 0.61 | 0.86 | 0.74 | ||
| CLM5_CRUNCEP | [-] | 17.5 | 16.5 | 0.0170 | 44.4 | 0.478 | -4.09 | 0.51 | 0.85 | 0.68 | ||
| CLM5_GSWP3 | [-] | 15.3 | 14.4 | 0.0241 | 44.4 | 0.478 | -4.37 | 0.50 | 0.78 | 0.64 |
Download Data |
Period Mean (original grids) [Pg] |
Model Period Mean (intersection) [Pg] |
Model Period Mean (complement) [Pg] |
Benchmark Period Mean (intersection) [Pg] |
Benchmark Period Mean (complement) [Pg] |
Bias [kg m-2] |
Bias Score [1] |
Spatial Distribution Score [1] |
Overall Score [1] |
|||
|---|---|---|---|---|---|---|---|---|---|---|---|---|
| Benchmark | [-] | 60.1 | ||||||||||
| CLM4.5_CRUNCEP | [-] | 36.0 | 34.9 | 0.936 | 59.3 | 0.762 | -2.13 | 0.63 | 0.90 | 0.76 | ||
| CLM4.5_GSWP3 | [-] | 30.0 | 29.1 | 0.783 | 59.3 | 0.762 | -2.80 | 0.59 | 0.87 | 0.73 | ||
| CLM4_CRUNCEP | [-] | 27.6 | 27.0 | 0.389 | 59.3 | 0.762 | -3.26 | 0.58 | 0.83 | 0.70 | ||
| CLM4_GSWP3 | [-] | 25.6 | 25.1 | 0.326 | 59.3 | 0.762 | -3.45 | 0.58 | 0.71 | 0.64 | ||
| CLM5_CRUNCEP | [-] | 40.1 | 38.8 | 0.989 | 59.3 | 0.762 | -1.70 | 0.59 | 0.79 | 0.69 | ||
| CLM5_GSWP3 | [-] | 28.7 | 27.8 | 0.749 | 59.3 | 0.762 | -2.94 | 0.55 | 0.84 | 0.69 |
Download Data |
Period Mean (original grids) [Pg] |
Model Period Mean (intersection) [Pg] |
Model Period Mean (complement) [Pg] |
Benchmark Period Mean (intersection) [Pg] |
Benchmark Period Mean (complement) [Pg] |
Bias [kg m-2] |
Bias Score [1] |
Spatial Distribution Score [1] |
Overall Score [1] |
|||
|---|---|---|---|---|---|---|---|---|---|---|---|---|
| Benchmark | [-] | 11.1 | ||||||||||
| CLM4.5_CRUNCEP | [-] | 93.5 | 8.35 | 85.4 | 10.3 | 0.803 | 7.44 | 0.44 | 0.21 | 0.33 | ||
| CLM4.5_GSWP3 | [-] | 66.4 | 6.59 | 59.9 | 10.3 | 0.803 | 0.520 | 0.48 | 0.25 | 0.36 | ||
| CLM4_CRUNCEP | [-] | 7.93 | 0.889 | 7.17 | 10.3 | 0.803 | -16.4 | 0.43 | 0.24 | 0.34 | ||
| CLM4_GSWP3 | [-] | 7.10 | 0.748 | 6.47 | 10.3 | 0.803 | -16.8 | 0.42 | 0.16 | 0.29 | ||
| CLM5_CRUNCEP | [-] | 248. | 14.7 | 234. | 10.3 | 0.803 | 23.0 | 0.40 | 0.074 | 0.24 | ||
| CLM5_GSWP3 | [-] | 101. | 9.11 | 91.2 | 10.3 | 0.803 | 7.12 | 0.43 | 0.19 | 0.31 |
Download Data |
Period Mean (original grids) [Pg] |
Model Period Mean (intersection) [Pg] |
Model Period Mean (complement) [Pg] |
Benchmark Period Mean (intersection) [Pg] |
Benchmark Period Mean (complement) [Pg] |
Bias [kg m-2] |
Bias Score [1] |
Spatial Distribution Score [1] |
Overall Score [1] |
|||
|---|---|---|---|---|---|---|---|---|---|---|---|---|
| Benchmark | [-] | 55.7 | ||||||||||
| CLM4.5_CRUNCEP | [-] | 29.3 | 27.4 | 1.64 | 50.7 | 4.99 | -3.00 | 0.69 | 0.36 | 0.53 | ||
| CLM4.5_GSWP3 | [-] | 24.0 | 22.5 | 1.29 | 50.7 | 4.99 | -4.84 | 0.67 | 0.37 | 0.52 | ||
| CLM4_CRUNCEP | [-] | 24.7 | 23.3 | 1.21 | 50.7 | 4.99 | -5.18 | 0.68 | 0.18 | 0.43 | ||
| CLM4_GSWP3 | [-] | 21.0 | 19.9 | 1.00 | 50.7 | 4.99 | -6.63 | 0.65 | 0.16 | 0.40 | ||
| CLM5_CRUNCEP | [-] | 25.3 | 23.5 | 1.53 | 50.7 | 4.99 | -4.37 | 0.69 | 0.30 | 0.50 | ||
| CLM5_GSWP3 | [-] | 20.6 | 19.1 | 1.31 | 50.7 | 4.99 | -6.12 | 0.65 | 0.27 | 0.46 |
Download Data |
Period Mean (original grids) [Pg] |
Model Period Mean (intersection) [Pg] |
Model Period Mean (complement) [Pg] |
Benchmark Period Mean (intersection) [Pg] |
Benchmark Period Mean (complement) [Pg] |
Bias [kg m-2] |
Bias Score [1] |
Spatial Distribution Score [1] |
Overall Score [1] |
|||
|---|---|---|---|---|---|---|---|---|---|---|---|---|
| Benchmark | [-] | 65.6 | ||||||||||
| CLM4.5_CRUNCEP | [-] | 156. | 67.7 | 84.9 | 65.2 | 0.461 | 1.04 | 0.67 | 0.83 | 0.75 | ||
| CLM4.5_GSWP3 | [-] | 111. | 48.0 | 60.1 | 65.2 | 0.461 | -3.64 | 0.67 | 0.64 | 0.65 | ||
| CLM4_CRUNCEP | [-] | 85.6 | 37.9 | 45.7 | 65.2 | 0.461 | -6.33 | 0.62 | 0.47 | 0.54 | ||
| CLM4_GSWP3 | [-] | 62.4 | 22.3 | 38.5 | 65.2 | 0.461 | -10.1 | 0.52 | 0.30 | 0.41 | ||
| CLM5_CRUNCEP | [-] | 294. | 93.5 | 195. | 65.2 | 0.461 | 7.25 | 0.62 | 0.94 | 0.78 | ||
| CLM5_GSWP3 | [-] | 133. | 59.0 | 71.0 | 65.2 | 0.461 | -1.06 | 0.71 | 0.84 | 0.77 |
Download Data |
Period Mean (original grids) [Pg] |
Model Period Mean (intersection) [Pg] |
Model Period Mean (complement) [Pg] |
Benchmark Period Mean (intersection) [Pg] |
Benchmark Period Mean (complement) [Pg] |
Bias [kg m-2] |
Bias Score [1] |
Spatial Distribution Score [1] |
Overall Score [1] |
|||
|---|---|---|---|---|---|---|---|---|---|---|---|---|
| Benchmark | [-] | 143. | ||||||||||
| CLM4.5_CRUNCEP | [-] | 118. | 114. | 7.42 | 141. | 2.09 | -1.12 | 0.61 | 0.74 | 0.68 | ||
| CLM4.5_GSWP3 | [-] | 96.4 | 92.5 | 5.79 | 141. | 2.09 | -2.36 | 0.63 | 0.86 | 0.75 | ||
| CLM4_CRUNCEP | [-] | 86.3 | 84.2 | 4.13 | 141. | 2.09 | -2.99 | 0.59 | 0.85 | 0.72 | ||
| CLM4_GSWP3 | [-] | 67.8 | 65.7 | 3.64 | 141. | 2.09 | -4.10 | 0.57 | 0.88 | 0.72 | ||
| CLM5_CRUNCEP | [-] | 122. | 112. | 14.0 | 141. | 2.09 | -1.29 | 0.66 | 0.74 | 0.70 | ||
| CLM5_GSWP3 | [-] | 91.8 | 88.3 | 5.88 | 141. | 2.09 | -2.73 | 0.62 | 0.91 | 0.77 |
Download Data |
Period Mean (original grids) [Pg] |
Model Period Mean (intersection) [Pg] |
Model Period Mean (complement) [Pg] |
Benchmark Period Mean (intersection) [Pg] |
Benchmark Period Mean (complement) [Pg] |
Bias [kg m-2] |
Bias Score [1] |
Spatial Distribution Score [1] |
Overall Score [1] |
|||
|---|---|---|---|---|---|---|---|---|---|---|---|---|
| Benchmark | [-] | 58.4 | ||||||||||
| CLM4.5_CRUNCEP | [-] | 46.4 | 44.4 | 1.04 | 56.8 | 1.57 | -0.617 | 0.64 | 0.67 | 0.65 | ||
| CLM4.5_GSWP3 | [-] | 38.1 | 36.3 | 0.948 | 56.8 | 1.57 | -1.83 | 0.67 | 0.82 | 0.74 | ||
| CLM4_CRUNCEP | [-] | 36.4 | 34.9 | 0.544 | 56.8 | 1.57 | -2.35 | 0.65 | 0.82 | 0.74 | ||
| CLM4_GSWP3 | [-] | 31.2 | 30.0 | 0.429 | 56.8 | 1.57 | -3.14 | 0.65 | 0.93 | 0.79 | ||
| CLM5_CRUNCEP | [-] | 37.4 | 35.7 | 0.948 | 56.8 | 1.57 | -1.91 | 0.63 | 0.77 | 0.70 | ||
| CLM5_GSWP3 | [-] | 33.0 | 31.1 | 0.855 | 56.8 | 1.57 | -2.67 | 0.66 | 0.86 | 0.76 |
Download Data |
Period Mean (original grids) [Pg] |
Model Period Mean (intersection) [Pg] |
Model Period Mean (complement) [Pg] |
Benchmark Period Mean (intersection) [Pg] |
Benchmark Period Mean (complement) [Pg] |
Bias [kg m-2] |
Bias Score [1] |
Spatial Distribution Score [1] |
Overall Score [1] |
|||
|---|---|---|---|---|---|---|---|---|---|---|---|---|
| Benchmark | [-] | 7.78 | ||||||||||
| CLM4.5_CRUNCEP | [-] | 95.5 | 8.25 | 88.6 | 7.36 | 0.414 | 9.15 | 0.43 | 0.26 | 0.34 | ||
| CLM4.5_GSWP3 | [-] | 66.3 | 6.79 | 60.5 | 7.36 | 0.414 | 3.34 | 0.41 | 0.24 | 0.33 | ||
| CLM4_CRUNCEP | [-] | 5.53 | 0.647 | 5.33 | 7.36 | 0.414 | -13.9 | 0.42 | 0.24 | 0.33 | ||
| CLM4_GSWP3 | [-] | 4.45 | 0.421 | 4.35 | 7.36 | 0.414 | -14.7 | 0.40 | 0.12 | 0.26 | ||
| CLM5_CRUNCEP | [-] | 254. | 13.8 | 243. | 7.36 | 0.414 | 26.1 | 0.44 | 0.066 | 0.25 | ||
| CLM5_GSWP3 | [-] | 119. | 9.41 | 111. | 7.36 | 0.414 | 11.0 | 0.45 | 0.21 | 0.33 |
Download Data |
Period Mean (original grids) [Pg] |
Model Period Mean (intersection) [Pg] |
Model Period Mean (complement) [Pg] |
Benchmark Period Mean (intersection) [Pg] |
Benchmark Period Mean (complement) [Pg] |
Bias [kg m-2] |
Bias Score [1] |
Spatial Distribution Score [1] |
Overall Score [1] |
|||
|---|---|---|---|---|---|---|---|---|---|---|---|---|
| Benchmark | [-] | 58.9 | ||||||||||
| CLM4.5_CRUNCEP | [-] | 24.8 | 23.4 | 1.25 | 57.4 | 1.53 | -3.27 | 0.57 | 0.69 | 0.63 | ||
| CLM4.5_GSWP3 | [-] | 25.7 | 24.2 | 1.35 | 57.4 | 1.53 | -3.11 | 0.57 | 0.67 | 0.62 | ||
| CLM4_CRUNCEP | [-] | 15.7 | 15.0 | 0.635 | 57.4 | 1.53 | -4.50 | 0.51 | 0.81 | 0.66 | ||
| CLM4_GSWP3 | [-] | 17.9 | 17.1 | 0.623 | 57.4 | 1.53 | -4.25 | 0.53 | 0.85 | 0.69 | ||
| CLM5_CRUNCEP | [-] | 30.2 | 28.1 | 1.77 | 57.4 | 1.53 | -2.42 | 0.53 | 0.38 | 0.45 | ||
| CLM5_GSWP3 | [-] | 27.6 | 25.8 | 1.60 | 57.4 | 1.53 | -2.75 | 0.54 | 0.47 | 0.51 |
Download Data |
Period Mean (original grids) [Pg] |
Model Period Mean (intersection) [Pg] |
Model Period Mean (complement) [Pg] |
Benchmark Period Mean (intersection) [Pg] |
Benchmark Period Mean (complement) [Pg] |
Bias [kg m-2] |
Bias Score [1] |
Spatial Distribution Score [1] |
Overall Score [1] |
|||
|---|---|---|---|---|---|---|---|---|---|---|---|---|
| Benchmark | [-] | 61.8 | ||||||||||
| CLM4.5_CRUNCEP | [-] | 57.3 | 52.7 | 3.82 | 60.2 | 1.58 | 0.195 | 0.67 | 0.79 | 0.73 | ||
| CLM4.5_GSWP3 | [-] | 47.1 | 43.5 | 3.03 | 60.2 | 1.58 | -1.71 | 0.68 | 0.65 | 0.66 | ||
| CLM4_CRUNCEP | [-] | 24.8 | 23.4 | 1.03 | 60.2 | 1.58 | -5.97 | 0.59 | 0.41 | 0.50 | ||
| CLM4_GSWP3 | [-] | 19.0 | 18.0 | 0.773 | 60.2 | 1.58 | -7.13 | 0.54 | 0.26 | 0.40 | ||
| CLM5_CRUNCEP | [-] | 67.9 | 60.9 | 5.98 | 60.2 | 1.58 | 2.18 | 0.70 | 0.95 | 0.83 | ||
| CLM5_GSWP3 | [-] | 44.2 | 39.3 | 4.23 | 60.2 | 1.58 | -2.36 | 0.72 | 0.85 | 0.78 |
Download Data |
Period Mean (original grids) [Pg] |
Model Period Mean (intersection) [Pg] |
Model Period Mean (complement) [Pg] |
Benchmark Period Mean (intersection) [Pg] |
Benchmark Period Mean (complement) [Pg] |
Bias [kg m-2] |
Bias Score [1] |
Spatial Distribution Score [1] |
Overall Score [1] |
|||
|---|---|---|---|---|---|---|---|---|---|---|---|---|
| Benchmark | [-] | 1.09e+03 | ||||||||||
| CLM4.5_CRUNCEP | [-] | 1.27e+03 | 736. | 535. | 1.03e+03 | 55.6 | -1.63 | 0.62 | 0.76 | 0.69 | ||
| CLM4.5_GSWP3 | [-] | 984. | 592. | 392. | 1.03e+03 | 55.6 | -2.95 | 0.62 | 0.82 | 0.72 | ||
| CLM4_CRUNCEP | [-] | 614. | 506. | 108. | 1.03e+03 | 55.6 | -3.97 | 0.60 | 0.74 | 0.67 | ||
| CLM4_GSWP3 | [-] | 500. | 414. | 85.6 | 1.03e+03 | 55.6 | -4.80 | 0.57 | 0.57 | 0.57 | ||
| CLM5_CRUNCEP | [-] | 1.92e+03 | 821. | 1.10e+03 | 1.03e+03 | 55.6 | -0.830 | 0.62 | 0.44 | 0.53 | ||
| CLM5_GSWP3 | [-] | 1.06e+03 | 608. | 446. | 1.03e+03 | 55.6 | -2.80 | 0.62 | 0.75 | 0.69 |
Download Data |
Period Mean (original grids) [Pg] |
Model Period Mean (intersection) [Pg] |
Model Period Mean (complement) [Pg] |
Benchmark Period Mean (intersection) [Pg] |
Benchmark Period Mean (complement) [Pg] |
Bias [kg m-2] |
Bias Score [1] |
Spatial Distribution Score [1] |
Overall Score [1] |
|||
|---|---|---|---|---|---|---|---|---|---|---|---|---|
| Benchmark | [-] | 64.3 | ||||||||||
| CLM4.5_CRUNCEP | [-] | 11.5 | 11.3 | 0.279 | 63.6 | 0.726 | -3.10 | 0.46 | 0.80 | 0.63 | ||
| CLM4.5_GSWP3 | [-] | 9.44 | 9.22 | 0.283 | 63.6 | 0.726 | -3.23 | 0.45 | 0.78 | 0.62 | ||
| CLM4_CRUNCEP | [-] | 5.51 | 5.39 | 0.102 | 63.6 | 0.726 | -3.53 | 0.41 | 0.58 | 0.49 | ||
| CLM4_GSWP3 | [-] | 5.11 | 5.05 | 0.0898 | 63.6 | 0.726 | -3.56 | 0.41 | 0.51 | 0.46 | ||
| CLM5_CRUNCEP | [-] | 18.3 | 18.0 | 0.405 | 63.6 | 0.726 | -2.65 | 0.50 | 0.76 | 0.63 | ||
| CLM5_GSWP3 | [-] | 14.0 | 13.8 | 0.386 | 63.6 | 0.726 | -2.91 | 0.48 | 0.82 | 0.65 |
Download Data |
Period Mean (original grids) [Pg] |
Model Period Mean (intersection) [Pg] |
Model Period Mean (complement) [Pg] |
Benchmark Period Mean (intersection) [Pg] |
Benchmark Period Mean (complement) [Pg] |
Bias [kg m-2] |
Bias Score [1] |
Spatial Distribution Score [1] |
Overall Score [1] |
|||
|---|---|---|---|---|---|---|---|---|---|---|---|---|
| Benchmark | [-] | 13.3 | ||||||||||
| CLM4.5_CRUNCEP | [-] | 126. | 8.66 | 117. | 12.1 | 1.24 | 0.497 | 0.44 | 0.53 | 0.48 | ||
| CLM4.5_GSWP3 | [-] | 69.6 | 4.94 | 64.3 | 12.1 | 1.24 | -4.22 | 0.51 | 0.79 | 0.65 | ||
| CLM4_CRUNCEP | [-] | 23.0 | 1.32 | 21.5 | 12.1 | 1.24 | -8.66 | 0.43 | 0.30 | 0.37 | ||
| CLM4_GSWP3 | [-] | 15.0 | 0.798 | 14.1 | 12.1 | 1.24 | -9.48 | 0.41 | 0.13 | 0.27 | ||
| CLM5_CRUNCEP | [-] | 326. | 17.3 | 310. | 12.1 | 1.24 | 10.0 | 0.42 | 0.14 | 0.28 | ||
| CLM5_GSWP3 | [-] | 123. | 8.60 | 114. | 12.1 | 1.24 | -0.123 | 0.47 | 0.57 | 0.52 |
Download Data |
Period Mean (original grids) [Pg] |
Model Period Mean (intersection) [Pg] |
Model Period Mean (complement) [Pg] |
Benchmark Period Mean (intersection) [Pg] |
Benchmark Period Mean (complement) [Pg] |
Bias [kg m-2] |
Bias Score [1] |
Spatial Distribution Score [1] |
Overall Score [1] |
|||
|---|---|---|---|---|---|---|---|---|---|---|---|---|
| Benchmark | [-] | 42.5 | ||||||||||
| CLM4.5_CRUNCEP | [-] | 21.0 | 19.4 | 1.02 | 40.2 | 2.26 | -3.94 | 0.56 | 0.81 | 0.69 | ||
| CLM4.5_GSWP3 | [-] | 17.0 | 15.6 | 0.919 | 40.2 | 2.26 | -5.66 | 0.57 | 0.70 | 0.64 | ||
| CLM4_CRUNCEP | [-] | 7.50 | 7.00 | 0.290 | 40.2 | 2.26 | -9.53 | 0.47 | 0.28 | 0.38 | ||
| CLM4_GSWP3 | [-] | 7.15 | 6.71 | 0.234 | 40.2 | 2.26 | -9.74 | 0.46 | 0.21 | 0.34 | ||
| CLM5_CRUNCEP | [-] | 21.0 | 19.3 | 1.14 | 40.2 | 2.26 | -3.97 | 0.57 | 0.84 | 0.70 | ||
| CLM5_GSWP3 | [-] | 16.9 | 15.5 | 0.942 | 40.2 | 2.26 | -5.56 | 0.57 | 0.73 | 0.65 |
Download Data |
Period Mean (original grids) [Pg] |
Model Period Mean (intersection) [Pg] |
Model Period Mean (complement) [Pg] |
Benchmark Period Mean (intersection) [Pg] |
Benchmark Period Mean (complement) [Pg] |
Bias [kg m-2] |
Bias Score [1] |
Spatial Distribution Score [1] |
Overall Score [1] |
|||
|---|---|---|---|---|---|---|---|---|---|---|---|---|
| Benchmark | [-] | 45.3 | ||||||||||
| CLM4.5_CRUNCEP | [-] | 53.3 | 52.0 | 0.511 | 44.4 | 0.888 | 2.52 | 0.63 | 0.91 | 0.77 | ||
| CLM4.5_GSWP3 | [-] | 40.5 | 39.4 | 0.456 | 44.4 | 0.888 | -0.620 | 0.68 | 0.87 | 0.77 | ||
| CLM4_CRUNCEP | [-] | 33.2 | 32.4 | 0.299 | 44.4 | 0.888 | -2.50 | 0.69 | 0.58 | 0.64 | ||
| CLM4_GSWP3 | [-] | 27.3 | 26.6 | 0.250 | 44.4 | 0.888 | -3.94 | 0.69 | 0.37 | 0.53 | ||
| CLM5_CRUNCEP | [-] | 42.8 | 41.7 | 0.410 | 44.4 | 0.888 | -0.109 | 0.75 | 0.84 | 0.79 | ||
| CLM5_GSWP3 | [-] | 32.2 | 31.2 | 0.326 | 44.4 | 0.888 | -2.77 | 0.72 | 0.77 | 0.75 |
Download Data |
Period Mean (original grids) [Pg] |
Model Period Mean (intersection) [Pg] |
Model Period Mean (complement) [Pg] |
Benchmark Period Mean (intersection) [Pg] |
Benchmark Period Mean (complement) [Pg] |
Bias [kg m-2] |
Bias Score [1] |
Spatial Distribution Score [1] |
Overall Score [1] |
|||
|---|---|---|---|---|---|---|---|---|---|---|---|---|
| Benchmark | [-] | 51.3 | ||||||||||
| CLM4.5_CRUNCEP | [-] | 75.3 | 42.8 | 33.0 | 49.6 | 1.76 | -1.38 | 0.67 | 0.88 | 0.78 | ||
| CLM4.5_GSWP3 | [-] | 58.2 | 33.6 | 25.0 | 49.6 | 1.76 | -4.17 | 0.68 | 0.75 | 0.72 | ||
| CLM4_CRUNCEP | [-] | 41.7 | 25.6 | 16.3 | 49.6 | 1.76 | -6.92 | 0.63 | 0.63 | 0.63 | ||
| CLM4_GSWP3 | [-] | 29.3 | 17.3 | 12.1 | 49.6 | 1.76 | -9.52 | 0.54 | 0.46 | 0.50 | ||
| CLM5_CRUNCEP | [-] | 145. | 61.9 | 81.7 | 49.6 | 1.76 | 4.53 | 0.62 | 0.72 | 0.67 | ||
| CLM5_GSWP3 | [-] | 75.2 | 39.4 | 36.1 | 49.6 | 1.76 | -2.45 | 0.63 | 0.88 | 0.76 |
Download Data |
Period Mean (original grids) [Pg] |
Model Period Mean (intersection) [Pg] |
Model Period Mean (complement) [Pg] |
Benchmark Period Mean (intersection) [Pg] |
Benchmark Period Mean (complement) [Pg] |
Bias [kg m-2] |
Bias Score [1] |
Spatial Distribution Score [1] |
Overall Score [1] |
|||
|---|---|---|---|---|---|---|---|---|---|---|---|---|
| Benchmark | [-] | 34.3 | ||||||||||
| CLM4.5_CRUNCEP | [-] | 14.5 | 14.9 | 0.385 | 34.0 | 0.216 | -4.64 | 0.59 | 0.90 | 0.75 | ||
| CLM4.5_GSWP3 | [-] | 13.2 | 13.5 | 0.330 | 34.0 | 0.216 | -4.98 | 0.57 | 0.87 | 0.72 | ||
| CLM4_CRUNCEP | [-] | 11.8 | 11.9 | 0.338 | 34.0 | 0.216 | -5.52 | 0.54 | 0.79 | 0.66 | ||
| CLM4_GSWP3 | [-] | 10.4 | 10.5 | 0.263 | 34.0 | 0.216 | -5.89 | 0.51 | 0.64 | 0.57 | ||
| CLM5_CRUNCEP | [-] | 12.9 | 13.1 | 0.522 | 34.0 | 0.216 | -5.04 | 0.55 | 0.83 | 0.69 | ||
| CLM5_GSWP3 | [-] | 11.5 | 11.8 | 0.377 | 34.0 | 0.216 | -5.39 | 0.54 | 0.87 | 0.71 |
Download Data |
Period Mean (original grids) [Pg] |
Model Period Mean (intersection) [Pg] |
Model Period Mean (complement) [Pg] |
Benchmark Period Mean (intersection) [Pg] |
Benchmark Period Mean (complement) [Pg] |
Bias [kg m-2] |
Bias Score [1] |
Spatial Distribution Score [1] |
Overall Score [1] |
|||
|---|---|---|---|---|---|---|---|---|---|---|---|---|
| Benchmark | [-] | 101. | ||||||||||
| CLM4.5_CRUNCEP | [-] | 90.8 | 90.1 | 0.454 | 100. | 0.811 | -0.578 | 0.71 | 0.68 | 0.70 | ||
| CLM4.5_GSWP3 | [-] | 69.1 | 68.6 | 0.387 | 100. | 0.811 | -3.21 | 0.70 | 0.58 | 0.64 | ||
| CLM4_CRUNCEP | [-] | 77.2 | 76.5 | 0.209 | 100. | 0.811 | -2.53 | 0.73 | 0.38 | 0.55 | ||
| CLM4_GSWP3 | [-] | 59.6 | 59.1 | 0.178 | 100. | 0.811 | -4.62 | 0.66 | 0.34 | 0.50 | ||
| CLM5_CRUNCEP | [-] | 86.4 | 85.4 | 0.425 | 100. | 0.811 | -1.19 | 0.73 | 0.59 | 0.66 | ||
| CLM5_GSWP3 | [-] | 68.5 | 67.8 | 0.372 | 100. | 0.811 | -3.35 | 0.69 | 0.46 | 0.58 |
Download Data |
Period Mean (original grids) [Pg] |
Model Period Mean (intersection) [Pg] |
Model Period Mean (complement) [Pg] |
Benchmark Period Mean (intersection) [Pg] |
Benchmark Period Mean (complement) [Pg] |
Bias [kg m-2] |
Bias Score [1] |
Spatial Distribution Score [1] |
Overall Score [1] |
|||
|---|---|---|---|---|---|---|---|---|---|---|---|---|
| Benchmark | [-] | 60.7 | ||||||||||
| CLM4.5_CRUNCEP | [-] | 48.2 | 48.0 | 0.511 | 60.4 | 0.300 | -1.23 | 0.65 | 0.89 | 0.77 | ||
| CLM4.5_GSWP3 | [-] | 36.9 | 36.7 | 0.416 | 60.4 | 0.300 | -3.04 | 0.64 | 0.78 | 0.71 | ||
| CLM4_CRUNCEP | [-] | 37.5 | 37.7 | 0.238 | 60.4 | 0.300 | -3.03 | 0.67 | 0.72 | 0.70 | ||
| CLM4_GSWP3 | [-] | 31.0 | 31.1 | 0.187 | 60.4 | 0.300 | -4.07 | 0.63 | 0.54 | 0.59 | ||
| CLM5_CRUNCEP | [-] | 62.6 | 63.0 | 0.653 | 60.4 | 0.300 | 1.03 | 0.65 | 0.91 | 0.78 | ||
| CLM5_GSWP3 | [-] | 47.2 | 47.5 | 0.479 | 60.4 | 0.300 | -1.44 | 0.67 | 0.84 | 0.75 |
Download Data |
Period Mean (original grids) [Pg] |
Model Period Mean (intersection) [Pg] |
Model Period Mean (complement) [Pg] |
Benchmark Period Mean (intersection) [Pg] |
Benchmark Period Mean (complement) [Pg] |
Bias [kg m-2] |
Bias Score [1] |
Spatial Distribution Score [1] |
Overall Score [1] |
|||
|---|---|---|---|---|---|---|---|---|---|---|---|---|
| Benchmark | [-] | 29.6 | ||||||||||
| CLM4.5_CRUNCEP | [-] | 10.7 | 10.4 | 0.165 | 28.2 | 1.46 | -4.64 | 0.54 | 0.56 | 0.55 | ||
| CLM4.5_GSWP3 | [-] | 11.6 | 11.2 | 0.196 | 28.2 | 1.46 | -4.41 | 0.54 | 0.54 | 0.54 | ||
| CLM4_CRUNCEP | [-] | 6.54 | 6.40 | 0.120 | 28.2 | 1.46 | -6.16 | 0.49 | 0.29 | 0.39 | ||
| CLM4_GSWP3 | [-] | 7.81 | 7.58 | 0.114 | 28.2 | 1.46 | -5.87 | 0.50 | 0.25 | 0.38 | ||
| CLM5_CRUNCEP | [-] | 17.7 | 16.8 | 0.278 | 28.2 | 1.46 | -2.29 | 0.56 | 0.73 | 0.64 | ||
| CLM5_GSWP3 | [-] | 15.7 | 14.8 | 0.272 | 28.2 | 1.46 | -3.23 | 0.57 | 0.49 | 0.53 |
Temporally integrated period mean