Mean State
Download Data |
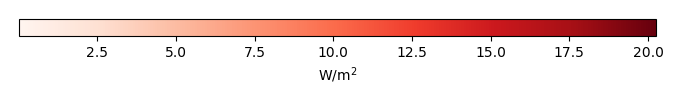
Period Mean (original grids) [W/m2] |
Model Period Mean (intersection) [W/m2] |
Model Period Mean (complement) [W/m2] |
Benchmark Period Mean (intersection) [W/m2] |
Benchmark Period Mean (complement) [W/m2] |
Bias [W/m2] |
RMSE [W/m2] |
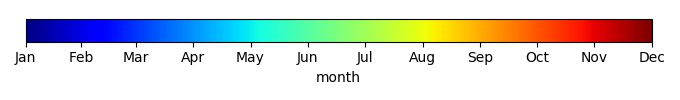
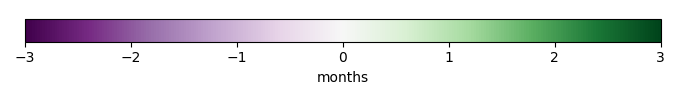
Phase Shift [months] |
Bias Score [1] |
RMSE Score [1] |
Seasonal Cycle Score [1] |
Spatial Distribution Score [1] |
Interannual Variability Score [1] |
Overall Score [1] |
|||
|---|---|---|---|---|---|---|---|---|---|---|---|---|---|---|---|---|---|
| Benchmark | [-] | 457. | |||||||||||||||
| CLM4.5_CRUNCEP | [-] | 462. | 462. | 456. | 465. | 6.98 | 18.2 | 1.33 | 0.38 | 0.37 | 0.81 | 0.83 | 0.63 | 0.56 | |||
| CLM4.5_GSWP3 | [-] | 462. | 462. | 456. | 465. | 6.40 | 16.3 | 1.35 | 0.43 | 0.38 | 0.81 | 0.96 | 0.64 | 0.60 | |||
| CLM4.5SP_GSWP3 | [-] | 459. | 459. | 456. | 465. | 3.90 | 14.3 | 1.45 | 0.50 | 0.40 | 0.79 | 0.99 | 0.61 | 0.61 | |||
| CLM4_CRUNCEP | [-] | 458. | 458. | 456. | 465. | 3.03 | 16.8 | 1.30 | 0.42 | 0.37 | 0.81 | 0.81 | 0.63 | 0.57 | |||
| CLM4_GSWP3 | [-] | 458. | 458. | 456. | 465. | 2.39 | 14.9 | 1.26 | 0.47 | 0.38 | 0.82 | 0.94 | 0.63 | 0.60 | |||
| CLM4SP_GSWP3 | [-] | 457. | 457. | 456. | 465. | 1.98 | 13.8 | 1.32 | 0.52 | 0.39 | 0.81 | 1.0 | 0.61 | 0.62 | |||
| CLM5_CRUNCEP | [-] | 464. | 464. | 456. | 465. | 8.32 | 17.6 | 1.41 | 0.42 | 0.38 | 0.80 | 0.88 | 0.62 | 0.58 | |||
| CLM5_GSWP3 | [-] | 463. | 463. | 456. | 465. | 7.83 | 16.4 | 1.44 | 0.46 | 0.38 | 0.80 | 0.98 | 0.61 | 0.60 | |||
| CLM5SP_CRUNCEP | [-] | 461. | 461. | 456. | 465. | 6.21 | 15.8 | 1.44 | 0.46 | 0.38 | 0.79 | 0.92 | 0.61 | 0.59 | |||
| CLM5SP_GSWP3 | [-] | 461. | 461. | 456. | 465. | 5.39 | 14.8 | 1.43 | 0.50 | 0.39 | 0.80 | 1.0 | 0.60 | 0.61 |
Download Data |
Period Mean (original grids) [W/m2] |
Model Period Mean (intersection) [W/m2] |
Model Period Mean (complement) [W/m2] |
Benchmark Period Mean (intersection) [W/m2] |
Benchmark Period Mean (complement) [W/m2] |
Bias [W/m2] |
RMSE [W/m2] |
Phase Shift [months] |
Bias Score [1] |
RMSE Score [1] |
Seasonal Cycle Score [1] |
Spatial Distribution Score [1] |
Interannual Variability Score [1] |
Overall Score [1] |
|||
|---|---|---|---|---|---|---|---|---|---|---|---|---|---|---|---|---|---|
| Benchmark | [-] | 466. | |||||||||||||||
| CLM4.5_CRUNCEP | [-] | 485. | 485. | 467. | 458. | 18.7 | 25.1 | 0.646 | 0.43 | 0.49 | 0.94 | 1.0 | 0.66 | 0.67 | |||
| CLM4.5_GSWP3 | [-] | 482. | 482. | 467. | 458. | 15.3 | 22.2 | 0.529 | 0.49 | 0.51 | 0.95 | 0.94 | 0.65 | 0.68 | |||
| CLM4.5SP_GSWP3 | [-] | 476. | 477. | 467. | 458. | 10.1 | 18.3 | 0.511 | 0.60 | 0.53 | 0.95 | 0.97 | 0.61 | 0.70 | |||
| CLM4_CRUNCEP | [-] | 480. | 480. | 467. | 458. | 13.8 | 22.7 | 0.636 | 0.51 | 0.48 | 0.95 | 0.98 | 0.67 | 0.68 | |||
| CLM4_GSWP3 | [-] | 476. | 477. | 467. | 458. | 10.1 | 19.4 | 0.592 | 0.59 | 0.50 | 0.95 | 1.0 | 0.67 | 0.70 | |||
| CLM4SP_GSWP3 | [-] | 476. | 476. | 467. | 458. | 9.34 | 18.2 | 0.553 | 0.62 | 0.52 | 0.95 | 0.98 | 0.62 | 0.70 | |||
| CLM5_CRUNCEP | [-] | 487. | 487. | 467. | 458. | 20.4 | 26.5 | 0.743 | 0.41 | 0.48 | 0.93 | 1.0 | 0.64 | 0.66 | |||
| CLM5_GSWP3 | [-] | 484. | 484. | 467. | 458. | 17.2 | 23.5 | 0.637 | 0.46 | 0.50 | 0.94 | 0.95 | 0.62 | 0.66 | |||
| CLM5SP_CRUNCEP | [-] | 481. | 481. | 467. | 458. | 14.5 | 21.8 | 0.609 | 0.52 | 0.50 | 0.95 | 1.0 | 0.62 | 0.68 | |||
| CLM5SP_GSWP3 | [-] | 478. | 478. | 467. | 458. | 11.5 | 19.5 | 0.566 | 0.57 | 0.51 | 0.95 | 0.97 | 0.61 | 0.69 |
Download Data |
Period Mean (original grids) [W/m2] |
Model Period Mean (intersection) [W/m2] |
Model Period Mean (complement) [W/m2] |
Benchmark Period Mean (intersection) [W/m2] |
Benchmark Period Mean (complement) [W/m2] |
Bias [W/m2] |
RMSE [W/m2] |
Phase Shift [months] |
Bias Score [1] |
RMSE Score [1] |
Seasonal Cycle Score [1] |
Spatial Distribution Score [1] |
Interannual Variability Score [1] |
Overall Score [1] |
|||
|---|---|---|---|---|---|---|---|---|---|---|---|---|---|---|---|---|---|
| Benchmark | [-] | 443. | |||||||||||||||
| CLM4.5_CRUNCEP | [-] | 452. | 452. | 443. | 446. | 9.23 | 19.1 | 1.06 | 0.54 | 0.49 | 0.87 | 0.98 | 0.67 | 0.67 | |||
| CLM4.5_GSWP3 | [-] | 453. | 453. | 443. | 446. | 9.71 | 18.3 | 1.09 | 0.56 | 0.49 | 0.86 | 1.0 | 0.66 | 0.67 | |||
| CLM4.5SP_GSWP3 | [-] | 446. | 446. | 443. | 446. | 3.36 | 15.0 | 1.01 | 0.69 | 0.51 | 0.86 | 0.99 | 0.61 | 0.70 | |||
| CLM4_CRUNCEP | [-] | 446. | 446. | 443. | 446. | 4.22 | 18.5 | 1.00 | 0.56 | 0.49 | 0.87 | 0.97 | 0.66 | 0.67 | |||
| CLM4_GSWP3 | [-] | 446. | 446. | 443. | 446. | 4.18 | 16.7 | 1.08 | 0.64 | 0.48 | 0.86 | 1.0 | 0.66 | 0.69 | |||
| CLM4SP_GSWP3 | [-] | 444. | 444. | 443. | 446. | 1.31 | 15.2 | 1.07 | 0.70 | 0.50 | 0.86 | 0.99 | 0.61 | 0.69 | |||
| CLM5_CRUNCEP | [-] | 450. | 450. | 443. | 446. | 7.78 | 19.3 | 1.24 | 0.56 | 0.47 | 0.85 | 0.99 | 0.63 | 0.66 | |||
| CLM5_GSWP3 | [-] | 452. | 452. | 443. | 446. | 9.13 | 18.8 | 1.38 | 0.57 | 0.46 | 0.81 | 1.0 | 0.60 | 0.65 | |||
| CLM5SP_CRUNCEP | [-] | 447. | 447. | 443. | 446. | 4.80 | 16.5 | 1.06 | 0.62 | 0.51 | 0.87 | 1.0 | 0.61 | 0.69 | |||
| CLM5SP_GSWP3 | [-] | 447. | 447. | 443. | 446. | 4.28 | 15.8 | 1.12 | 0.67 | 0.49 | 0.85 | 0.99 | 0.60 | 0.68 |
Download Data |
Period Mean (original grids) [W/m2] |
Model Period Mean (intersection) [W/m2] |
Model Period Mean (complement) [W/m2] |
Benchmark Period Mean (intersection) [W/m2] |
Benchmark Period Mean (complement) [W/m2] |
Bias [W/m2] |
RMSE [W/m2] |
Phase Shift [months] |
Bias Score [1] |
RMSE Score [1] |
Seasonal Cycle Score [1] |
Spatial Distribution Score [1] |
Interannual Variability Score [1] |
Overall Score [1] |
|||
|---|---|---|---|---|---|---|---|---|---|---|---|---|---|---|---|---|---|
| Benchmark | [-] | 279. | |||||||||||||||
| CLM4.5_CRUNCEP | [-] | 262. | 262. | 278. | 296. | -14.5 | 21.5 | 0.132 | 0.80 | 0.79 | 0.99 | 0.99 | 0.72 | 0.84 | |||
| CLM4.5_GSWP3 | [-] | 275. | 276. | 278. | 296. | 0.179 | 15.2 | 0.123 | 0.91 | 0.81 | 0.99 | 1.0 | 0.76 | 0.88 | |||
| CLM4.5SP_GSWP3 | [-] | 276. | 276. | 278. | 296. | 0.332 | 15.0 | 0.126 | 0.91 | 0.81 | 0.99 | 1.0 | 0.76 | 0.88 | |||
| CLM4_CRUNCEP | [-] | 260. | 260. | 278. | 296. | -15.8 | 23.6 | 0.135 | 0.78 | 0.77 | 0.99 | 0.99 | 0.74 | 0.84 | |||
| CLM4_GSWP3 | [-] | 276. | 276. | 278. | 296. | 0.256 | 15.9 | 0.121 | 0.91 | 0.80 | 0.99 | 0.99 | 0.78 | 0.88 | |||
| CLM4SP_GSWP3 | [-] | 275. | 275. | 278. | 296. | -0.533 | 14.9 | 0.126 | 0.91 | 0.81 | 0.99 | 0.99 | 0.77 | 0.88 | |||
| CLM5_CRUNCEP | [-] | 268. | 268. | 278. | 296. | -8.32 | 17.5 | 0.132 | 0.86 | 0.80 | 0.99 | 1.0 | 0.71 | 0.86 | |||
| CLM5_GSWP3 | [-] | 277. | 278. | 278. | 296. | 2.37 | 15.4 | 0.127 | 0.90 | 0.81 | 0.99 | 1.0 | 0.74 | 0.88 | |||
| CLM5SP_CRUNCEP | [-] | 267. | 267. | 278. | 296. | -9.37 | 18.1 | 0.135 | 0.85 | 0.80 | 0.99 | 1.0 | 0.71 | 0.86 | |||
| CLM5SP_GSWP3 | [-] | 277. | 277. | 278. | 296. | 2.04 | 15.4 | 0.131 | 0.91 | 0.81 | 0.99 | 1.0 | 0.74 | 0.88 |
Download Data |
Period Mean (original grids) [W/m2] |
Model Period Mean (intersection) [W/m2] |
Model Period Mean (complement) [W/m2] |
Benchmark Period Mean (intersection) [W/m2] |
Benchmark Period Mean (complement) [W/m2] |
Bias [W/m2] |
RMSE [W/m2] |
Phase Shift [months] |
Bias Score [1] |
RMSE Score [1] |
Seasonal Cycle Score [1] |
Spatial Distribution Score [1] |
Interannual Variability Score [1] |
Overall Score [1] |
|||
|---|---|---|---|---|---|---|---|---|---|---|---|---|---|---|---|---|---|
| Benchmark | [-] | 457. | |||||||||||||||
| CLM4.5_CRUNCEP | [-] | 452. | 452. | 454. | 467. | -0.886 | 13.6 | 1.88 | 0.35 | 0.38 | 0.71 | 0.89 | 0.55 | 0.54 | |||
| CLM4.5_GSWP3 | [-] | 454. | 454. | 454. | 467. | 0.984 | 14.0 | 1.68 | 0.33 | 0.38 | 0.74 | 0.60 | 0.59 | 0.50 | |||
| CLM4.5SP_GSWP3 | [-] | 455. | 455. | 454. | 467. | 2.33 | 13.8 | 1.56 | 0.31 | 0.38 | 0.76 | 0.56 | 0.58 | 0.50 | |||
| CLM4_CRUNCEP | [-] | 450. | 450. | 454. | 467. | -1.91 | 13.4 | 1.90 | 0.37 | 0.37 | 0.70 | 0.90 | 0.55 | 0.54 | |||
| CLM4_GSWP3 | [-] | 452. | 452. | 454. | 467. | -0.662 | 13.6 | 1.63 | 0.37 | 0.37 | 0.76 | 0.59 | 0.60 | 0.51 | |||
| CLM4SP_GSWP3 | [-] | 454. | 454. | 454. | 467. | 1.55 | 13.7 | 1.66 | 0.33 | 0.38 | 0.74 | 0.58 | 0.58 | 0.50 | |||
| CLM5_CRUNCEP | [-] | 457. | 457. | 454. | 467. | 3.95 | 14.6 | 1.88 | 0.30 | 0.37 | 0.71 | 0.92 | 0.54 | 0.54 | |||
| CLM5_GSWP3 | [-] | 459. | 459. | 454. | 467. | 5.54 | 14.6 | 1.55 | 0.29 | 0.38 | 0.77 | 0.65 | 0.58 | 0.51 | |||
| CLM5SP_CRUNCEP | [-] | 455. | 455. | 454. | 467. | 2.62 | 13.7 | 1.87 | 0.31 | 0.39 | 0.71 | 0.85 | 0.52 | 0.53 | |||
| CLM5SP_GSWP3 | [-] | 457. | 457. | 454. | 467. | 3.88 | 14.0 | 1.70 | 0.30 | 0.39 | 0.73 | 0.58 | 0.56 | 0.49 |
Download Data |
Period Mean (original grids) [W/m2] |
Model Period Mean (intersection) [W/m2] |
Model Period Mean (complement) [W/m2] |
Benchmark Period Mean (intersection) [W/m2] |
Benchmark Period Mean (complement) [W/m2] |
Bias [W/m2] |
RMSE [W/m2] |
Phase Shift [months] |
Bias Score [1] |
RMSE Score [1] |
Seasonal Cycle Score [1] |
Spatial Distribution Score [1] |
Interannual Variability Score [1] |
Overall Score [1] |
|||
|---|---|---|---|---|---|---|---|---|---|---|---|---|---|---|---|---|---|
| Benchmark | [-] | 312. | |||||||||||||||
| CLM4.5_CRUNCEP | [-] | 304. | 304. | 311. | 334. | -7.01 | 12.3 | 0.0406 | 0.90 | 0.87 | 1.0 | 1.0 | 0.86 | 0.91 | |||
| CLM4.5_GSWP3 | [-] | 314. | 314. | 311. | 334. | 2.37 | 10.6 | 0.0385 | 0.94 | 0.88 | 1.0 | 1.0 | 0.87 | 0.93 | |||
| CLM4.5SP_GSWP3 | [-] | 314. | 314. | 311. | 334. | 2.44 | 10.1 | 0.0396 | 0.94 | 0.88 | 1.0 | 1.0 | 0.86 | 0.93 | |||
| CLM4_CRUNCEP | [-] | 304. | 304. | 311. | 334. | -7.50 | 12.3 | 0.0422 | 0.89 | 0.87 | 1.0 | 0.99 | 0.86 | 0.91 | |||
| CLM4_GSWP3 | [-] | 313. | 313. | 311. | 334. | 2.07 | 10.5 | 0.0356 | 0.94 | 0.88 | 1.0 | 1.0 | 0.88 | 0.93 | |||
| CLM4SP_GSWP3 | [-] | 313. | 313. | 311. | 334. | 1.91 | 9.98 | 0.0356 | 0.94 | 0.88 | 1.0 | 1.0 | 0.87 | 0.93 | |||
| CLM5_CRUNCEP | [-] | 311. | 310. | 311. | 334. | -0.679 | 9.44 | 0.0515 | 0.94 | 0.89 | 1.0 | 0.99 | 0.86 | 0.93 | |||
| CLM5_GSWP3 | [-] | 317. | 317. | 311. | 334. | 5.51 | 11.6 | 0.0521 | 0.91 | 0.88 | 1.0 | 1.0 | 0.86 | 0.92 | |||
| CLM5SP_CRUNCEP | [-] | 311. | 310. | 311. | 334. | -0.584 | 9.49 | 0.0437 | 0.94 | 0.89 | 1.0 | 0.99 | 0.85 | 0.93 | |||
| CLM5SP_GSWP3 | [-] | 316. | 316. | 311. | 334. | 5.08 | 11.3 | 0.0416 | 0.91 | 0.89 | 1.0 | 1.0 | 0.86 | 0.92 |
Download Data |
Period Mean (original grids) [W/m2] |
Model Period Mean (intersection) [W/m2] |
Model Period Mean (complement) [W/m2] |
Benchmark Period Mean (intersection) [W/m2] |
Benchmark Period Mean (complement) [W/m2] |
Bias [W/m2] |
RMSE [W/m2] |
Phase Shift [months] |
Bias Score [1] |
RMSE Score [1] |
Seasonal Cycle Score [1] |
Spatial Distribution Score [1] |
Interannual Variability Score [1] |
Overall Score [1] |
|||
|---|---|---|---|---|---|---|---|---|---|---|---|---|---|---|---|---|---|
| Benchmark | [-] | 364. | |||||||||||||||
| CLM4.5_CRUNCEP | [-] | 358. | 357. | 363. | 399. | -3.48 | 14.3 | 0.116 | 0.85 | 0.82 | 0.99 | 1.0 | 0.82 | 0.88 | |||
| CLM4.5_GSWP3 | [-] | 362. | 362. | 363. | 399. | 0.962 | 13.2 | 0.105 | 0.87 | 0.83 | 0.99 | 0.99 | 0.78 | 0.88 | |||
| CLM4.5SP_GSWP3 | [-] | 364. | 363. | 363. | 399. | 2.27 | 13.4 | 0.105 | 0.86 | 0.83 | 0.99 | 1.0 | 0.77 | 0.88 | |||
| CLM4_CRUNCEP | [-] | 357. | 357. | 363. | 399. | -4.21 | 14.3 | 0.128 | 0.85 | 0.82 | 0.99 | 1.0 | 0.82 | 0.88 | |||
| CLM4_GSWP3 | [-] | 362. | 361. | 363. | 399. | 0.496 | 13.2 | 0.107 | 0.87 | 0.83 | 0.99 | 0.99 | 0.78 | 0.88 | |||
| CLM4SP_GSWP3 | [-] | 363. | 363. | 363. | 399. | 1.83 | 13.2 | 0.103 | 0.87 | 0.83 | 0.99 | 1.0 | 0.78 | 0.88 | |||
| CLM5_CRUNCEP | [-] | 363. | 362. | 363. | 399. | 0.922 | 14.0 | 0.225 | 0.86 | 0.82 | 0.98 | 1.0 | 0.80 | 0.88 | |||
| CLM5_GSWP3 | [-] | 366. | 365. | 363. | 399. | 4.07 | 14.2 | 0.164 | 0.86 | 0.82 | 0.99 | 1.0 | 0.76 | 0.87 | |||
| CLM5SP_CRUNCEP | [-] | 363. | 362. | 363. | 399. | 1.27 | 13.6 | 0.117 | 0.86 | 0.83 | 0.99 | 1.0 | 0.79 | 0.88 | |||
| CLM5SP_GSWP3 | [-] | 366. | 366. | 363. | 399. | 4.67 | 14.4 | 0.103 | 0.85 | 0.83 | 0.99 | 0.99 | 0.75 | 0.87 |
Download Data |
Period Mean (original grids) [W/m2] |
Model Period Mean (intersection) [W/m2] |
Model Period Mean (complement) [W/m2] |
Benchmark Period Mean (intersection) [W/m2] |
Benchmark Period Mean (complement) [W/m2] |
Bias [W/m2] |
RMSE [W/m2] |
Phase Shift [months] |
Bias Score [1] |
RMSE Score [1] |
Seasonal Cycle Score [1] |
Spatial Distribution Score [1] |
Interannual Variability Score [1] |
Overall Score [1] |
|||
|---|---|---|---|---|---|---|---|---|---|---|---|---|---|---|---|---|---|
| Benchmark | [-] | 448. | |||||||||||||||
| CLM4.5_CRUNCEP | [-] | 457. | 457. | 446. | 467. | 12.5 | 20.9 | 0.590 | 0.52 | 0.57 | 0.94 | 1.0 | 0.71 | 0.72 | |||
| CLM4.5_GSWP3 | [-] | 452. | 452. | 446. | 467. | 7.61 | 18.1 | 0.659 | 0.61 | 0.57 | 0.93 | 0.99 | 0.67 | 0.72 | |||
| CLM4.5SP_GSWP3 | [-] | 449. | 450. | 446. | 467. | 5.58 | 16.3 | 0.660 | 0.66 | 0.58 | 0.93 | 0.98 | 0.63 | 0.73 | |||
| CLM4_CRUNCEP | [-] | 453. | 453. | 446. | 467. | 8.82 | 19.0 | 0.579 | 0.57 | 0.57 | 0.95 | 1.0 | 0.71 | 0.73 | |||
| CLM4_GSWP3 | [-] | 447. | 448. | 446. | 467. | 3.72 | 16.5 | 0.643 | 0.66 | 0.56 | 0.94 | 0.99 | 0.68 | 0.73 | |||
| CLM4SP_GSWP3 | [-] | 450. | 450. | 446. | 467. | 5.80 | 16.6 | 0.658 | 0.65 | 0.57 | 0.93 | 0.98 | 0.64 | 0.72 | |||
| CLM5_CRUNCEP | [-] | 459. | 459. | 446. | 467. | 14.4 | 21.7 | 0.742 | 0.51 | 0.56 | 0.92 | 1.0 | 0.67 | 0.71 | |||
| CLM5_GSWP3 | [-] | 453. | 454. | 446. | 467. | 9.50 | 18.9 | 0.825 | 0.60 | 0.56 | 0.91 | 0.98 | 0.63 | 0.71 | |||
| CLM5SP_CRUNCEP | [-] | 455. | 456. | 446. | 467. | 11.2 | 18.9 | 0.610 | 0.56 | 0.59 | 0.94 | 1.0 | 0.65 | 0.72 | |||
| CLM5SP_GSWP3 | [-] | 451. | 451. | 446. | 467. | 7.04 | 17.1 | 0.677 | 0.64 | 0.57 | 0.93 | 0.96 | 0.62 | 0.72 |
Download Data |
Period Mean (original grids) [W/m2] |
Model Period Mean (intersection) [W/m2] |
Model Period Mean (complement) [W/m2] |
Benchmark Period Mean (intersection) [W/m2] |
Benchmark Period Mean (complement) [W/m2] |
Bias [W/m2] |
RMSE [W/m2] |
Phase Shift [months] |
Bias Score [1] |
RMSE Score [1] |
Seasonal Cycle Score [1] |
Spatial Distribution Score [1] |
Interannual Variability Score [1] |
Overall Score [1] |
|||
|---|---|---|---|---|---|---|---|---|---|---|---|---|---|---|---|---|---|
| Benchmark | [-] | 281. | |||||||||||||||
| CLM4.5_CRUNCEP | [-] | 268. | 268. | 281. | 288. | -12.4 | 19.4 | 0.136 | 0.82 | 0.78 | 0.99 | 0.98 | 0.77 | 0.85 | |||
| CLM4.5_GSWP3 | [-] | 281. | 282. | 281. | 288. | 1.72 | 12.7 | 0.0824 | 0.94 | 0.82 | 0.99 | 1.0 | 0.77 | 0.89 | |||
| CLM4.5SP_GSWP3 | [-] | 282. | 282. | 281. | 288. | 1.95 | 12.8 | 0.0824 | 0.93 | 0.82 | 0.99 | 1.0 | 0.77 | 0.89 | |||
| CLM4_CRUNCEP | [-] | 268. | 268. | 281. | 288. | -12.4 | 21.7 | 0.0955 | 0.82 | 0.74 | 0.99 | 0.98 | 0.80 | 0.85 | |||
| CLM4_GSWP3 | [-] | 282. | 282. | 281. | 288. | 2.23 | 14.4 | 0.0850 | 0.93 | 0.80 | 0.99 | 1.0 | 0.79 | 0.89 | |||
| CLM4SP_GSWP3 | [-] | 281. | 281. | 281. | 288. | 1.39 | 12.7 | 0.0844 | 0.94 | 0.82 | 0.99 | 1.0 | 0.78 | 0.89 | |||
| CLM5_CRUNCEP | [-] | 275. | 276. | 281. | 288. | -4.81 | 13.7 | 0.101 | 0.91 | 0.81 | 0.99 | 0.99 | 0.78 | 0.88 | |||
| CLM5_GSWP3 | [-] | 284. | 284. | 281. | 288. | 4.17 | 13.2 | 0.0840 | 0.91 | 0.83 | 0.99 | 1.0 | 0.77 | 0.89 | |||
| CLM5SP_CRUNCEP | [-] | 273. | 274. | 281. | 288. | -6.57 | 15.1 | 0.0942 | 0.89 | 0.80 | 0.99 | 0.98 | 0.77 | 0.87 | |||
| CLM5SP_GSWP3 | [-] | 283. | 283. | 281. | 288. | 3.53 | 13.2 | 0.0829 | 0.92 | 0.82 | 0.99 | 1.0 | 0.76 | 0.89 |
Download Data |
Period Mean (original grids) [W/m2] |
Model Period Mean (intersection) [W/m2] |
Model Period Mean (complement) [W/m2] |
Benchmark Period Mean (intersection) [W/m2] |
Benchmark Period Mean (complement) [W/m2] |
Bias [W/m2] |
RMSE [W/m2] |
Phase Shift [months] |
Bias Score [1] |
RMSE Score [1] |
Seasonal Cycle Score [1] |
Spatial Distribution Score [1] |
Interannual Variability Score [1] |
Overall Score [1] |
|||
|---|---|---|---|---|---|---|---|---|---|---|---|---|---|---|---|---|---|
| Benchmark | [-] | 441. | |||||||||||||||
| CLM4.5_CRUNCEP | [-] | 447. | 447. | 443. | 426. | 1.85 | 13.5 | 0.356 | 0.78 | 0.70 | 0.97 | 0.97 | 0.83 | 0.82 | |||
| CLM4.5_GSWP3 | [-] | 447. | 447. | 443. | 426. | 1.93 | 12.8 | 0.354 | 0.80 | 0.70 | 0.97 | 0.99 | 0.78 | 0.82 | |||
| CLM4.5SP_GSWP3 | [-] | 445. | 445. | 443. | 426. | -0.532 | 11.7 | 0.348 | 0.83 | 0.71 | 0.97 | 1.0 | 0.74 | 0.83 | |||
| CLM4_CRUNCEP | [-] | 447. | 447. | 443. | 426. | 1.56 | 13.2 | 0.363 | 0.79 | 0.70 | 0.97 | 0.97 | 0.83 | 0.83 | |||
| CLM4_GSWP3 | [-] | 447. | 447. | 443. | 426. | 1.41 | 12.4 | 0.347 | 0.81 | 0.70 | 0.97 | 0.99 | 0.78 | 0.83 | |||
| CLM4SP_GSWP3 | [-] | 444. | 444. | 443. | 426. | -1.33 | 11.6 | 0.356 | 0.84 | 0.71 | 0.97 | 1.0 | 0.75 | 0.83 | |||
| CLM5_CRUNCEP | [-] | 449. | 449. | 443. | 426. | 3.69 | 13.5 | 0.384 | 0.78 | 0.70 | 0.97 | 0.98 | 0.80 | 0.82 | |||
| CLM5_GSWP3 | [-] | 449. | 449. | 443. | 426. | 3.62 | 13.2 | 0.381 | 0.80 | 0.69 | 0.97 | 0.99 | 0.74 | 0.81 | |||
| CLM5SP_CRUNCEP | [-] | 446. | 446. | 443. | 426. | 0.518 | 12.3 | 0.380 | 0.82 | 0.70 | 0.97 | 0.99 | 0.77 | 0.83 | |||
| CLM5SP_GSWP3 | [-] | 446. | 446. | 443. | 426. | 0.648 | 12.3 | 0.382 | 0.84 | 0.70 | 0.97 | 1.0 | 0.72 | 0.82 |
Download Data |
Period Mean (original grids) [W/m2] |
Model Period Mean (intersection) [W/m2] |
Model Period Mean (complement) [W/m2] |
Benchmark Period Mean (intersection) [W/m2] |
Benchmark Period Mean (complement) [W/m2] |
Bias [W/m2] |
RMSE [W/m2] |
Phase Shift [months] |
Bias Score [1] |
RMSE Score [1] |
Seasonal Cycle Score [1] |
Spatial Distribution Score [1] |
Interannual Variability Score [1] |
Overall Score [1] |
|||
|---|---|---|---|---|---|---|---|---|---|---|---|---|---|---|---|---|---|
| Benchmark | [-] | 368. | |||||||||||||||
| CLM4.5_CRUNCEP | [-] | 358. | 358. | 366. | 389. | -5.26 | 13.3 | 0.253 | 0.81 | 0.76 | 0.98 | 0.99 | 0.82 | 0.85 | |||
| CLM4.5_GSWP3 | [-] | 361. | 361. | 366. | 389. | -1.80 | 11.7 | 0.207 | 0.84 | 0.77 | 0.99 | 1.0 | 0.81 | 0.86 | |||
| CLM4.5SP_GSWP3 | [-] | 362. | 362. | 366. | 389. | -0.632 | 11.4 | 0.207 | 0.86 | 0.78 | 0.99 | 1.0 | 0.80 | 0.86 | |||
| CLM4_CRUNCEP | [-] | 358. | 358. | 366. | 389. | -4.71 | 13.8 | 0.275 | 0.81 | 0.75 | 0.98 | 0.99 | 0.82 | 0.85 | |||
| CLM4_GSWP3 | [-] | 362. | 362. | 366. | 389. | -1.28 | 12.2 | 0.248 | 0.85 | 0.76 | 0.98 | 1.0 | 0.81 | 0.86 | |||
| CLM4SP_GSWP3 | [-] | 362. | 362. | 366. | 389. | -0.658 | 11.4 | 0.196 | 0.86 | 0.78 | 0.99 | 1.0 | 0.79 | 0.86 | |||
| CLM5_CRUNCEP | [-] | 362. | 363. | 366. | 389. | -0.870 | 12.0 | 0.447 | 0.85 | 0.77 | 0.97 | 1.0 | 0.80 | 0.86 | |||
| CLM5_GSWP3 | [-] | 365. | 365. | 366. | 389. | 1.41 | 11.8 | 0.429 | 0.86 | 0.77 | 0.97 | 1.0 | 0.78 | 0.86 | |||
| CLM5SP_CRUNCEP | [-] | 363. | 363. | 366. | 389. | -0.518 | 11.6 | 0.262 | 0.85 | 0.78 | 0.98 | 1.0 | 0.79 | 0.86 | |||
| CLM5SP_GSWP3 | [-] | 364. | 364. | 366. | 389. | 1.15 | 11.6 | 0.230 | 0.86 | 0.78 | 0.98 | 1.0 | 0.77 | 0.86 |
Download Data |
Period Mean (original grids) [W/m2] |
Model Period Mean (intersection) [W/m2] |
Model Period Mean (complement) [W/m2] |
Benchmark Period Mean (intersection) [W/m2] |
Benchmark Period Mean (complement) [W/m2] |
Bias [W/m2] |
RMSE [W/m2] |
Phase Shift [months] |
Bias Score [1] |
RMSE Score [1] |
Seasonal Cycle Score [1] |
Spatial Distribution Score [1] |
Interannual Variability Score [1] |
Overall Score [1] |
|||
|---|---|---|---|---|---|---|---|---|---|---|---|---|---|---|---|---|---|
| Benchmark | [-] | 399. | |||||||||||||||
| CLM4.5_CRUNCEP | [-] | 375. | 375. | 376. | 409. | -0.0436 | 17.0 | 0.506 | 0.69 | 0.67 | 0.94 | 1.0 | 0.71 | 0.78 | |||
| CLM4.5_GSWP3 | [-] | 378. | 378. | 376. | 409. | 3.73 | 15.1 | 0.495 | 0.74 | 0.67 | 0.94 | 1.0 | 0.72 | 0.79 | |||
| CLM4.5SP_GSWP3 | [-] | 377. | 377. | 376. | 409. | 3.05 | 14.3 | 0.485 | 0.76 | 0.68 | 0.95 | 1.0 | 0.71 | 0.80 | |||
| CLM4_CRUNCEP | [-] | 373. | 373. | 376. | 409. | -1.28 | 16.7 | 0.501 | 0.70 | 0.67 | 0.94 | 1.0 | 0.71 | 0.78 | |||
| CLM4_GSWP3 | [-] | 377. | 377. | 376. | 409. | 2.37 | 14.8 | 0.497 | 0.76 | 0.67 | 0.94 | 1.0 | 0.73 | 0.79 | |||
| CLM4SP_GSWP3 | [-] | 377. | 377. | 376. | 409. | 2.37 | 14.3 | 0.487 | 0.77 | 0.68 | 0.95 | 1.0 | 0.71 | 0.80 | |||
| CLM5_CRUNCEP | [-] | 378. | 378. | 376. | 409. | 3.26 | 16.3 | 0.561 | 0.71 | 0.67 | 0.94 | 1.0 | 0.69 | 0.78 | |||
| CLM5_GSWP3 | [-] | 381. | 381. | 376. | 409. | 6.29 | 16.1 | 0.539 | 0.72 | 0.67 | 0.94 | 1.0 | 0.69 | 0.78 | |||
| CLM5SP_CRUNCEP | [-] | 377. | 377. | 376. | 409. | 2.36 | 15.5 | 0.507 | 0.73 | 0.68 | 0.94 | 1.0 | 0.68 | 0.78 | |||
| CLM5SP_GSWP3 | [-] | 380. | 380. | 376. | 409. | 5.23 | 15.4 | 0.494 | 0.74 | 0.67 | 0.94 | 1.0 | 0.69 | 0.79 |
Download Data |
Period Mean (original grids) [W/m2] |
Model Period Mean (intersection) [W/m2] |
Model Period Mean (complement) [W/m2] |
Benchmark Period Mean (intersection) [W/m2] |
Benchmark Period Mean (complement) [W/m2] |
Bias [W/m2] |
RMSE [W/m2] |
Phase Shift [months] |
Bias Score [1] |
RMSE Score [1] |
Seasonal Cycle Score [1] |
Spatial Distribution Score [1] |
Interannual Variability Score [1] |
Overall Score [1] |
|||
|---|---|---|---|---|---|---|---|---|---|---|---|---|---|---|---|---|---|
| Benchmark | [-] | 450. | |||||||||||||||
| CLM4.5_CRUNCEP | [-] | 455. | 455. | 450. | 446. | 5.39 | 16.4 | 0.340 | 0.81 | 0.76 | 0.97 | 0.99 | 0.72 | 0.84 | |||
| CLM4.5_GSWP3 | [-] | 451. | 451. | 450. | 446. | 0.875 | 14.7 | 0.336 | 0.85 | 0.76 | 0.97 | 1.0 | 0.74 | 0.85 | |||
| CLM4.5SP_GSWP3 | [-] | 451. | 451. | 450. | 446. | 0.992 | 14.7 | 0.336 | 0.85 | 0.76 | 0.97 | 1.0 | 0.74 | 0.85 | |||
| CLM4_CRUNCEP | [-] | 455. | 455. | 450. | 446. | 5.46 | 16.3 | 0.342 | 0.81 | 0.76 | 0.97 | 0.99 | 0.73 | 0.84 | |||
| CLM4_GSWP3 | [-] | 451. | 450. | 450. | 446. | 0.525 | 14.7 | 0.346 | 0.85 | 0.76 | 0.97 | 1.0 | 0.74 | 0.85 | |||
| CLM4SP_GSWP3 | [-] | 451. | 451. | 450. | 446. | 1.18 | 14.7 | 0.333 | 0.85 | 0.76 | 0.97 | 1.0 | 0.74 | 0.85 | |||
| CLM5_CRUNCEP | [-] | 457. | 457. | 450. | 446. | 6.78 | 16.8 | 0.377 | 0.81 | 0.76 | 0.97 | 0.99 | 0.71 | 0.83 | |||
| CLM5_GSWP3 | [-] | 452. | 452. | 450. | 446. | 2.24 | 15.1 | 0.358 | 0.84 | 0.76 | 0.97 | 1.0 | 0.72 | 0.84 | |||
| CLM5SP_CRUNCEP | [-] | 457. | 457. | 450. | 446. | 6.88 | 16.6 | 0.344 | 0.81 | 0.76 | 0.97 | 0.99 | 0.70 | 0.83 | |||
| CLM5SP_GSWP3 | [-] | 452. | 452. | 450. | 446. | 2.34 | 15.0 | 0.322 | 0.84 | 0.76 | 0.98 | 1.0 | 0.71 | 0.84 |
Download Data |
Period Mean (original grids) [W/m2] |
Model Period Mean (intersection) [W/m2] |
Model Period Mean (complement) [W/m2] |
Benchmark Period Mean (intersection) [W/m2] |
Benchmark Period Mean (complement) [W/m2] |
Bias [W/m2] |
RMSE [W/m2] |
Phase Shift [months] |
Bias Score [1] |
RMSE Score [1] |
Seasonal Cycle Score [1] |
Spatial Distribution Score [1] |
Interannual Variability Score [1] |
Overall Score [1] |
|||
|---|---|---|---|---|---|---|---|---|---|---|---|---|---|---|---|---|---|
| Benchmark | [-] | 281. | |||||||||||||||
| CLM4.5_CRUNCEP | [-] | 272. | 272. | 281. | 293. | -9.92 | 17.8 | 0.194 | 0.84 | 0.79 | 0.98 | 0.98 | 0.70 | 0.85 | |||
| CLM4.5_GSWP3 | [-] | 284. | 284. | 281. | 293. | 3.03 | 14.9 | 0.160 | 0.91 | 0.80 | 0.99 | 1.0 | 0.78 | 0.88 | |||
| CLM4.5SP_GSWP3 | [-] | 284. | 284. | 281. | 293. | 3.63 | 15.0 | 0.161 | 0.91 | 0.80 | 0.99 | 1.0 | 0.78 | 0.88 | |||
| CLM4_CRUNCEP | [-] | 271. | 271. | 281. | 293. | -10.3 | 18.2 | 0.200 | 0.84 | 0.78 | 0.98 | 0.98 | 0.71 | 0.85 | |||
| CLM4_GSWP3 | [-] | 284. | 284. | 281. | 293. | 3.30 | 14.8 | 0.172 | 0.91 | 0.80 | 0.99 | 1.0 | 0.80 | 0.88 | |||
| CLM4SP_GSWP3 | [-] | 284. | 284. | 281. | 293. | 3.10 | 14.6 | 0.170 | 0.91 | 0.81 | 0.99 | 1.0 | 0.79 | 0.88 | |||
| CLM5_CRUNCEP | [-] | 278. | 278. | 281. | 293. | -3.57 | 15.7 | 0.202 | 0.90 | 0.79 | 0.98 | 0.99 | 0.71 | 0.86 | |||
| CLM5_GSWP3 | [-] | 287. | 286. | 281. | 293. | 6.06 | 16.8 | 0.168 | 0.89 | 0.79 | 0.99 | 1.0 | 0.76 | 0.87 | |||
| CLM5SP_CRUNCEP | [-] | 278. | 278. | 281. | 293. | -3.57 | 15.7 | 0.202 | 0.90 | 0.79 | 0.98 | 0.99 | 0.70 | 0.86 | |||
| CLM5SP_GSWP3 | [-] | 287. | 287. | 281. | 293. | 6.28 | 16.8 | 0.170 | 0.89 | 0.79 | 0.99 | 1.0 | 0.76 | 0.87 |
Download Data |
Period Mean (original grids) [W/m2] |
Model Period Mean (intersection) [W/m2] |
Model Period Mean (complement) [W/m2] |
Benchmark Period Mean (intersection) [W/m2] |
Benchmark Period Mean (complement) [W/m2] |
Bias [W/m2] |
RMSE [W/m2] |
Phase Shift [months] |
Bias Score [1] |
RMSE Score [1] |
Seasonal Cycle Score [1] |
Spatial Distribution Score [1] |
Interannual Variability Score [1] |
Overall Score [1] |
|||
|---|---|---|---|---|---|---|---|---|---|---|---|---|---|---|---|---|---|
| Benchmark | [-] | 442. | |||||||||||||||
| CLM4.5_CRUNCEP | [-] | 444. | 444. | 439. | 459. | 9.15 | 18.6 | 0.833 | 0.53 | 0.54 | 0.89 | 1.0 | 0.72 | 0.70 | |||
| CLM4.5_GSWP3 | [-] | 446. | 446. | 439. | 459. | 10.4 | 18.3 | 0.873 | 0.52 | 0.55 | 0.89 | 0.97 | 0.72 | 0.70 | |||
| CLM4.5SP_GSWP3 | [-] | 442. | 442. | 439. | 459. | 7.62 | 15.8 | 0.842 | 0.58 | 0.57 | 0.89 | 0.96 | 0.69 | 0.71 | |||
| CLM4_CRUNCEP | [-] | 446. | 445. | 439. | 459. | 11.0 | 19.8 | 0.839 | 0.50 | 0.53 | 0.89 | 0.99 | 0.73 | 0.69 | |||
| CLM4_GSWP3 | [-] | 446. | 446. | 439. | 459. | 11.0 | 18.4 | 0.860 | 0.52 | 0.55 | 0.89 | 0.99 | 0.73 | 0.71 | |||
| CLM4SP_GSWP3 | [-] | 441. | 441. | 439. | 459. | 6.34 | 15.4 | 0.829 | 0.59 | 0.57 | 0.89 | 0.96 | 0.69 | 0.71 | |||
| CLM5_CRUNCEP | [-] | 446. | 446. | 439. | 459. | 11.3 | 19.0 | 0.815 | 0.51 | 0.55 | 0.90 | 1.0 | 0.69 | 0.70 | |||
| CLM5_GSWP3 | [-] | 447. | 447. | 439. | 459. | 12.0 | 18.6 | 0.885 | 0.51 | 0.56 | 0.89 | 0.95 | 0.67 | 0.69 | |||
| CLM5SP_CRUNCEP | [-] | 443. | 443. | 439. | 459. | 8.32 | 16.8 | 0.816 | 0.56 | 0.56 | 0.90 | 1.0 | 0.68 | 0.71 | |||
| CLM5SP_GSWP3 | [-] | 444. | 444. | 439. | 459. | 8.98 | 16.4 | 0.854 | 0.56 | 0.57 | 0.89 | 0.96 | 0.67 | 0.70 |
Download Data |
Period Mean (original grids) [W/m2] |
Model Period Mean (intersection) [W/m2] |
Model Period Mean (complement) [W/m2] |
Benchmark Period Mean (intersection) [W/m2] |
Benchmark Period Mean (complement) [W/m2] |
Bias [W/m2] |
RMSE [W/m2] |
Phase Shift [months] |
Bias Score [1] |
RMSE Score [1] |
Seasonal Cycle Score [1] |
Spatial Distribution Score [1] |
Interannual Variability Score [1] |
Overall Score [1] |
|||
|---|---|---|---|---|---|---|---|---|---|---|---|---|---|---|---|---|---|
| Benchmark | [-] | 386. | |||||||||||||||
| CLM4.5_CRUNCEP | [-] | 382. | 382. | 384. | 429. | 0.154 | 10.0 | 0.112 | 0.89 | 0.84 | 0.99 | 0.99 | 0.89 | 0.91 | |||
| CLM4.5_GSWP3 | [-] | 387. | 387. | 384. | 429. | 4.69 | 10.5 | 0.0936 | 0.88 | 0.85 | 0.99 | 1.0 | 0.88 | 0.91 | |||
| CLM4.5SP_GSWP3 | [-] | 388. | 388. | 384. | 429. | 5.80 | 10.5 | 0.101 | 0.87 | 0.86 | 0.99 | 1.0 | 0.86 | 0.91 | |||
| CLM4_CRUNCEP | [-] | 381. | 381. | 384. | 429. | -0.942 | 9.59 | 0.124 | 0.89 | 0.85 | 0.99 | 0.99 | 0.89 | 0.91 | |||
| CLM4_GSWP3 | [-] | 385. | 385. | 384. | 429. | 3.03 | 9.72 | 0.120 | 0.90 | 0.85 | 0.99 | 1.0 | 0.88 | 0.91 | |||
| CLM4SP_GSWP3 | [-] | 387. | 387. | 384. | 429. | 5.24 | 10.4 | 0.0715 | 0.88 | 0.86 | 1.0 | 1.0 | 0.86 | 0.91 | |||
| CLM5_CRUNCEP | [-] | 388. | 388. | 384. | 429. | 6.07 | 11.6 | 0.309 | 0.86 | 0.85 | 0.98 | 0.99 | 0.87 | 0.90 | |||
| CLM5_GSWP3 | [-] | 391. | 391. | 384. | 429. | 8.89 | 13.0 | 0.112 | 0.82 | 0.86 | 0.99 | 0.99 | 0.85 | 0.90 | |||
| CLM5SP_CRUNCEP | [-] | 388. | 388. | 384. | 429. | 6.21 | 11.1 | 0.106 | 0.86 | 0.86 | 0.99 | 0.99 | 0.87 | 0.90 | |||
| CLM5SP_GSWP3 | [-] | 390. | 390. | 384. | 429. | 7.99 | 11.9 | 0.0700 | 0.84 | 0.86 | 1.0 | 1.0 | 0.85 | 0.90 |
Download Data |
Period Mean (original grids) [W/m2] |
Model Period Mean (intersection) [W/m2] |
Model Period Mean (complement) [W/m2] |
Benchmark Period Mean (intersection) [W/m2] |
Benchmark Period Mean (complement) [W/m2] |
Bias [W/m2] |
RMSE [W/m2] |
Phase Shift [months] |
Bias Score [1] |
RMSE Score [1] |
Seasonal Cycle Score [1] |
Spatial Distribution Score [1] |
Interannual Variability Score [1] |
Overall Score [1] |
|||
|---|---|---|---|---|---|---|---|---|---|---|---|---|---|---|---|---|---|
| Benchmark | [-] | 324. | |||||||||||||||
| CLM4.5_CRUNCEP | [-] | 316. | 316. | 323. | 347. | -5.85 | 11.4 | 0.0600 | 0.88 | 0.84 | 1.0 | 1.0 | 0.79 | 0.89 | |||
| CLM4.5_GSWP3 | [-] | 325. | 325. | 323. | 347. | 2.59 | 11.8 | 0.0528 | 0.91 | 0.83 | 1.0 | 0.98 | 0.79 | 0.89 | |||
| CLM4.5SP_GSWP3 | [-] | 327. | 327. | 323. | 347. | 4.28 | 12.2 | 0.0532 | 0.90 | 0.83 | 1.0 | 0.97 | 0.79 | 0.89 | |||
| CLM4_CRUNCEP | [-] | 315. | 316. | 323. | 347. | -6.68 | 11.5 | 0.0546 | 0.87 | 0.84 | 1.0 | 1.0 | 0.79 | 0.89 | |||
| CLM4_GSWP3 | [-] | 325. | 325. | 323. | 347. | 2.59 | 11.7 | 0.0506 | 0.91 | 0.83 | 1.0 | 0.98 | 0.80 | 0.89 | |||
| CLM4SP_GSWP3 | [-] | 325. | 326. | 323. | 347. | 3.12 | 11.9 | 0.0527 | 0.91 | 0.83 | 1.0 | 0.97 | 0.79 | 0.89 | |||
| CLM5_CRUNCEP | [-] | 323. | 323. | 323. | 347. | 0.502 | 10.9 | 0.135 | 0.91 | 0.84 | 0.99 | 0.99 | 0.78 | 0.89 | |||
| CLM5_GSWP3 | [-] | 328. | 328. | 323. | 347. | 5.87 | 13.2 | 0.104 | 0.88 | 0.83 | 0.99 | 0.97 | 0.78 | 0.88 | |||
| CLM5SP_CRUNCEP | [-] | 324. | 324. | 323. | 347. | 1.68 | 10.7 | 0.0546 | 0.91 | 0.84 | 1.0 | 0.99 | 0.78 | 0.89 | |||
| CLM5SP_GSWP3 | [-] | 329. | 329. | 323. | 347. | 6.71 | 13.5 | 0.0540 | 0.87 | 0.83 | 1.0 | 0.97 | 0.78 | 0.88 |
Download Data |
Period Mean (original grids) [W/m2] |
Model Period Mean (intersection) [W/m2] |
Model Period Mean (complement) [W/m2] |
Benchmark Period Mean (intersection) [W/m2] |
Benchmark Period Mean (complement) [W/m2] |
Bias [W/m2] |
RMSE [W/m2] |
Phase Shift [months] |
Bias Score [1] |
RMSE Score [1] |
Seasonal Cycle Score [1] |
Spatial Distribution Score [1] |
Interannual Variability Score [1] |
Overall Score [1] |
|||
|---|---|---|---|---|---|---|---|---|---|---|---|---|---|---|---|---|---|
| Benchmark | [-] | 377. | |||||||||||||||
| CLM4.5_CRUNCEP | [-] | 374. | 375. | 377. | 378. | -2.11 | 15.1 | 0.0899 | 0.82 | 0.81 | 0.99 | 0.97 | 0.84 | 0.87 | |||
| CLM4.5_GSWP3 | [-] | 378. | 380. | 377. | 378. | 2.51 | 12.8 | 0.0852 | 0.86 | 0.82 | 0.99 | 1.0 | 0.79 | 0.88 | |||
| CLM4.5SP_GSWP3 | [-] | 378. | 379. | 377. | 378. | 2.27 | 12.6 | 0.0867 | 0.86 | 0.83 | 0.99 | 1.0 | 0.77 | 0.88 | |||
| CLM4_CRUNCEP | [-] | 373. | 374. | 377. | 378. | -2.73 | 14.9 | 0.0869 | 0.82 | 0.81 | 0.99 | 0.96 | 0.82 | 0.87 | |||
| CLM4_GSWP3 | [-] | 378. | 379. | 377. | 378. | 2.19 | 12.8 | 0.0869 | 0.86 | 0.82 | 0.99 | 1.0 | 0.78 | 0.88 | |||
| CLM4SP_GSWP3 | [-] | 378. | 379. | 377. | 378. | 2.17 | 12.7 | 0.0910 | 0.86 | 0.82 | 0.99 | 1.0 | 0.77 | 0.88 | |||
| CLM5_CRUNCEP | [-] | 378. | 379. | 377. | 378. | 2.18 | 14.4 | 0.110 | 0.84 | 0.81 | 0.99 | 0.98 | 0.80 | 0.87 | |||
| CLM5_GSWP3 | [-] | 381. | 382. | 377. | 378. | 5.35 | 14.1 | 0.110 | 0.84 | 0.81 | 0.99 | 1.0 | 0.74 | 0.87 | |||
| CLM5SP_CRUNCEP | [-] | 377. | 378. | 377. | 378. | 1.16 | 13.8 | 0.0965 | 0.84 | 0.82 | 0.99 | 0.99 | 0.78 | 0.87 | |||
| CLM5SP_GSWP3 | [-] | 380. | 381. | 377. | 378. | 4.28 | 13.6 | 0.0956 | 0.85 | 0.82 | 0.99 | 1.0 | 0.73 | 0.87 |
Download Data |
Period Mean (original grids) [W/m2] |
Model Period Mean (intersection) [W/m2] |
Model Period Mean (complement) [W/m2] |
Benchmark Period Mean (intersection) [W/m2] |
Benchmark Period Mean (complement) [W/m2] |
Bias [W/m2] |
RMSE [W/m2] |
Phase Shift [months] |
Bias Score [1] |
RMSE Score [1] |
Seasonal Cycle Score [1] |
Spatial Distribution Score [1] |
Interannual Variability Score [1] |
Overall Score [1] |
|||
|---|---|---|---|---|---|---|---|---|---|---|---|---|---|---|---|---|---|
| Benchmark | [-] | 449. | |||||||||||||||
| CLM4.5_CRUNCEP | [-] | 455. | 455. | 449. | 463. | 6.56 | 14.3 | 1.07 | 0.36 | 0.40 | 0.86 | 0.89 | 0.69 | 0.60 | |||
| CLM4.5_GSWP3 | [-] | 456. | 456. | 449. | 463. | 7.39 | 14.0 | 1.15 | 0.36 | 0.39 | 0.85 | 0.97 | 0.65 | 0.60 | |||
| CLM4.5SP_GSWP3 | [-] | 455. | 455. | 449. | 463. | 6.41 | 13.1 | 1.19 | 0.39 | 0.39 | 0.85 | 1.0 | 0.62 | 0.61 | |||
| CLM4_CRUNCEP | [-] | 453. | 453. | 449. | 463. | 4.25 | 13.2 | 1.08 | 0.41 | 0.40 | 0.86 | 0.89 | 0.68 | 0.61 | |||
| CLM4_GSWP3 | [-] | 453. | 453. | 449. | 463. | 4.81 | 12.6 | 1.19 | 0.44 | 0.39 | 0.84 | 0.98 | 0.65 | 0.62 | |||
| CLM4SP_GSWP3 | [-] | 454. | 454. | 449. | 463. | 5.36 | 12.6 | 1.16 | 0.42 | 0.40 | 0.85 | 1.0 | 0.63 | 0.61 | |||
| CLM5_CRUNCEP | [-] | 456. | 456. | 449. | 463. | 7.54 | 14.0 | 1.07 | 0.35 | 0.41 | 0.86 | 0.95 | 0.67 | 0.61 | |||
| CLM5_GSWP3 | [-] | 458. | 458. | 449. | 463. | 9.09 | 14.8 | 1.21 | 0.32 | 0.40 | 0.84 | 0.99 | 0.63 | 0.59 | |||
| CLM5SP_CRUNCEP | [-] | 457. | 457. | 449. | 463. | 7.89 | 14.1 | 1.11 | 0.34 | 0.41 | 0.85 | 0.96 | 0.66 | 0.61 | |||
| CLM5SP_GSWP3 | [-] | 457. | 457. | 449. | 463. | 8.33 | 14.2 | 1.22 | 0.34 | 0.40 | 0.84 | 1.0 | 0.62 | 0.60 |
Download Data |
Period Mean (original grids) [W/m2] |
Model Period Mean (intersection) [W/m2] |
Model Period Mean (complement) [W/m2] |
Benchmark Period Mean (intersection) [W/m2] |
Benchmark Period Mean (complement) [W/m2] |
Bias [W/m2] |
RMSE [W/m2] |
Phase Shift [months] |
Bias Score [1] |
RMSE Score [1] |
Seasonal Cycle Score [1] |
Spatial Distribution Score [1] |
Interannual Variability Score [1] |
Overall Score [1] |
|||
|---|---|---|---|---|---|---|---|---|---|---|---|---|---|---|---|---|---|
| Benchmark | [-] | 443. | |||||||||||||||
| CLM4.5_CRUNCEP | [-] | 447. | 447. | 443. | 434. | 3.31 | 15.4 | 0.843 | 0.65 | 0.56 | 0.88 | 0.96 | 0.74 | 0.72 | |||
| CLM4.5_GSWP3 | [-] | 447. | 447. | 443. | 434. | 3.04 | 14.5 | 0.944 | 0.68 | 0.56 | 0.86 | 0.98 | 0.71 | 0.73 | |||
| CLM4.5SP_GSWP3 | [-] | 446. | 445. | 443. | 434. | 1.75 | 12.4 | 0.834 | 0.77 | 0.58 | 0.88 | 1.0 | 0.66 | 0.74 | |||
| CLM4_CRUNCEP | [-] | 445. | 444. | 443. | 434. | 0.796 | 15.0 | 0.770 | 0.67 | 0.56 | 0.89 | 0.97 | 0.73 | 0.73 | |||
| CLM4_GSWP3 | [-] | 445. | 444. | 443. | 434. | 0.689 | 14.3 | 0.848 | 0.71 | 0.55 | 0.88 | 0.98 | 0.70 | 0.73 | |||
| CLM4SP_GSWP3 | [-] | 445. | 444. | 443. | 434. | 1.01 | 12.4 | 0.769 | 0.77 | 0.58 | 0.89 | 1.0 | 0.65 | 0.74 | |||
| CLM5_CRUNCEP | [-] | 449. | 449. | 443. | 434. | 4.97 | 13.9 | 0.865 | 0.70 | 0.57 | 0.88 | 0.99 | 0.69 | 0.73 | |||
| CLM5_GSWP3 | [-] | 449. | 449. | 443. | 434. | 5.44 | 14.2 | 0.895 | 0.70 | 0.56 | 0.87 | 0.99 | 0.66 | 0.72 | |||
| CLM5SP_CRUNCEP | [-] | 447. | 447. | 443. | 434. | 3.42 | 12.5 | 0.714 | 0.74 | 0.59 | 0.90 | 1.0 | 0.67 | 0.75 | |||
| CLM5SP_GSWP3 | [-] | 447. | 447. | 443. | 434. | 3.23 | 12.7 | 0.810 | 0.76 | 0.57 | 0.89 | 1.0 | 0.65 | 0.74 |
Download Data |
Period Mean (original grids) [W/m2] |
Model Period Mean (intersection) [W/m2] |
Model Period Mean (complement) [W/m2] |
Benchmark Period Mean (intersection) [W/m2] |
Benchmark Period Mean (complement) [W/m2] |
Bias [W/m2] |
RMSE [W/m2] |
Phase Shift [months] |
Bias Score [1] |
RMSE Score [1] |
Seasonal Cycle Score [1] |
Spatial Distribution Score [1] |
Interannual Variability Score [1] |
Overall Score [1] |
|||
|---|---|---|---|---|---|---|---|---|---|---|---|---|---|---|---|---|---|
| Benchmark | [-] | 383. | |||||||||||||||
| CLM4.5_CRUNCEP | [-] | 382. | 381. | 381. | 396. | 0.459 | 21.0 | 0.916 | 0.62 | 0.56 | 0.89 | 1.0 | 0.67 | 0.71 | |||
| CLM4.5_GSWP3 | [-] | 386. | 385. | 381. | 396. | 4.47 | 20.2 | 0.914 | 0.63 | 0.57 | 0.89 | 1.0 | 0.66 | 0.72 | |||
| CLM4.5SP_GSWP3 | [-] | 385. | 384. | 381. | 396. | 4.05 | 19.6 | 0.905 | 0.64 | 0.57 | 0.89 | 1.0 | 0.65 | 0.72 | |||
| CLM4_CRUNCEP | [-] | 380. | 378. | 381. | 396. | -1.53 | 21.1 | 0.906 | 0.61 | 0.56 | 0.89 | 1.0 | 0.66 | 0.71 | |||
| CLM4_GSWP3 | [-] | 384. | 383. | 381. | 396. | 2.84 | 19.9 | 0.905 | 0.64 | 0.57 | 0.89 | 1.0 | 0.66 | 0.72 | |||
| CLM4SP_GSWP3 | [-] | 384. | 383. | 381. | 396. | 2.97 | 19.3 | 0.900 | 0.65 | 0.57 | 0.89 | 1.0 | 0.65 | 0.72 | |||
| CLM5_CRUNCEP | [-] | 383. | 383. | 381. | 396. | 2.21 | 20.5 | 0.925 | 0.63 | 0.57 | 0.88 | 1.0 | 0.65 | 0.72 | |||
| CLM5_GSWP3 | [-] | 387. | 386. | 381. | 396. | 5.53 | 20.2 | 0.891 | 0.63 | 0.57 | 0.89 | 1.0 | 0.64 | 0.72 | |||
| CLM5SP_CRUNCEP | [-] | 383. | 383. | 381. | 396. | 2.29 | 19.9 | 1.02 | 0.64 | 0.57 | 0.87 | 1.0 | 0.63 | 0.71 | |||
| CLM5SP_GSWP3 | [-] | 388. | 387. | 381. | 396. | 6.19 | 20.3 | 0.938 | 0.62 | 0.57 | 0.88 | 0.99 | 0.62 | 0.71 |
Temporally integrated period mean