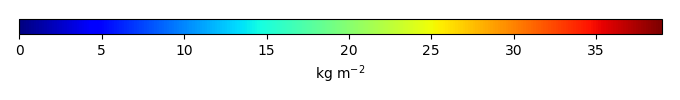
Mean State
Download Data |
Period Mean (original grids) [Pg] |
Model Period Mean (intersection) [Pg] |
Model Period Mean (complement) [Pg] |
Benchmark Period Mean (intersection) [Pg] |
Benchmark Period Mean (complement) [Pg] |
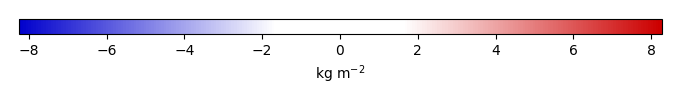
Bias [kg m-2] |
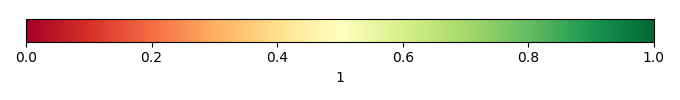
Bias Score [1] |
Spatial Distribution Score [1] |
Overall Score [1] |
|||
|---|---|---|---|---|---|---|---|---|---|---|---|---|
| Benchmark | [-] | 32.8 | ||||||||||
| CLM4 | [-] | 58.2 | 59.2 | 0.191 | 32.8 | 0.0526 | 6.64 | 0.47 | 0.64 | 0.56 | ||
| CLM4.5 | [-] | 58.7 | 58.8 | 0.225 | 32.8 | 0.0526 | 6.61 | 0.40 | 0.53 | 0.46 | ||
| CLM5 | [-] | 42.9 | 43.3 | 0.233 | 32.8 | 0.0526 | 2.86 | 0.65 | 0.86 | 0.76 |
Download Data |
Period Mean (original grids) [Pg] |
Model Period Mean (intersection) [Pg] |
Model Period Mean (complement) [Pg] |
Benchmark Period Mean (intersection) [Pg] |
Benchmark Period Mean (complement) [Pg] |
Bias [kg m-2] |
Bias Score [1] |
Spatial Distribution Score [1] |
Overall Score [1] |
|||
|---|---|---|---|---|---|---|---|---|---|---|---|---|
| Benchmark | [-] | 8.35 | ||||||||||
| CLM4 | [-] | 7.46 | 6.52 | 0.0693 | 8.34 | 0.0114 | -0.305 | 0.61 | 0.88 | 0.74 | ||
| CLM4.5 | [-] | 2.43 | 2.02 | 0.137 | 8.34 | 0.0114 | -1.10 | 0.44 | 0.55 | 0.50 | ||
| CLM5 | [-] | 3.54 | 2.95 | 0.191 | 8.34 | 0.0114 | -0.934 | 0.50 | 0.66 | 0.58 |
Download Data |
Period Mean (original grids) [Pg] |
Model Period Mean (intersection) [Pg] |
Model Period Mean (complement) [Pg] |
Benchmark Period Mean (intersection) [Pg] |
Benchmark Period Mean (complement) [Pg] |
Bias [kg m-2] |
Bias Score [1] |
Spatial Distribution Score [1] |
Overall Score [1] |
|||
|---|---|---|---|---|---|---|---|---|---|---|---|---|
| Benchmark | [-] | 10.6 | ||||||||||
| CLM4 | [-] | 13.7 | 13.2 | 0.225 | 10.6 | 0.0246 | 0.363 | 0.50 | 0.49 | 0.49 | ||
| CLM4.5 | [-] | 6.81 | 6.40 | 0.250 | 10.6 | 0.0246 | -0.363 | 0.48 | 0.62 | 0.55 | ||
| CLM5 | [-] | 17.1 | 16.4 | 0.388 | 10.6 | 0.0246 | 0.803 | 0.51 | 0.51 | 0.51 |
Download Data |
Period Mean (original grids) [Pg] |
Model Period Mean (intersection) [Pg] |
Model Period Mean (complement) [Pg] |
Benchmark Period Mean (intersection) [Pg] |
Benchmark Period Mean (complement) [Pg] |
Bias [kg m-2] |
Bias Score [1] |
Spatial Distribution Score [1] |
Overall Score [1] |
|||
|---|---|---|---|---|---|---|---|---|---|---|---|---|
| Benchmark | [-] | 4.69 | ||||||||||
| CLM4 | [-] | 0.756 | 0.756 | 0.0220 | 4.67 | 0.0241 | -1.13 | 0.43 | 0.28 | 0.36 | ||
| CLM4.5 | [-] | 3.26 | 3.23 | 0.0402 | 4.67 | 0.0241 | -0.357 | 0.60 | 0.69 | 0.64 | ||
| CLM5 | [-] | 5.06 | 5.01 | 0.0720 | 4.67 | 0.0241 | 0.237 | 0.60 | 0.86 | 0.73 |
Download Data |
Period Mean (original grids) [Pg] |
Model Period Mean (intersection) [Pg] |
Model Period Mean (complement) [Pg] |
Benchmark Period Mean (intersection) [Pg] |
Benchmark Period Mean (complement) [Pg] |
Bias [kg m-2] |
Bias Score [1] |
Spatial Distribution Score [1] |
Overall Score [1] |
|||
|---|---|---|---|---|---|---|---|---|---|---|---|---|
| Benchmark | [-] | 27.8 | ||||||||||
| CLM4 | [-] | 79.6 | 76.4 | 2.85 | 26.8 | 0.921 | 22.3 | 0.19 | 0.54 | 0.36 | ||
| CLM4.5 | [-] | 66.8 | 64.1 | 2.46 | 26.8 | 0.921 | 17.8 | 0.27 | 0.78 | 0.53 | ||
| CLM5 | [-] | 49.4 | 47.3 | 1.89 | 26.8 | 0.921 | 11.4 | 0.47 | 0.91 | 0.69 |
Download Data |
Period Mean (original grids) [Pg] |
Model Period Mean (intersection) [Pg] |
Model Period Mean (complement) [Pg] |
Benchmark Period Mean (intersection) [Pg] |
Benchmark Period Mean (complement) [Pg] |
Bias [kg m-2] |
Bias Score [1] |
Spatial Distribution Score [1] |
Overall Score [1] |
|||
|---|---|---|---|---|---|---|---|---|---|---|---|---|
| Benchmark | [-] | 43.5 | ||||||||||
| CLM4 | [-] | 38.4 | 37.5 | 0.157 | 43.5 | 0.0288 | -0.536 | 0.58 | 0.79 | 0.69 | ||
| CLM4.5 | [-] | 42.8 | 41.8 | 0.204 | 43.5 | 0.0288 | -0.0592 | 0.54 | 0.76 | 0.65 | ||
| CLM5 | [-] | 73.2 | 71.7 | 0.369 | 43.5 | 0.0288 | 3.33 | 0.50 | 0.55 | 0.52 |
Download Data |
Period Mean (original grids) [Pg] |
Model Period Mean (intersection) [Pg] |
Model Period Mean (complement) [Pg] |
Benchmark Period Mean (intersection) [Pg] |
Benchmark Period Mean (complement) [Pg] |
Bias [kg m-2] |
Bias Score [1] |
Spatial Distribution Score [1] |
Overall Score [1] |
|||
|---|---|---|---|---|---|---|---|---|---|---|---|---|
| Benchmark | [-] | 32.0 | ||||||||||
| CLM4 | [-] | 45.4 | 45.4 | 0.720 | 31.9 | 0.0804 | 1.17 | 0.52 | 0.68 | 0.60 | ||
| CLM4.5 | [-] | 44.2 | 44.1 | 0.725 | 31.9 | 0.0804 | 1.09 | 0.46 | 0.66 | 0.56 | ||
| CLM5 | [-] | 36.1 | 36.1 | 0.765 | 31.9 | 0.0804 | 0.598 | 0.50 | 0.75 | 0.63 |
Download Data |
Period Mean (original grids) [Pg] |
Model Period Mean (intersection) [Pg] |
Model Period Mean (complement) [Pg] |
Benchmark Period Mean (intersection) [Pg] |
Benchmark Period Mean (complement) [Pg] |
Bias [kg m-2] |
Bias Score [1] |
Spatial Distribution Score [1] |
Overall Score [1] |
|||
|---|---|---|---|---|---|---|---|---|---|---|---|---|
| Benchmark | [-] | 21.1 | ||||||||||
| CLM4 | [-] | 30.3 | 28.8 | 0.611 | 20.9 | 0.146 | 2.23 | 0.54 | 0.66 | 0.60 | ||
| CLM4.5 | [-] | 25.6 | 24.1 | 0.649 | 20.9 | 0.146 | 1.66 | 0.45 | 0.57 | 0.51 | ||
| CLM5 | [-] | 25.4 | 24.1 | 0.687 | 20.9 | 0.146 | 1.53 | 0.54 | 0.74 | 0.64 |
Download Data |
Period Mean (original grids) [Pg] |
Model Period Mean (intersection) [Pg] |
Model Period Mean (complement) [Pg] |
Benchmark Period Mean (intersection) [Pg] |
Benchmark Period Mean (complement) [Pg] |
Bias [kg m-2] |
Bias Score [1] |
Spatial Distribution Score [1] |
Overall Score [1] |
|||
|---|---|---|---|---|---|---|---|---|---|---|---|---|
| Benchmark | [-] | 3.81 | ||||||||||
| CLM4 | [-] | 0.856 | 0.941 | 0.0203 | 3.81 | 0.000319 | -0.812 | 0.46 | 0.37 | 0.41 | ||
| CLM4.5 | [-] | 3.54 | 3.69 | 0.0538 | 3.81 | 0.000319 | -0.0140 | 0.62 | 0.83 | 0.73 | ||
| CLM5 | [-] | 8.81 | 9.19 | 0.106 | 3.81 | 0.000319 | 1.63 | 0.46 | 0.68 | 0.57 |
Download Data |
Period Mean (original grids) [Pg] |
Model Period Mean (intersection) [Pg] |
Model Period Mean (complement) [Pg] |
Benchmark Period Mean (intersection) [Pg] |
Benchmark Period Mean (complement) [Pg] |
Bias [kg m-2] |
Bias Score [1] |
Spatial Distribution Score [1] |
Overall Score [1] |
|||
|---|---|---|---|---|---|---|---|---|---|---|---|---|
| Benchmark | [-] | 9.16 | ||||||||||
| CLM4 | [-] | 7.53 | 6.88 | 0.523 | 8.87 | 0.289 | 0.216 | 0.54 | 0.77 | 0.66 | ||
| CLM4.5 | [-] | 7.58 | 6.88 | 0.581 | 8.87 | 0.289 | 0.219 | 0.58 | 0.83 | 0.70 | ||
| CLM5 | [-] | 11.5 | 10.5 | 0.819 | 8.87 | 0.289 | 0.811 | 0.58 | 0.78 | 0.68 |
Download Data |
Period Mean (original grids) [Pg] |
Model Period Mean (intersection) [Pg] |
Model Period Mean (complement) [Pg] |
Benchmark Period Mean (intersection) [Pg] |
Benchmark Period Mean (complement) [Pg] |
Bias [kg m-2] |
Bias Score [1] |
Spatial Distribution Score [1] |
Overall Score [1] |
|||
|---|---|---|---|---|---|---|---|---|---|---|---|---|
| Benchmark | [-] | 12.0 | ||||||||||
| CLM4 | [-] | 8.10 | 7.78 | 0.185 | 12.0 | 0.0529 | -0.409 | 0.58 | 0.83 | 0.71 | ||
| CLM4.5 | [-] | 14.6 | 14.0 | 0.322 | 12.0 | 0.0529 | 0.861 | 0.62 | 0.77 | 0.70 | ||
| CLM5 | [-] | 26.8 | 25.7 | 0.646 | 12.0 | 0.0529 | 3.42 | 0.44 | 0.26 | 0.35 |
Download Data |
Period Mean (original grids) [Pg] |
Model Period Mean (intersection) [Pg] |
Model Period Mean (complement) [Pg] |
Benchmark Period Mean (intersection) [Pg] |
Benchmark Period Mean (complement) [Pg] |
Bias [kg m-2] |
Bias Score [1] |
Spatial Distribution Score [1] |
Overall Score [1] |
|||
|---|---|---|---|---|---|---|---|---|---|---|---|---|
| Benchmark | [-] | 368. | ||||||||||
| CLM4 | [-] | 582. | 573. | 9.02 | 363. | 4.64 | 2.29 | 0.46 | 0.49 | 0.48 | ||
| CLM4.5 | [-] | 560. | 550. | 9.81 | 363. | 4.64 | 2.12 | 0.45 | 0.58 | 0.51 | ||
| CLM5 | [-] | 589. | 578. | 11.2 | 363. | 4.64 | 2.37 | 0.51 | 0.68 | 0.60 |
Download Data |
Period Mean (original grids) [Pg] |
Model Period Mean (intersection) [Pg] |
Model Period Mean (complement) [Pg] |
Benchmark Period Mean (intersection) [Pg] |
Benchmark Period Mean (complement) [Pg] |
Bias [kg m-2] |
Bias Score [1] |
Spatial Distribution Score [1] |
Overall Score [1] |
|||
|---|---|---|---|---|---|---|---|---|---|---|---|---|
| Benchmark | [-] | 1.24 | ||||||||||
| CLM4 | [-] | 1.35 | 1.20 | 0.140 | 1.23 | 0.00783 | 0.0345 | 0.55 | 0.81 | 0.68 | ||
| CLM4.5 | [-] | 1.53 | 1.28 | 0.255 | 1.23 | 0.00783 | 0.0560 | 0.52 | 0.68 | 0.60 | ||
| CLM5 | [-] | 1.68 | 1.27 | 0.401 | 1.23 | 0.00783 | 0.0633 | 0.49 | 0.67 | 0.58 |
Download Data |
Period Mean (original grids) [Pg] |
Model Period Mean (intersection) [Pg] |
Model Period Mean (complement) [Pg] |
Benchmark Period Mean (intersection) [Pg] |
Benchmark Period Mean (complement) [Pg] |
Bias [kg m-2] |
Bias Score [1] |
Spatial Distribution Score [1] |
Overall Score [1] |
|||
|---|---|---|---|---|---|---|---|---|---|---|---|---|
| Benchmark | [-] | 5.62 | ||||||||||
| CLM4 | [-] | 4.27 | 4.16 | 0.0382 | 5.59 | 0.0265 | -0.181 | 0.57 | 0.83 | 0.70 | ||
| CLM4.5 | [-] | 9.20 | 8.91 | 0.148 | 5.59 | 0.0265 | 0.659 | 0.54 | 0.80 | 0.67 | ||
| CLM5 | [-] | 16.4 | 16.0 | 0.288 | 5.59 | 0.0265 | 1.94 | 0.30 | 0.36 | 0.33 |
Download Data |
Period Mean (original grids) [Pg] |
Model Period Mean (intersection) [Pg] |
Model Period Mean (complement) [Pg] |
Benchmark Period Mean (intersection) [Pg] |
Benchmark Period Mean (complement) [Pg] |
Bias [kg m-2] |
Bias Score [1] |
Spatial Distribution Score [1] |
Overall Score [1] |
|||
|---|---|---|---|---|---|---|---|---|---|---|---|---|
| Benchmark | [-] | 8.21 | ||||||||||
| CLM4 | [-] | 5.39 | 4.80 | 0.286 | 8.09 | 0.122 | -0.207 | 0.46 | 0.42 | 0.44 | ||
| CLM4.5 | [-] | 11.4 | 10.7 | 0.449 | 8.09 | 0.122 | 2.16 | 0.44 | 0.40 | 0.42 | ||
| CLM5 | [-] | 11.9 | 11.1 | 0.518 | 8.09 | 0.122 | 2.42 | 0.50 | 0.50 | 0.50 |
Download Data |
Period Mean (original grids) [Pg] |
Model Period Mean (intersection) [Pg] |
Model Period Mean (complement) [Pg] |
Benchmark Period Mean (intersection) [Pg] |
Benchmark Period Mean (complement) [Pg] |
Bias [kg m-2] |
Bias Score [1] |
Spatial Distribution Score [1] |
Overall Score [1] |
|||
|---|---|---|---|---|---|---|---|---|---|---|---|---|
| Benchmark | [-] | 14.8 | ||||||||||
| CLM4 | [-] | 16.4 | 16.1 | 0.184 | 14.8 | 0.0147 | 0.622 | 0.66 | 0.79 | 0.72 | ||
| CLM4.5 | [-] | 20.4 | 20.0 | 0.238 | 14.8 | 0.0147 | 1.63 | 0.61 | 0.67 | 0.64 | ||
| CLM5 | [-] | 17.8 | 17.4 | 0.231 | 14.8 | 0.0147 | 1.04 | 0.63 | 0.72 | 0.67 |
Download Data |
Period Mean (original grids) [Pg] |
Model Period Mean (intersection) [Pg] |
Model Period Mean (complement) [Pg] |
Benchmark Period Mean (intersection) [Pg] |
Benchmark Period Mean (complement) [Pg] |
Bias [kg m-2] |
Bias Score [1] |
Spatial Distribution Score [1] |
Overall Score [1] |
|||
|---|---|---|---|---|---|---|---|---|---|---|---|---|
| Benchmark | [-] | 20.1 | ||||||||||
| CLM4 | [-] | 25.1 | 25.1 | 0.185 | 19.8 | 0.219 | 1.29 | 0.53 | 0.79 | 0.66 | ||
| CLM4.5 | [-] | 34.8 | 34.8 | 0.196 | 19.8 | 0.219 | 3.16 | 0.49 | 0.79 | 0.64 | ||
| CLM5 | [-] | 56.8 | 56.7 | 0.307 | 19.8 | 0.219 | 7.50 | 0.30 | 0.63 | 0.47 |
Download Data |
Period Mean (original grids) [Pg] |
Model Period Mean (intersection) [Pg] |
Model Period Mean (complement) [Pg] |
Benchmark Period Mean (intersection) [Pg] |
Benchmark Period Mean (complement) [Pg] |
Bias [kg m-2] |
Bias Score [1] |
Spatial Distribution Score [1] |
Overall Score [1] |
|||
|---|---|---|---|---|---|---|---|---|---|---|---|---|
| Benchmark | [-] | 8.04 | ||||||||||
| CLM4 | [-] | 5.11 | 5.13 | 0.0220 | 7.99 | 0.0515 | -0.613 | 0.56 | 0.50 | 0.53 | ||
| CLM4.5 | [-] | 3.42 | 3.43 | 0.0314 | 7.99 | 0.0515 | -1.03 | 0.49 | 0.32 | 0.41 | ||
| CLM5 | [-] | 3.49 | 3.46 | 0.0449 | 7.99 | 0.0515 | -0.996 | 0.52 | 0.65 | 0.59 |
Download Data |
Period Mean (original grids) [Pg] |
Model Period Mean (intersection) [Pg] |
Model Period Mean (complement) [Pg] |
Benchmark Period Mean (intersection) [Pg] |
Benchmark Period Mean (complement) [Pg] |
Bias [kg m-2] |
Bias Score [1] |
Spatial Distribution Score [1] |
Overall Score [1] |
|||
|---|---|---|---|---|---|---|---|---|---|---|---|---|
| Benchmark | [-] | 88.9 | ||||||||||
| CLM4 | [-] | 209. | 208. | 0.419 | 88.8 | 0.0655 | 14.5 | 0.34 | 0.44 | 0.39 | ||
| CLM4.5 | [-] | 181. | 180. | 0.460 | 88.8 | 0.0655 | 11.3 | 0.39 | 0.62 | 0.50 | ||
| CLM5 | [-] | 152. | 151. | 0.431 | 88.8 | 0.0655 | 7.77 | 0.55 | 0.89 | 0.72 |
Download Data |
Period Mean (original grids) [Pg] |
Model Period Mean (intersection) [Pg] |
Model Period Mean (complement) [Pg] |
Benchmark Period Mean (intersection) [Pg] |
Benchmark Period Mean (complement) [Pg] |
Bias [kg m-2] |
Bias Score [1] |
Spatial Distribution Score [1] |
Overall Score [1] |
|||
|---|---|---|---|---|---|---|---|---|---|---|---|---|
| Benchmark | [-] | 9.09 | ||||||||||
| CLM4 | [-] | 20.1 | 20.3 | 0.120 | 9.08 | 0.0128 | 1.88 | 0.37 | 0.19 | 0.28 | ||
| CLM4.5 | [-] | 15.5 | 15.4 | 0.195 | 9.08 | 0.0128 | 1.15 | 0.45 | 0.22 | 0.33 | ||
| CLM5 | [-] | 21.7 | 21.8 | 0.315 | 9.08 | 0.0128 | 2.16 | 0.42 | 0.39 | 0.40 |
Download Data |
Period Mean (original grids) [Pg] |
Model Period Mean (intersection) [Pg] |
Model Period Mean (complement) [Pg] |
Benchmark Period Mean (intersection) [Pg] |
Benchmark Period Mean (complement) [Pg] |
Bias [kg m-2] |
Bias Score [1] |
Spatial Distribution Score [1] |
Overall Score [1] |
|||
|---|---|---|---|---|---|---|---|---|---|---|---|---|
| Benchmark | [-] | 2.45 | ||||||||||
| CLM4 | [-] | 3.86 | 4.09 | 0.0909 | 2.40 | 0.0496 | 1.09 | 0.40 | 0.29 | 0.35 | ||
| CLM4.5 | [-] | 4.36 | 4.42 | 0.0958 | 2.40 | 0.0496 | 1.27 | 0.37 | 0.29 | 0.33 | ||
| CLM5 | [-] | 5.25 | 5.16 | 0.145 | 2.40 | 0.0496 | 1.70 | 0.37 | 0.29 | 0.33 |
Temporally integrated period mean