Mean State
Download Data |
Period Mean (original grids) [Pg yr-1] |
Model Period Mean (intersection) [Pg yr-1] |
Model Period Mean (complement) [Pg yr-1] |
Benchmark Period Mean (intersection) [Pg yr-1] |
Benchmark Period Mean (complement) [Pg yr-1] |
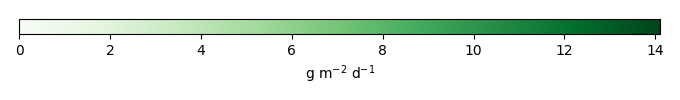
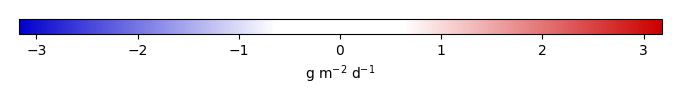
Bias [g m-2 d-1] |
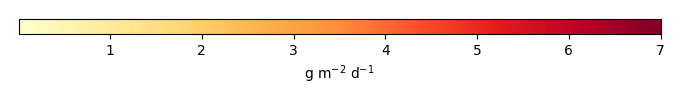
RMSE [g m-2 d-1] |
Phase Shift [months] |
Bias Score [1] |
RMSE Score [1] |
Seasonal Cycle Score [1] |
Spatial Distribution Score [1] |
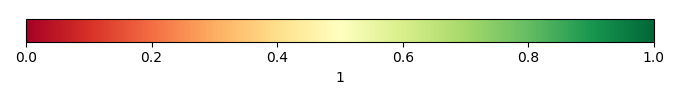
Overall Score [1] |
|||
|---|---|---|---|---|---|---|---|---|---|---|---|---|---|---|---|---|
| Benchmark | [-] | 8.19 | ||||||||||||||
| CLM4 | [-] | 11.0 | 11.2 | 0.204 | 8.18 | 0.00755 | 2.05 | 3.23 | 2.40 | 0.11 | 0.11 | 0.53 | 0.75 | 0.32 | ||
| CLM4.5 | [-] | 8.74 | 8.77 | 0.229 | 8.18 | 0.00755 | 0.534 | 2.18 | 2.49 | 0.16 | 0.24 | 0.54 | 0.87 | 0.41 | ||
| CLM5 | [-] | 7.22 | 7.30 | 0.207 | 8.18 | 0.00755 | -0.403 | 1.71 | 2.07 | 0.32 | 0.27 | 0.59 | 0.98 | 0.48 |
Download Data |
Period Mean (original grids) [Pg yr-1] |
Model Period Mean (intersection) [Pg yr-1] |
Model Period Mean (complement) [Pg yr-1] |
Benchmark Period Mean (intersection) [Pg yr-1] |
Benchmark Period Mean (complement) [Pg yr-1] |
Bias [g m-2 d-1] |
RMSE [g m-2 d-1] |
Phase Shift [months] |
Bias Score [1] |
RMSE Score [1] |
Seasonal Cycle Score [1] |
Spatial Distribution Score [1] |
Overall Score [1] |
|||
|---|---|---|---|---|---|---|---|---|---|---|---|---|---|---|---|---|
| Benchmark | [-] | 5.55 | ||||||||||||||
| CLM4 | [-] | 5.90 | 5.49 | 0.0139 | 5.55 | 0.00508 | -0.0216 | 1.26 | 0.948 | 0.64 | 0.48 | 0.87 | 0.94 | 0.68 | ||
| CLM4.5 | [-] | 3.56 | 3.31 | 0.0120 | 5.55 | 0.00508 | -0.897 | 1.60 | 1.10 | 0.46 | 0.48 | 0.81 | 0.77 | 0.60 | ||
| CLM5 | [-] | 5.26 | 4.98 | 0.0202 | 5.55 | 0.00508 | -0.213 | 1.75 | 1.18 | 0.59 | 0.41 | 0.82 | 0.89 | 0.62 |
Download Data |
Period Mean (original grids) [Pg yr-1] |
Model Period Mean (intersection) [Pg yr-1] |
Model Period Mean (complement) [Pg yr-1] |
Benchmark Period Mean (intersection) [Pg yr-1] |
Benchmark Period Mean (complement) [Pg yr-1] |
Bias [g m-2 d-1] |
RMSE [g m-2 d-1] |
Phase Shift [months] |
Bias Score [1] |
RMSE Score [1] |
Seasonal Cycle Score [1] |
Spatial Distribution Score [1] |
Overall Score [1] |
|||
|---|---|---|---|---|---|---|---|---|---|---|---|---|---|---|---|---|
| Benchmark | [-] | 9.94 | ||||||||||||||
| CLM4 | [-] | 7.41 | 7.05 | 0.270 | 9.92 | 0.0215 | -0.780 | 1.85 | 1.36 | 0.38 | 0.44 | 0.77 | 0.88 | 0.58 | ||
| CLM4.5 | [-] | 6.13 | 5.75 | 0.314 | 9.92 | 0.0215 | -1.13 | 1.95 | 1.48 | 0.34 | 0.45 | 0.75 | 0.92 | 0.58 | ||
| CLM5 | [-] | 8.89 | 8.42 | 0.383 | 9.92 | 0.0215 | -0.301 | 1.99 | 1.07 | 0.46 | 0.35 | 0.88 | 0.90 | 0.59 |
Download Data |
Period Mean (original grids) [Pg yr-1] |
Model Period Mean (intersection) [Pg yr-1] |
Model Period Mean (complement) [Pg yr-1] |
Benchmark Period Mean (intersection) [Pg yr-1] |
Benchmark Period Mean (complement) [Pg yr-1] |
Bias [g m-2 d-1] |
RMSE [g m-2 d-1] |
Phase Shift [months] |
Bias Score [1] |
RMSE Score [1] |
Seasonal Cycle Score [1] |
Spatial Distribution Score [1] |
Overall Score [1] |
|||
|---|---|---|---|---|---|---|---|---|---|---|---|---|---|---|---|---|
| Benchmark | [-] | 1.03 | ||||||||||||||
| CLM4 | [-] | 0.311 | 0.293 | 0.0237 | 1.03 | 0.00296 | -0.597 | 1.24 | 0.990 | 0.59 | 0.45 | 0.89 | 0.79 | 0.63 | ||
| CLM4.5 | [-] | 1.12 | 1.09 | 0.0358 | 1.03 | 0.00296 | 0.119 | 1.20 | 0.193 | 0.68 | 0.50 | 0.98 | 0.75 | 0.68 | ||
| CLM5 | [-] | 1.63 | 1.58 | 0.0533 | 1.03 | 0.00296 | 0.571 | 2.18 | 0.311 | 0.53 | 0.31 | 0.97 | 0.51 | 0.52 |
Download Data |
Period Mean (original grids) [Pg yr-1] |
Model Period Mean (intersection) [Pg yr-1] |
Model Period Mean (complement) [Pg yr-1] |
Benchmark Period Mean (intersection) [Pg yr-1] |
Benchmark Period Mean (complement) [Pg yr-1] |
Bias [g m-2 d-1] |
RMSE [g m-2 d-1] |
Phase Shift [months] |
Bias Score [1] |
RMSE Score [1] |
Seasonal Cycle Score [1] |
Spatial Distribution Score [1] |
Overall Score [1] |
|||
|---|---|---|---|---|---|---|---|---|---|---|---|---|---|---|---|---|
| Benchmark | [-] | 7.13 | ||||||||||||||
| CLM4 | [-] | 12.5 | 10.7 | 1.69 | 6.94 | 0.197 | 6.67 | 6.92 | 2.05 | 0.0080 | 0.11 | 0.72 | 0.98 | 0.39 | ||
| CLM4.5 | [-] | 9.60 | 8.10 | 1.45 | 6.94 | 0.197 | 3.71 | 3.96 | 1.83 | 0.028 | 0.21 | 0.76 | 0.78 | 0.40 | ||
| CLM5 | [-] | 7.05 | 5.92 | 1.09 | 6.94 | 0.197 | 0.910 | 2.10 | 1.59 | 0.19 | 0.19 | 0.80 | 0.30 | 0.34 |
Download Data |
Period Mean (original grids) [Pg yr-1] |
Model Period Mean (intersection) [Pg yr-1] |
Model Period Mean (complement) [Pg yr-1] |
Benchmark Period Mean (intersection) [Pg yr-1] |
Benchmark Period Mean (complement) [Pg yr-1] |
Bias [g m-2 d-1] |
RMSE [g m-2 d-1] |
Phase Shift [months] |
Bias Score [1] |
RMSE Score [1] |
Seasonal Cycle Score [1] |
Spatial Distribution Score [1] |
Overall Score [1] |
|||
|---|---|---|---|---|---|---|---|---|---|---|---|---|---|---|---|---|
| Benchmark | [-] | 6.86 | ||||||||||||||
| CLM4 | [-] | 7.77 | 7.52 | 0.0792 | 6.85 | 0.00296 | 0.242 | 1.51 | 0.504 | 0.75 | 0.63 | 0.96 | 0.68 | 0.73 | ||
| CLM4.5 | [-] | 7.77 | 7.51 | 0.0812 | 6.85 | 0.00296 | 0.233 | 1.34 | 0.529 | 0.78 | 0.66 | 0.96 | 0.80 | 0.77 | ||
| CLM5 | [-] | 9.43 | 9.11 | 0.0917 | 6.85 | 0.00296 | 0.730 | 1.79 | 0.472 | 0.73 | 0.58 | 0.97 | 0.86 | 0.74 |
Download Data |
Period Mean (original grids) [Pg yr-1] |
Model Period Mean (intersection) [Pg yr-1] |
Model Period Mean (complement) [Pg yr-1] |
Benchmark Period Mean (intersection) [Pg yr-1] |
Benchmark Period Mean (complement) [Pg yr-1] |
Bias [g m-2 d-1] |
RMSE [g m-2 d-1] |
Phase Shift [months] |
Bias Score [1] |
RMSE Score [1] |
Seasonal Cycle Score [1] |
Spatial Distribution Score [1] |
Overall Score [1] |
|||
|---|---|---|---|---|---|---|---|---|---|---|---|---|---|---|---|---|
| Benchmark | [-] | 10.1 | ||||||||||||||
| CLM4 | [-] | 13.3 | 13.0 | 0.462 | 10.0 | 0.0375 | 0.575 | 1.43 | 0.818 | 0.52 | 0.53 | 0.97 | 0.74 | 0.66 | ||
| CLM4.5 | [-] | 11.4 | 11.1 | 0.409 | 10.0 | 0.0375 | 0.271 | 1.15 | 0.800 | 0.64 | 0.55 | 0.97 | 0.89 | 0.72 | ||
| CLM5 | [-] | 11.1 | 10.9 | 0.370 | 10.0 | 0.0375 | 0.232 | 1.29 | 1.07 | 0.76 | 0.52 | 0.93 | 0.97 | 0.74 |
Download Data |
Period Mean (original grids) [Pg yr-1] |
Model Period Mean (intersection) [Pg yr-1] |
Model Period Mean (complement) [Pg yr-1] |
Benchmark Period Mean (intersection) [Pg yr-1] |
Benchmark Period Mean (complement) [Pg yr-1] |
Bias [g m-2 d-1] |
RMSE [g m-2 d-1] |
Phase Shift [months] |
Bias Score [1] |
RMSE Score [1] |
Seasonal Cycle Score [1] |
Spatial Distribution Score [1] |
Overall Score [1] |
|||
|---|---|---|---|---|---|---|---|---|---|---|---|---|---|---|---|---|
| Benchmark | [-] | 8.37 | ||||||||||||||
| CLM4 | [-] | 10.7 | 9.90 | 0.551 | 8.32 | 0.0454 | 1.19 | 2.35 | 1.06 | 0.39 | 0.31 | 0.89 | 0.82 | 0.55 | ||
| CLM4.5 | [-] | 8.30 | 7.59 | 0.551 | 8.32 | 0.0454 | 0.234 | 2.07 | 1.08 | 0.44 | 0.37 | 0.89 | 0.90 | 0.59 | ||
| CLM5 | [-] | 7.42 | 6.79 | 0.513 | 8.32 | 0.0454 | -0.162 | 2.05 | 2.27 | 0.47 | 0.35 | 0.68 | 0.95 | 0.56 |
Download Data |
Period Mean (original grids) [Pg yr-1] |
Model Period Mean (intersection) [Pg yr-1] |
Model Period Mean (complement) [Pg yr-1] |
Benchmark Period Mean (intersection) [Pg yr-1] |
Benchmark Period Mean (complement) [Pg yr-1] |
Bias [g m-2 d-1] |
RMSE [g m-2 d-1] |
Phase Shift [months] |
Bias Score [1] |
RMSE Score [1] |
Seasonal Cycle Score [1] |
Spatial Distribution Score [1] |
Overall Score [1] |
|||
|---|---|---|---|---|---|---|---|---|---|---|---|---|---|---|---|---|
| Benchmark | [-] | 1.28 | ||||||||||||||
| CLM4 | [-] | 0.261 | 0.272 | 0.0144 | 1.28 | 0.00137 | -0.781 | 1.45 | 1.07 | 0.57 | 0.45 | 0.92 | 0.71 | 0.62 | ||
| CLM4.5 | [-] | 1.27 | 1.30 | 0.0217 | 1.28 | 0.00137 | 0.0423 | 1.07 | 0.457 | 0.77 | 0.57 | 0.97 | 0.85 | 0.74 | ||
| CLM5 | [-] | 2.30 | 2.33 | 0.0389 | 1.28 | 0.00137 | 0.886 | 2.61 | 0.189 | 0.55 | 0.28 | 0.99 | 0.68 | 0.56 |
Download Data |
Period Mean (original grids) [Pg yr-1] |
Model Period Mean (intersection) [Pg yr-1] |
Model Period Mean (complement) [Pg yr-1] |
Benchmark Period Mean (intersection) [Pg yr-1] |
Benchmark Period Mean (complement) [Pg yr-1] |
Bias [g m-2 d-1] |
RMSE [g m-2 d-1] |
Phase Shift [months] |
Bias Score [1] |
RMSE Score [1] |
Seasonal Cycle Score [1] |
Spatial Distribution Score [1] |
Overall Score [1] |
|||
|---|---|---|---|---|---|---|---|---|---|---|---|---|---|---|---|---|
| Benchmark | [-] | 3.53 | ||||||||||||||
| CLM4 | [-] | 3.15 | 2.72 | 0.400 | 3.49 | 0.0402 | -0.0920 | 0.727 | 1.58 | 0.50 | 0.43 | 0.87 | 0.86 | 0.62 | ||
| CLM4.5 | [-] | 3.47 | 3.02 | 0.423 | 3.49 | 0.0402 | 0.0255 | 0.878 | 1.49 | 0.53 | 0.36 | 0.87 | 0.92 | 0.61 | ||
| CLM5 | [-] | 5.05 | 4.50 | 0.517 | 3.49 | 0.0402 | 0.601 | 1.37 | 1.71 | 0.43 | 0.23 | 0.84 | 0.79 | 0.50 |
Download Data |
Period Mean (original grids) [Pg yr-1] |
Model Period Mean (intersection) [Pg yr-1] |
Model Period Mean (complement) [Pg yr-1] |
Benchmark Period Mean (intersection) [Pg yr-1] |
Benchmark Period Mean (complement) [Pg yr-1] |
Bias [g m-2 d-1] |
RMSE [g m-2 d-1] |
Phase Shift [months] |
Bias Score [1] |
RMSE Score [1] |
Seasonal Cycle Score [1] |
Spatial Distribution Score [1] |
Overall Score [1] |
|||
|---|---|---|---|---|---|---|---|---|---|---|---|---|---|---|---|---|
| Benchmark | [-] | 5.29 | ||||||||||||||
| CLM4 | [-] | 4.16 | 3.91 | 0.202 | 5.26 | 0.0312 | -0.374 | 1.87 | 0.438 | 0.67 | 0.52 | 0.97 | 0.94 | 0.73 | ||
| CLM4.5 | [-] | 5.15 | 4.85 | 0.229 | 5.26 | 0.0312 | 0.154 | 1.58 | 0.556 | 0.77 | 0.57 | 0.96 | 0.89 | 0.75 | ||
| CLM5 | [-] | 6.19 | 5.83 | 0.272 | 5.26 | 0.0312 | 0.738 | 2.21 | 0.322 | 0.73 | 0.50 | 0.98 | 0.90 | 0.72 |
Download Data |
Period Mean (original grids) [Pg yr-1] |
Model Period Mean (intersection) [Pg yr-1] |
Model Period Mean (complement) [Pg yr-1] |
Benchmark Period Mean (intersection) [Pg yr-1] |
Benchmark Period Mean (complement) [Pg yr-1] |
Bias [g m-2 d-1] |
RMSE [g m-2 d-1] |
Phase Shift [months] |
Bias Score [1] |
RMSE Score [1] |
Seasonal Cycle Score [1] |
Spatial Distribution Score [1] |
Overall Score [1] |
|||
|---|---|---|---|---|---|---|---|---|---|---|---|---|---|---|---|---|
| Benchmark | [-] | 119. | ||||||||||||||
| CLM4 | [-] | 141. | 135. | 5.82 | 118. | 0.802 | 0.594 | 1.86 | 1.27 | 0.36 | 0.35 | 0.79 | 0.78 | 0.53 | ||
| CLM4.5 | [-] | 122. | 116. | 5.96 | 118. | 0.802 | 0.177 | 1.54 | 1.23 | 0.43 | 0.39 | 0.79 | 0.93 | 0.59 | ||
| CLM5 | [-] | 128. | 122. | 5.76 | 118. | 0.802 | 0.298 | 1.74 | 1.22 | 0.46 | 0.37 | 0.81 | 0.95 | 0.59 |
Download Data |
Period Mean (original grids) [Pg yr-1] |
Model Period Mean (intersection) [Pg yr-1] |
Model Period Mean (complement) [Pg yr-1] |
Benchmark Period Mean (intersection) [Pg yr-1] |
Benchmark Period Mean (complement) [Pg yr-1] |
Bias [g m-2 d-1] |
RMSE [g m-2 d-1] |
Phase Shift [months] |
Bias Score [1] |
RMSE Score [1] |
Seasonal Cycle Score [1] |
Spatial Distribution Score [1] |
Overall Score [1] |
|||
|---|---|---|---|---|---|---|---|---|---|---|---|---|---|---|---|---|
| Benchmark | [-] | 0.864 | ||||||||||||||
| CLM4 | [-] | 0.937 | 0.893 | 0.0411 | 0.859 | 0.00579 | 0.0433 | 0.326 | 2.24 | 0.49 | 0.39 | 0.85 | 0.89 | 0.60 | ||
| CLM4.5 | [-] | 1.06 | 1.02 | 0.0519 | 0.859 | 0.00579 | 0.0935 | 0.402 | 2.25 | 0.48 | 0.35 | 0.84 | 0.87 | 0.58 | ||
| CLM5 | [-] | 1.65 | 1.59 | 0.0769 | 0.859 | 0.00579 | 0.294 | 0.742 | 2.32 | 0.43 | 0.20 | 0.86 | 0.84 | 0.51 |
Download Data |
Period Mean (original grids) [Pg yr-1] |
Model Period Mean (intersection) [Pg yr-1] |
Model Period Mean (complement) [Pg yr-1] |
Benchmark Period Mean (intersection) [Pg yr-1] |
Benchmark Period Mean (complement) [Pg yr-1] |
Bias [g m-2 d-1] |
RMSE [g m-2 d-1] |
Phase Shift [months] |
Bias Score [1] |
RMSE Score [1] |
Seasonal Cycle Score [1] |
Spatial Distribution Score [1] |
Overall Score [1] |
|||
|---|---|---|---|---|---|---|---|---|---|---|---|---|---|---|---|---|
| Benchmark | [-] | 1.56 | ||||||||||||||
| CLM4 | [-] | 1.40 | 1.34 | 0.0367 | 1.55 | 0.00323 | -0.0444 | 0.820 | 1.30 | 0.61 | 0.50 | 0.94 | 0.76 | 0.66 | ||
| CLM4.5 | [-] | 2.48 | 2.39 | 0.0631 | 1.55 | 0.00323 | 0.418 | 1.15 | 0.945 | 0.56 | 0.39 | 0.96 | 0.68 | 0.59 | ||
| CLM5 | [-] | 3.09 | 2.97 | 0.0897 | 1.55 | 0.00323 | 0.684 | 1.79 | 0.557 | 0.45 | 0.26 | 0.97 | 0.51 | 0.49 |
Download Data |
Period Mean (original grids) [Pg yr-1] |
Model Period Mean (intersection) [Pg yr-1] |
Model Period Mean (complement) [Pg yr-1] |
Benchmark Period Mean (intersection) [Pg yr-1] |
Benchmark Period Mean (complement) [Pg yr-1] |
Bias [g m-2 d-1] |
RMSE [g m-2 d-1] |
Phase Shift [months] |
Bias Score [1] |
RMSE Score [1] |
Seasonal Cycle Score [1] |
Spatial Distribution Score [1] |
Overall Score [1] |
|||
|---|---|---|---|---|---|---|---|---|---|---|---|---|---|---|---|---|
| Benchmark | [-] | 3.62 | ||||||||||||||
| CLM4 | [-] | 2.68 | 2.30 | 0.311 | 3.60 | 0.0267 | -0.607 | 2.18 | 1.12 | 0.24 | 0.34 | 0.85 | 0.89 | 0.53 | ||
| CLM4.5 | [-] | 3.58 | 3.04 | 0.453 | 3.60 | 0.0267 | 0.381 | 2.33 | 1.21 | 0.32 | 0.25 | 0.82 | 0.85 | 0.50 | ||
| CLM5 | [-] | 3.45 | 2.94 | 0.436 | 3.60 | 0.0267 | 0.219 | 1.97 | 1.46 | 0.40 | 0.32 | 0.79 | 0.93 | 0.55 |
Download Data |
Period Mean (original grids) [Pg yr-1] |
Model Period Mean (intersection) [Pg yr-1] |
Model Period Mean (complement) [Pg yr-1] |
Benchmark Period Mean (intersection) [Pg yr-1] |
Benchmark Period Mean (complement) [Pg yr-1] |
Bias [g m-2 d-1] |
RMSE [g m-2 d-1] |
Phase Shift [months] |
Bias Score [1] |
RMSE Score [1] |
Seasonal Cycle Score [1] |
Spatial Distribution Score [1] |
Overall Score [1] |
|||
|---|---|---|---|---|---|---|---|---|---|---|---|---|---|---|---|---|
| Benchmark | [-] | 5.09 | ||||||||||||||
| CLM4 | [-] | 6.72 | 6.43 | 0.203 | 5.09 | 0.00487 | 1.16 | 2.60 | 0.769 | 0.61 | 0.51 | 0.94 | 0.60 | 0.63 | ||
| CLM4.5 | [-] | 6.09 | 5.82 | 0.192 | 5.09 | 0.00487 | 0.728 | 2.17 | 0.800 | 0.70 | 0.53 | 0.93 | 0.79 | 0.70 | ||
| CLM5 | [-] | 5.46 | 5.20 | 0.159 | 5.09 | 0.00487 | 0.264 | 1.84 | 0.759 | 0.81 | 0.58 | 0.94 | 0.98 | 0.78 |
Download Data |
Period Mean (original grids) [Pg yr-1] |
Model Period Mean (intersection) [Pg yr-1] |
Model Period Mean (complement) [Pg yr-1] |
Benchmark Period Mean (intersection) [Pg yr-1] |
Benchmark Period Mean (complement) [Pg yr-1] |
Bias [g m-2 d-1] |
RMSE [g m-2 d-1] |
Phase Shift [months] |
Bias Score [1] |
RMSE Score [1] |
Seasonal Cycle Score [1] |
Spatial Distribution Score [1] |
Overall Score [1] |
|||
|---|---|---|---|---|---|---|---|---|---|---|---|---|---|---|---|---|
| Benchmark | [-] | 3.36 | ||||||||||||||
| CLM4 | [-] | 5.08 | 5.03 | 0.0803 | 3.34 | 0.0222 | 0.998 | 1.74 | 0.624 | 0.58 | 0.55 | 0.96 | 0.70 | 0.67 | ||
| CLM4.5 | [-] | 5.18 | 5.15 | 0.0732 | 3.34 | 0.0222 | 1.06 | 1.84 | 0.614 | 0.58 | 0.51 | 0.96 | 0.85 | 0.68 | ||
| CLM5 | [-] | 5.98 | 5.92 | 0.0889 | 3.34 | 0.0222 | 1.49 | 2.44 | 0.636 | 0.50 | 0.43 | 0.96 | 0.89 | 0.64 |
Download Data |
Period Mean (original grids) [Pg yr-1] |
Model Period Mean (intersection) [Pg yr-1] |
Model Period Mean (complement) [Pg yr-1] |
Benchmark Period Mean (intersection) [Pg yr-1] |
Benchmark Period Mean (complement) [Pg yr-1] |
Bias [g m-2 d-1] |
RMSE [g m-2 d-1] |
Phase Shift [months] |
Bias Score [1] |
RMSE Score [1] |
Seasonal Cycle Score [1] |
Spatial Distribution Score [1] |
Overall Score [1] |
|||
|---|---|---|---|---|---|---|---|---|---|---|---|---|---|---|---|---|
| Benchmark | [-] | 1.79 | ||||||||||||||
| CLM4 | [-] | 1.75 | 1.80 | 0.0156 | 1.79 | 0.00506 | 0.0632 | 0.821 | 0.867 | 0.63 | 0.53 | 0.93 | 0.93 | 0.71 | ||
| CLM4.5 | [-] | 1.43 | 1.48 | 0.0157 | 1.79 | 0.00506 | -0.163 | 0.845 | 0.902 | 0.64 | 0.50 | 0.92 | 0.92 | 0.70 | ||
| CLM5 | [-] | 1.58 | 1.65 | 0.0176 | 1.79 | 0.00506 | -0.0385 | 1.17 | 0.879 | 0.57 | 0.42 | 0.93 | 0.92 | 0.65 |
Download Data |
Period Mean (original grids) [Pg yr-1] |
Model Period Mean (intersection) [Pg yr-1] |
Model Period Mean (complement) [Pg yr-1] |
Benchmark Period Mean (intersection) [Pg yr-1] |
Benchmark Period Mean (complement) [Pg yr-1] |
Bias [g m-2 d-1] |
RMSE [g m-2 d-1] |
Phase Shift [months] |
Bias Score [1] |
RMSE Score [1] |
Seasonal Cycle Score [1] |
Spatial Distribution Score [1] |
Overall Score [1] |
|||
|---|---|---|---|---|---|---|---|---|---|---|---|---|---|---|---|---|
| Benchmark | [-] | 23.2 | ||||||||||||||
| CLM4 | [-] | 33.3 | 33.0 | 0.186 | 23.2 | 0.0226 | 3.41 | 4.33 | 2.90 | 0.062 | 0.11 | 0.51 | 0.61 | 0.28 | ||
| CLM4.5 | [-] | 25.1 | 24.8 | 0.195 | 23.2 | 0.0226 | 0.787 | 2.08 | 2.63 | 0.27 | 0.21 | 0.57 | 0.91 | 0.44 | ||
| CLM5 | [-] | 22.0 | 21.7 | 0.174 | 23.2 | 0.0226 | -0.268 | 1.83 | 2.24 | 0.18 | 0.26 | 0.65 | 0.90 | 0.45 |
Download Data |
Period Mean (original grids) [Pg yr-1] |
Model Period Mean (intersection) [Pg yr-1] |
Model Period Mean (complement) [Pg yr-1] |
Benchmark Period Mean (intersection) [Pg yr-1] |
Benchmark Period Mean (complement) [Pg yr-1] |
Bias [g m-2 d-1] |
RMSE [g m-2 d-1] |
Phase Shift [months] |
Bias Score [1] |
RMSE Score [1] |
Seasonal Cycle Score [1] |
Spatial Distribution Score [1] |
Overall Score [1] |
|||
|---|---|---|---|---|---|---|---|---|---|---|---|---|---|---|---|---|
| Benchmark | [-] | 10.4 | ||||||||||||||
| CLM4 | [-] | 11.4 | 11.3 | 0.300 | 10.4 | 0.00314 | 0.482 | 2.85 | 0.984 | 0.35 | 0.40 | 0.88 | 0.49 | 0.51 | ||
| CLM4.5 | [-] | 8.80 | 8.54 | 0.354 | 10.4 | 0.00314 | -0.662 | 2.34 | 1.14 | 0.42 | 0.43 | 0.86 | 0.72 | 0.57 | ||
| CLM5 | [-] | 10.8 | 10.7 | 0.343 | 10.4 | 0.00314 | 0.227 | 2.30 | 1.00 | 0.49 | 0.41 | 0.91 | 0.79 | 0.60 |
Download Data |
Period Mean (original grids) [Pg yr-1] |
Model Period Mean (intersection) [Pg yr-1] |
Model Period Mean (complement) [Pg yr-1] |
Benchmark Period Mean (intersection) [Pg yr-1] |
Benchmark Period Mean (complement) [Pg yr-1] |
Bias [g m-2 d-1] |
RMSE [g m-2 d-1] |
Phase Shift [months] |
Bias Score [1] |
RMSE Score [1] |
Seasonal Cycle Score [1] |
Spatial Distribution Score [1] |
Overall Score [1] |
|||
|---|---|---|---|---|---|---|---|---|---|---|---|---|---|---|---|---|
| Benchmark | [-] | 1.16 | ||||||||||||||
| CLM4 | [-] | 0.991 | 0.965 | 0.0382 | 1.14 | 0.0148 | 0.0394 | 0.815 | 1.25 | 0.39 | 0.38 | 0.90 | 0.87 | 0.58 | ||
| CLM4.5 | [-] | 1.02 | 0.966 | 0.0415 | 1.14 | 0.0148 | 0.0209 | 0.827 | 1.50 | 0.40 | 0.40 | 0.89 | 0.91 | 0.60 | ||
| CLM5 | [-] | 1.36 | 1.25 | 0.0673 | 1.14 | 0.0148 | 0.343 | 1.19 | 1.36 | 0.40 | 0.31 | 0.91 | 0.90 | 0.57 |
Temporally integrated period mean