Mean State
Download Data |
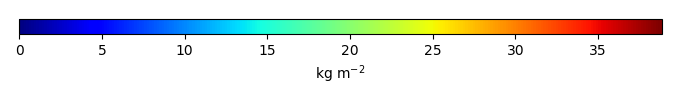
Period Mean (original grids) [Pg] |
Model Period Mean (intersection) [Pg] |
Model Period Mean (complement) [Pg] |
Benchmark Period Mean (intersection) [Pg] |
Benchmark Period Mean (complement) [Pg] |
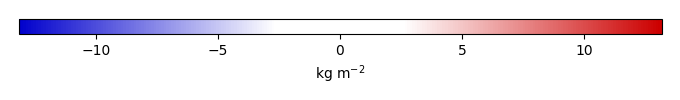
Bias [kg m-2] |
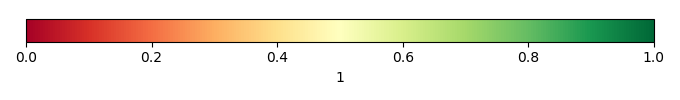
Bias Score [1] |
Spatial Distribution Score [1] |
Overall Score [1] |
|||
|---|---|---|---|---|---|---|---|---|---|---|---|---|
| Benchmark | [-] | 26.2 | ||||||||||
| CLM4 | [-] | 582. | 21.9 | 560. | 26.1 | 0.0878 | -0.299 | 0.634 | 0.853 | 0.743 | ||
| CLM4.5 | [-] | 560. | 24.1 | 536. | 26.1 | 0.0878 | 0.0184 | 0.615 | 0.873 | 0.744 | ||
| CLM5 | [-] | 589. | 21.7 | 567. | 26.1 | 0.0878 | -0.243 | 0.616 | 0.874 | 0.745 |
Download Data |
Period Mean (original grids) [Pg] |
Model Period Mean (intersection) [Pg] |
Model Period Mean (complement) [Pg] |
Benchmark Period Mean (intersection) [Pg] |
Benchmark Period Mean (complement) [Pg] |
Bias [kg m-2] |
Bias Score [1] |
Spatial Distribution Score [1] |
Overall Score [1] |
|||
|---|---|---|---|---|---|---|---|---|---|---|---|---|
| Benchmark | [-] | 0.00338 | ||||||||||
| CLM4 | [-] | 5.39 | 0.00986 | 5.08 | 0.00338 | 0.0933 | 0.616 | 0.679 | 0.647 | |||
| CLM4.5 | [-] | 11.4 | 0.0180 | 11.1 | 0.00338 | 0.232 | 0.361 | 0.296 | 0.328 | |||
| CLM5 | [-] | 11.9 | 0.0255 | 11.6 | 0.00338 | 0.302 | 0.360 | 0.401 | 0.380 |
Download Data |
Period Mean (original grids) [Pg] |
Model Period Mean (intersection) [Pg] |
Model Period Mean (complement) [Pg] |
Benchmark Period Mean (intersection) [Pg] |
Benchmark Period Mean (complement) [Pg] |
Bias [kg m-2] |
Bias Score [1] |
Spatial Distribution Score [1] |
Overall Score [1] |
|||
|---|---|---|---|---|---|---|---|---|---|---|---|---|
| Benchmark | [-] | 17.5 | ||||||||||
| CLM4 | [-] | 16.4 | 16.0 | 0.266 | 17.4 | 0.0333 | -0.0421 | 0.666 | 0.908 | 0.787 | ||
| CLM4.5 | [-] | 20.4 | 19.9 | 0.326 | 17.4 | 0.0333 | 0.973 | 0.680 | 0.896 | 0.788 | ||
| CLM5 | [-] | 17.8 | 17.4 | 0.303 | 17.4 | 0.0333 | 0.386 | 0.671 | 0.907 | 0.789 |
Download Data |
Period Mean (original grids) [Pg] |
Model Period Mean (intersection) [Pg] |
Model Period Mean (complement) [Pg] |
Benchmark Period Mean (intersection) [Pg] |
Benchmark Period Mean (complement) [Pg] |
Bias [kg m-2] |
Bias Score [1] |
Spatial Distribution Score [1] |
Overall Score [1] |
|||
|---|---|---|---|---|---|---|---|---|---|---|---|---|
| Benchmark | [-] | 0.222 | ||||||||||
| CLM4 | [-] | 25.1 | 0.735 | 24.5 | 0.222 | 6.06 | 0.353 | 0.395 | 0.374 | |||
| CLM4.5 | [-] | 34.8 | 0.804 | 34.2 | 0.222 | 6.81 | 0.333 | 0.460 | 0.396 | |||
| CLM5 | [-] | 56.8 | 0.907 | 56.1 | 0.222 | 8.04 | 0.289 | 0.391 | 0.340 |
Download Data |
Period Mean (original grids) [Pg] |
Model Period Mean (intersection) [Pg] |
Model Period Mean (complement) [Pg] |
Benchmark Period Mean (intersection) [Pg] |
Benchmark Period Mean (complement) [Pg] |
Bias [kg m-2] |
Bias Score [1] |
Spatial Distribution Score [1] |
Overall Score [1] |
|||
|---|---|---|---|---|---|---|---|---|---|---|---|---|
| Benchmark | [-] | 8.47 | ||||||||||
| CLM4 | [-] | 5.11 | 5.12 | 0.0325 | 8.42 | 0.0520 | -0.736 | 0.573 | 0.571 | 0.572 | ||
| CLM4.5 | [-] | 3.42 | 3.42 | 0.0387 | 8.42 | 0.0520 | -1.16 | 0.489 | 0.369 | 0.429 | ||
| CLM5 | [-] | 3.49 | 3.46 | 0.0505 | 8.42 | 0.0520 | -1.12 | 0.507 | 0.698 | 0.603 |
Temporally integrated period mean