Mean State
Download Data |
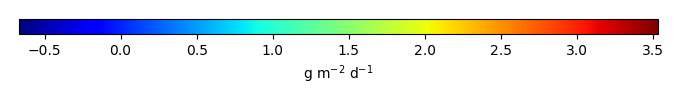
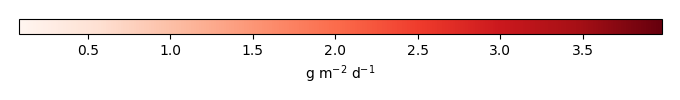
Period Mean (original grids) [g m-2 d-1] |
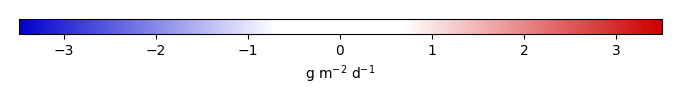
Bias [g m-2 d-1] |
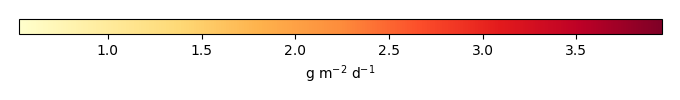
RMSE [g m-2 d-1] |
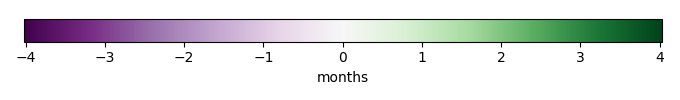
Phase Shift [months] |
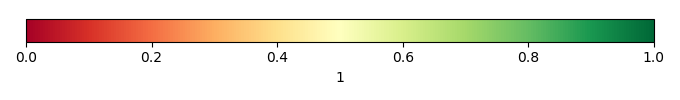
Bias Score [1] |
RMSE Score [1] |
Seasonal Cycle Score [1] |
Interannual Variability Score [1] |
Overall Score [1] |
|||
|---|---|---|---|---|---|---|---|---|---|---|---|---|
| Benchmark | [-] | -0.106 | ||||||||||
| CLM4 | [-] | 0.0325 | 0.138 | 0.804 | 0.492 | 0.630 | 0.318 | 0.919 | 0.607 | 0.558 | ||
| CLM4.5 | [-] | 0.0466 | 0.152 | 0.881 | 1.47 | 0.622 | 0.310 | 0.715 | 0.655 | 0.522 | ||
| CLM5 | [-] | 0.103 | 0.208 | 0.901 | 3.51 | 0.557 | 0.342 | 0.188 | 0.433 | 0.372 |
Download Data |
Period Mean (original grids) [g m-2 d-1] |
Bias [g m-2 d-1] |
RMSE [g m-2 d-1] |
Phase Shift [months] |
Bias Score [1] |
RMSE Score [1] |
Seasonal Cycle Score [1] |
Interannual Variability Score [1] |
Overall Score [1] |
|||
|---|---|---|---|---|---|---|---|---|---|---|---|---|
| Benchmark | [-] | 0.443 | ||||||||||
| CLM4 | [-] | 0.000969 | -0.442 | 1.10 | 0.00 | 0.646 | 0.370 | 1.00 | 0.371 | 0.552 | ||
| CLM4.5 | [-] | -0.00313 | -0.446 | 0.975 | 0.00 | 0.643 | 0.431 | 1.00 | 0.821 | 0.665 | ||
| CLM5 | [-] | 0.000830 | -0.442 | 1.70 | 0.00 | 0.646 | 0.183 | 1.00 | 0.703 | 0.543 |
Download Data |
Period Mean (original grids) [g m-2 d-1] |
Bias [g m-2 d-1] |
RMSE [g m-2 d-1] |
Phase Shift [months] |
Bias Score [1] |
RMSE Score [1] |
Seasonal Cycle Score [1] |
Interannual Variability Score [1] |
Overall Score [1] |
|||
|---|---|---|---|---|---|---|---|---|---|---|---|---|
| Benchmark | [-] | -1.15 | ||||||||||
| CLM4 | [-] | 0.184 | 1.33 | 1.91 | 1.02 | 0.377 | 0.370 | 0.933 | 0.425 | 0.495 | ||
| CLM4.5 | [-] | 0.351 | 1.50 | 2.10 | 6.05 | 0.334 | 0.353 | 7.41e-05 | 0.427 | 0.293 | ||
| CLM5 | [-] | 0.306 | 1.45 | 2.06 | 2.00 | 0.345 | 0.349 | 0.756 | 0.468 | 0.453 |
Download Data |
Period Mean (original grids) [g m-2 d-1] |
Bias [g m-2 d-1] |
RMSE [g m-2 d-1] |
Phase Shift [months] |
Bias Score [1] |
RMSE Score [1] |
Seasonal Cycle Score [1] |
Interannual Variability Score [1] |
Overall Score [1] |
|||
|---|---|---|---|---|---|---|---|---|---|---|---|---|
| Benchmark | [-] | 0.546 | ||||||||||
| CLM4 | [-] | 0.0326 | -0.514 | 0.822 | 0.00 | 0.550 | 0.495 | 1.00 | 0.742 | 0.656 | ||
| CLM4.5 | [-] | 0.0710 | -0.475 | 0.682 | 0.00 | 0.576 | 0.525 | 1.00 | 0.761 | 0.678 | ||
| CLM5 | [-] | 0.138 | -0.408 | 1.06 | 0.508 | 0.625 | 0.365 | 0.958 | 0.742 | 0.611 |
Download Data |
Period Mean (original grids) [g m-2 d-1] |
Bias [g m-2 d-1] |
RMSE [g m-2 d-1] |
Phase Shift [months] |
Bias Score [1] |
RMSE Score [1] |
Seasonal Cycle Score [1] |
Interannual Variability Score [1] |
Overall Score [1] |
|||
|---|---|---|---|---|---|---|---|---|---|---|---|---|
| Benchmark | [-] | 0.988 | ||||||||||
| CLM4 | [-] | 0.106 | -0.882 | 1.42 | 1.49 | 0.501 | 0.431 | 0.838 | 0.733 | 0.587 | ||
| CLM4.5 | [-] | 0.0891 | -0.899 | 2.02 | 1.49 | 0.495 | 0.273 | 0.730 | 0.508 | 0.456 | ||
| CLM5 | [-] | 0.161 | -0.827 | 1.35 | 3.02 | 0.523 | 0.439 | 0.454 | 0.644 | 0.500 |
Download Data |
Period Mean (original grids) [g m-2 d-1] |
Bias [g m-2 d-1] |
RMSE [g m-2 d-1] |
Phase Shift [months] |
Bias Score [1] |
RMSE Score [1] |
Seasonal Cycle Score [1] |
Interannual Variability Score [1] |
Overall Score [1] |
|||
|---|---|---|---|---|---|---|---|---|---|---|---|---|
| Benchmark | [-] | 0.812 | ||||||||||
| CLM4 | [-] | 0.0478 | -0.764 | 1.80 | 0.762 | 0.517 | 0.406 | 0.924 | 0.628 | 0.576 | ||
| CLM4.5 | [-] | 0.0932 | -0.719 | 1.71 | 0.684 | 0.532 | 0.449 | 0.944 | 0.705 | 0.616 | ||
| CLM5 | [-] | 0.317 | -0.495 | 1.69 | 0.665 | 0.596 | 0.454 | 0.947 | 0.778 | 0.646 |
Download Data |
Period Mean (original grids) [g m-2 d-1] |
Bias [g m-2 d-1] |
RMSE [g m-2 d-1] |
Phase Shift [months] |
Bias Score [1] |
RMSE Score [1] |
Seasonal Cycle Score [1] |
Interannual Variability Score [1] |
Overall Score [1] |
|||
|---|---|---|---|---|---|---|---|---|---|---|---|---|
| Benchmark | [-] | 0.648 | ||||||||||
| CLM4 | [-] | 0.0797 | -0.568 | 1.72 | 0.898 | 0.508 | 0.418 | 0.939 | 0.661 | 0.589 | ||
| CLM4.5 | [-] | 0.110 | -0.538 | 1.65 | 0.838 | 0.521 | 0.455 | 0.962 | 0.716 | 0.622 | ||
| CLM5 | [-] | 0.260 | -0.388 | 1.59 | 0.927 | 0.572 | 0.460 | 0.933 | 0.776 | 0.640 |
Download Data |
Period Mean (original grids) [g m-2 d-1] |
Bias [g m-2 d-1] |
RMSE [g m-2 d-1] |
Phase Shift [months] |
Bias Score [1] |
RMSE Score [1] |
Seasonal Cycle Score [1] |
Interannual Variability Score [1] |
Overall Score [1] |
|||
|---|---|---|---|---|---|---|---|---|---|---|---|---|
| Benchmark | [-] | 0.587 | ||||||||||
| CLM4 | [-] | 0.00866 | -0.578 | 1.07 | 1.02 | 0.537 | 0.381 | 0.933 | 0.413 | 0.529 | ||
| CLM4.5 | [-] | 0.00529 | -0.582 | 0.873 | 0.00 | 0.535 | 0.495 | 1.00 | 0.612 | 0.627 | ||
| CLM5 | [-] | 0.0491 | -0.538 | 1.01 | 1.02 | 0.561 | 0.392 | 0.933 | 0.780 | 0.611 |
Download Data |
Period Mean (original grids) [g m-2 d-1] |
Bias [g m-2 d-1] |
RMSE [g m-2 d-1] |
Phase Shift [months] |
Bias Score [1] |
RMSE Score [1] |
Seasonal Cycle Score [1] |
Interannual Variability Score [1] |
Overall Score [1] |
|||
|---|---|---|---|---|---|---|---|---|---|---|---|---|
| Benchmark | [-] | 0.841 | ||||||||||
| CLM4 | [-] | 0.161 | -0.679 | 2.21 | 1.02 | 0.489 | 0.417 | 0.968 | 0.681 | 0.595 | ||
| CLM4.5 | [-] | 0.168 | -0.673 | 2.04 | 0.971 | 0.499 | 0.438 | 0.972 | 0.698 | 0.609 | ||
| CLM5 | [-] | 0.332 | -0.508 | 1.93 | 1.16 | 0.538 | 0.456 | 0.926 | 0.715 | 0.618 |
Download Data |
Period Mean (original grids) [g m-2 d-1] |
Bias [g m-2 d-1] |
RMSE [g m-2 d-1] |
Phase Shift [months] |
Bias Score [1] |
RMSE Score [1] |
Seasonal Cycle Score [1] |
Interannual Variability Score [1] |
Overall Score [1] |
|||
|---|---|---|---|---|---|---|---|---|---|---|---|---|
| Benchmark | [-] | -0.0705 | ||||||||||
| CLM4 | [-] | 0.0804 | 0.151 | 1.26 | 0.939 | -0.112 | -0.312 | 0.609 | -0.215 | -0.0686 | ||
| CLM4.5 | [-] | 0.113 | 0.184 | 1.32 | 0.794 | -0.204 | -0.438 | 0.675 | -0.428 | -0.167 | ||
| CLM5 | [-] | 0.0753 | 0.146 | 1.07 | 0.576 | -0.0268 | -0.342 | 0.618 | -0.373 | -0.0932 |
Download Data |
Period Mean (original grids) [g m-2 d-1] |
Bias [g m-2 d-1] |
RMSE [g m-2 d-1] |
Phase Shift [months] |
Bias Score [1] |
RMSE Score [1] |
Seasonal Cycle Score [1] |
Interannual Variability Score [1] |
Overall Score [1] |
|||
|---|---|---|---|---|---|---|---|---|---|---|---|---|
| Benchmark | [-] | 0.656 | ||||||||||
| CLM4 | [-] | 0.0696 | -0.586 | 1.36 | 1.70 | 0.257 | 0.354 | 0.964 | 0.730 | 0.532 | ||
| CLM4.5 | [-] | 0.0591 | -0.597 | 1.35 | 1.02 | 0.250 | 0.378 | 0.858 | 0.655 | 0.504 | ||
| CLM5 | [-] | 0.181 | -0.475 | 1.49 | 1.53 | 0.282 | 0.391 | 0.916 | 0.819 | 0.560 |
Download Data |
Period Mean (original grids) [g m-2 d-1] |
Bias [g m-2 d-1] |
RMSE [g m-2 d-1] |
Phase Shift [months] |
Bias Score [1] |
RMSE Score [1] |
Seasonal Cycle Score [1] |
Interannual Variability Score [1] |
Overall Score [1] |
|||
|---|---|---|---|---|---|---|---|---|---|---|---|---|
| Benchmark | [-] | 1.07 | ||||||||||
| CLM4 | [-] | 0.325 | -0.750 | 1.30 | 2.03 | 0.498 | 0.353 | 0.749 | 0.497 | 0.490 | ||
| CLM4.5 | [-] | 0.276 | -0.798 | 1.24 | 1.02 | 0.476 | 0.418 | 0.933 | 0.550 | 0.559 | ||
| CLM5 | [-] | 0.230 | -0.844 | 1.35 | 2.03 | 0.456 | 0.373 | 0.749 | 0.434 | 0.477 |
Temporally integrated period mean