Mean State
Download Data |
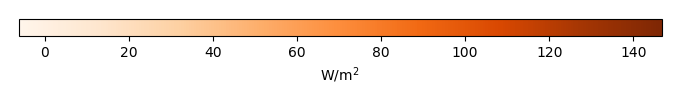
Period Mean (original grids) [W/m2] |
Model Period Mean (intersection) [W/m2] |
Model Period Mean (complement) [W/m2] |
Benchmark Period Mean (intersection) [W/m2] |
Benchmark Period Mean (complement) [W/m2] |
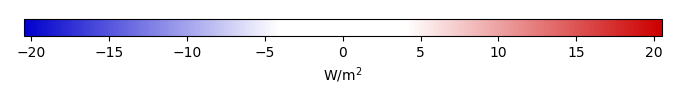
Bias [W/m2] |
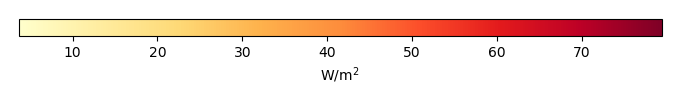
RMSE [W/m2] |
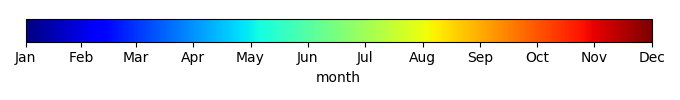
Phase Shift [months] |
Bias Score [1] |
RMSE Score [1] |
Seasonal Cycle Score [1] |
Spatial Distribution Score [1] |
Overall Score [1] |
|||
|---|---|---|---|---|---|---|---|---|---|---|---|---|---|---|---|---|
| Benchmark | [-] | 70.6 | ||||||||||||||
| CLM4 | [-] | 94.5 | 95.5 | 83.3 | 70.7 | 18.1 | 24.1 | 35.2 | 1.83 | 0.119 | 0.0701 | 0.688 | 0.882 | 0.366 | ||
| CLM4.5 | [-] | 83.4 | 84.1 | 75.8 | 70.7 | 18.1 | 12.9 | 24.6 | 1.16 | 0.196 | 0.111 | 0.861 | 0.961 | 0.448 | ||
| CLM5 | [-] | 83.0 | 83.7 | 73.3 | 70.7 | 18.1 | 12.5 | 23.9 | 2.41 | 0.209 | 0.113 | 0.532 | 0.947 | 0.383 |
Download Data |
Period Mean (original grids) [W/m2] |
Model Period Mean (intersection) [W/m2] |
Model Period Mean (complement) [W/m2] |
Benchmark Period Mean (intersection) [W/m2] |
Benchmark Period Mean (complement) [W/m2] |
Bias [W/m2] |
RMSE [W/m2] |
Phase Shift [months] |
Bias Score [1] |
RMSE Score [1] |
Seasonal Cycle Score [1] |
Spatial Distribution Score [1] |
Overall Score [1] |
|||
|---|---|---|---|---|---|---|---|---|---|---|---|---|---|---|---|---|
| Benchmark | [-] | 47.3 | ||||||||||||||
| CLM4 | [-] | 56.6 | 55.6 | 44.5 | 47.3 | 34.2 | 8.05 | 24.4 | 1.06 | 0.652 | 0.435 | 0.808 | 0.945 | 0.655 | ||
| CLM4.5 | [-] | 51.4 | 50.5 | 35.1 | 47.3 | 34.2 | 3.00 | 21.9 | 1.01 | 0.756 | 0.465 | 0.832 | 0.991 | 0.702 | ||
| CLM5 | [-] | 48.4 | 47.6 | 37.9 | 47.3 | 34.2 | 0.0734 | 21.1 | 1.02 | 0.739 | 0.477 | 0.825 | 0.987 | 0.701 |
Download Data |
Period Mean (original grids) [W/m2] |
Model Period Mean (intersection) [W/m2] |
Model Period Mean (complement) [W/m2] |
Benchmark Period Mean (intersection) [W/m2] |
Benchmark Period Mean (complement) [W/m2] |
Bias [W/m2] |
RMSE [W/m2] |
Phase Shift [months] |
Bias Score [1] |
RMSE Score [1] |
Seasonal Cycle Score [1] |
Spatial Distribution Score [1] |
Overall Score [1] |
|||
|---|---|---|---|---|---|---|---|---|---|---|---|---|---|---|---|---|
| Benchmark | [-] | 52.1 | ||||||||||||||
| CLM4 | [-] | 60.7 | 60.2 | 67.9 | 52.2 | 23.6 | 8.06 | 24.4 | 0.958 | 0.571 | 0.403 | 0.879 | 0.911 | 0.633 | ||
| CLM4.5 | [-] | 54.7 | 54.2 | 63.5 | 52.2 | 23.6 | 2.25 | 21.8 | 0.955 | 0.655 | 0.426 | 0.878 | 0.972 | 0.671 | ||
| CLM5 | [-] | 55.2 | 54.8 | 60.8 | 52.2 | 23.6 | 2.70 | 21.3 | 0.967 | 0.606 | 0.453 | 0.874 | 0.942 | 0.666 |
Download Data |
Period Mean (original grids) [W/m2] |
Model Period Mean (intersection) [W/m2] |
Model Period Mean (complement) [W/m2] |
Benchmark Period Mean (intersection) [W/m2] |
Benchmark Period Mean (complement) [W/m2] |
Bias [W/m2] |
RMSE [W/m2] |
Phase Shift [months] |
Bias Score [1] |
RMSE Score [1] |
Seasonal Cycle Score [1] |
Spatial Distribution Score [1] |
Overall Score [1] |
|||
|---|---|---|---|---|---|---|---|---|---|---|---|---|---|---|---|---|
| Benchmark | [-] | 14.9 | ||||||||||||||
| CLM4 | [-] | 8.84 | 8.92 | 8.58 | 15.0 | 3.59 | -6.08 | 13.9 | 0.0837 | 0.706 | 0.595 | 1.01 | 0.714 | 0.725 | ||
| CLM4.5 | [-] | 13.3 | 13.5 | 8.84 | 15.0 | 3.59 | -1.82 | 9.69 | 0.0694 | 0.818 | 0.705 | 1.01 | 0.771 | 0.803 | ||
| CLM5 | [-] | 13.7 | 14.0 | 8.81 | 15.0 | 3.59 | -1.39 | 11.6 | 0.201 | 0.831 | 0.631 | 1.00 | 0.803 | 0.780 |
Download Data |
Period Mean (original grids) [W/m2] |
Model Period Mean (intersection) [W/m2] |
Model Period Mean (complement) [W/m2] |
Benchmark Period Mean (intersection) [W/m2] |
Benchmark Period Mean (complement) [W/m2] |
Bias [W/m2] |
RMSE [W/m2] |
Phase Shift [months] |
Bias Score [1] |
RMSE Score [1] |
Seasonal Cycle Score [1] |
Spatial Distribution Score [1] |
Overall Score [1] |
|||
|---|---|---|---|---|---|---|---|---|---|---|---|---|---|---|---|---|
| Benchmark | [-] | 77.5 | ||||||||||||||
| CLM4 | [-] | 142. | 143. | 139. | 80.4 | 34.5 | 61.5 | 63.7 | 2.40 | 0.00381 | 0.0935 | 0.620 | 0.534 | 0.269 | ||
| CLM4.5 | [-] | 121. | 121. | 123. | 80.4 | 34.5 | 40.7 | 44.2 | 2.48 | 0.0388 | 0.0887 | 0.607 | 0.356 | 0.236 | ||
| CLM5 | [-] | 127. | 127. | 126. | 80.4 | 34.5 | 45.9 | 48.4 | 2.07 | 0.0312 | 0.109 | 0.684 | 0.597 | 0.306 |
Download Data |
Period Mean (original grids) [W/m2] |
Model Period Mean (intersection) [W/m2] |
Model Period Mean (complement) [W/m2] |
Benchmark Period Mean (intersection) [W/m2] |
Benchmark Period Mean (complement) [W/m2] |
Bias [W/m2] |
RMSE [W/m2] |
Phase Shift [months] |
Bias Score [1] |
RMSE Score [1] |
Seasonal Cycle Score [1] |
Spatial Distribution Score [1] |
Overall Score [1] |
|||
|---|---|---|---|---|---|---|---|---|---|---|---|---|---|---|---|---|
| Benchmark | [-] | 26.3 | ||||||||||||||
| CLM4 | [-] | 25.3 | 25.2 | 25.8 | 26.3 | 3.49 | -1.11 | 10.3 | 0.166 | 0.867 | 0.732 | 0.989 | 0.846 | 0.833 | ||
| CLM4.5 | [-] | 27.1 | 27.1 | 25.3 | 26.3 | 3.49 | 0.732 | 11.0 | 0.200 | 0.876 | 0.708 | 0.986 | 0.873 | 0.830 | ||
| CLM5 | [-] | 29.3 | 29.4 | 24.8 | 26.3 | 3.49 | 3.00 | 12.5 | 0.288 | 0.850 | 0.672 | 0.981 | 0.965 | 0.828 |
Download Data |
Period Mean (original grids) [W/m2] |
Model Period Mean (intersection) [W/m2] |
Model Period Mean (complement) [W/m2] |
Benchmark Period Mean (intersection) [W/m2] |
Benchmark Period Mean (complement) [W/m2] |
Bias [W/m2] |
RMSE [W/m2] |
Phase Shift [months] |
Bias Score [1] |
RMSE Score [1] |
Seasonal Cycle Score [1] |
Spatial Distribution Score [1] |
Overall Score [1] |
|||
|---|---|---|---|---|---|---|---|---|---|---|---|---|---|---|---|---|
| Benchmark | [-] | 28.0 | ||||||||||||||
| CLM4 | [-] | 33.7 | 33.9 | 29.3 | 28.1 | 13.0 | 6.29 | 16.3 | 0.544 | 0.666 | 0.542 | 0.976 | 0.913 | 0.728 | ||
| CLM4.5 | [-] | 33.4 | 33.7 | 26.7 | 28.1 | 13.0 | 6.08 | 16.1 | 0.602 | 0.689 | 0.548 | 0.973 | 0.937 | 0.739 | ||
| CLM5 | [-] | 30.3 | 30.5 | 24.6 | 28.1 | 13.0 | 2.94 | 15.3 | 0.566 | 0.750 | 0.547 | 0.969 | 0.969 | 0.756 |
Download Data |
Period Mean (original grids) [W/m2] |
Model Period Mean (intersection) [W/m2] |
Model Period Mean (complement) [W/m2] |
Benchmark Period Mean (intersection) [W/m2] |
Benchmark Period Mean (complement) [W/m2] |
Bias [W/m2] |
RMSE [W/m2] |
Phase Shift [months] |
Bias Score [1] |
RMSE Score [1] |
Seasonal Cycle Score [1] |
Spatial Distribution Score [1] |
Overall Score [1] |
|||
|---|---|---|---|---|---|---|---|---|---|---|---|---|---|---|---|---|
| Benchmark | [-] | 57.0 | ||||||||||||||
| CLM4 | [-] | 76.4 | 75.6 | 94.1 | 57.2 | 29.3 | 21.3 | 35.5 | 1.07 | 0.403 | 0.290 | 0.868 | 0.865 | 0.543 | ||
| CLM4.5 | [-] | 68.3 | 67.3 | 87.7 | 57.2 | 29.3 | 13.0 | 30.9 | 1.12 | 0.508 | 0.310 | 0.864 | 0.938 | 0.586 | ||
| CLM5 | [-] | 68.8 | 67.9 | 87.5 | 57.2 | 29.3 | 13.3 | 28.0 | 1.22 | 0.520 | 0.363 | 0.841 | 0.947 | 0.607 |
Download Data |
Period Mean (original grids) [W/m2] |
Model Period Mean (intersection) [W/m2] |
Model Period Mean (complement) [W/m2] |
Benchmark Period Mean (intersection) [W/m2] |
Benchmark Period Mean (complement) [W/m2] |
Bias [W/m2] |
RMSE [W/m2] |
Phase Shift [months] |
Bias Score [1] |
RMSE Score [1] |
Seasonal Cycle Score [1] |
Spatial Distribution Score [1] |
Overall Score [1] |
|||
|---|---|---|---|---|---|---|---|---|---|---|---|---|---|---|---|---|
| Benchmark | [-] | 15.7 | ||||||||||||||
| CLM4 | [-] | 7.84 | 8.12 | 4.52 | 15.8 | -6.07 | -7.78 | 15.3 | 0.0610 | 0.687 | 0.596 | 1.01 | 0.737 | 0.725 | ||
| CLM4.5 | [-] | 11.6 | 12.0 | 4.44 | 15.8 | -6.07 | -4.06 | 12.4 | 0.164 | 0.810 | 0.637 | 1.01 | 0.878 | 0.794 | ||
| CLM5 | [-] | 15.9 | 16.4 | 6.06 | 15.8 | -6.07 | 0.228 | 12.8 | 0.0919 | 0.890 | 0.595 | 1.01 | 0.882 | 0.795 |
Download Data |
Period Mean (original grids) [W/m2] |
Model Period Mean (intersection) [W/m2] |
Model Period Mean (complement) [W/m2] |
Benchmark Period Mean (intersection) [W/m2] |
Benchmark Period Mean (complement) [W/m2] |
Bias [W/m2] |
RMSE [W/m2] |
Phase Shift [months] |
Bias Score [1] |
RMSE Score [1] |
Seasonal Cycle Score [1] |
Spatial Distribution Score [1] |
Overall Score [1] |
|||
|---|---|---|---|---|---|---|---|---|---|---|---|---|---|---|---|---|
| Benchmark | [-] | 26.8 | ||||||||||||||
| CLM4 | [-] | 34.9 | 33.9 | 54.6 | 26.9 | 19.3 | 8.69 | 19.3 | 0.569 | 0.610 | 0.356 | 0.950 | 0.869 | 0.628 | ||
| CLM4.5 | [-] | 34.5 | 33.6 | 51.8 | 26.9 | 19.3 | 8.16 | 19.7 | 0.585 | 0.621 | 0.345 | 0.946 | 0.906 | 0.632 | ||
| CLM5 | [-] | 33.2 | 32.2 | 52.2 | 26.9 | 19.3 | 7.11 | 18.3 | 0.630 | 0.636 | 0.385 | 0.945 | 0.847 | 0.640 |
Download Data |
Period Mean (original grids) [W/m2] |
Model Period Mean (intersection) [W/m2] |
Model Period Mean (complement) [W/m2] |
Benchmark Period Mean (intersection) [W/m2] |
Benchmark Period Mean (complement) [W/m2] |
Bias [W/m2] |
RMSE [W/m2] |
Phase Shift [months] |
Bias Score [1] |
RMSE Score [1] |
Seasonal Cycle Score [1] |
Spatial Distribution Score [1] |
Overall Score [1] |
|||
|---|---|---|---|---|---|---|---|---|---|---|---|---|---|---|---|---|
| Benchmark | [-] | 31.2 | ||||||||||||||
| CLM4 | [-] | 36.7 | 36.7 | 38.5 | 31.7 | 9.65 | 5.07 | 16.9 | 0.372 | 0.779 | 0.585 | 0.977 | 0.963 | 0.778 | ||
| CLM4.5 | [-] | 38.4 | 38.4 | 39.1 | 31.7 | 9.65 | 6.70 | 17.0 | 0.360 | 0.796 | 0.577 | 0.977 | 0.898 | 0.765 | ||
| CLM5 | [-] | 38.9 | 38.9 | 38.5 | 31.7 | 9.65 | 7.13 | 19.9 | 0.324 | 0.773 | 0.519 | 0.981 | 0.814 | 0.721 |
Download Data |
Period Mean (original grids) [W/m2] |
Model Period Mean (intersection) [W/m2] |
Model Period Mean (complement) [W/m2] |
Benchmark Period Mean (intersection) [W/m2] |
Benchmark Period Mean (complement) [W/m2] |
Bias [W/m2] |
RMSE [W/m2] |
Phase Shift [months] |
Bias Score [1] |
RMSE Score [1] |
Seasonal Cycle Score [1] |
Spatial Distribution Score [1] |
Overall Score [1] |
|||
|---|---|---|---|---|---|---|---|---|---|---|---|---|---|---|---|---|
| Benchmark | [-] | 39.1 | ||||||||||||||
| CLM4 | [-] | 41.1 | 49.1 | 8.59 | 39.4 | 16.4 | 10.3 | 22.4 | 0.787 | 0.463 | 0.362 | 0.865 | 0.857 | 0.582 | ||
| CLM4.5 | [-] | 38.7 | 46.1 | 8.62 | 39.4 | 16.4 | 7.23 | 19.7 | 0.814 | 0.528 | 0.371 | 0.863 | 0.942 | 0.615 | ||
| CLM5 | [-] | 38.6 | 45.8 | 8.48 | 39.4 | 16.4 | 6.99 | 19.5 | 0.843 | 0.518 | 0.384 | 0.849 | 0.937 | 0.615 |
Download Data |
Period Mean (original grids) [W/m2] |
Model Period Mean (intersection) [W/m2] |
Model Period Mean (complement) [W/m2] |
Benchmark Period Mean (intersection) [W/m2] |
Benchmark Period Mean (complement) [W/m2] |
Bias [W/m2] |
RMSE [W/m2] |
Phase Shift [months] |
Bias Score [1] |
RMSE Score [1] |
Seasonal Cycle Score [1] |
Spatial Distribution Score [1] |
Overall Score [1] |
|||
|---|---|---|---|---|---|---|---|---|---|---|---|---|---|---|---|---|
| Benchmark | [-] | 8.45 | ||||||||||||||
| CLM4 | [-] | 8.08 | 14.5 | 2.15 | 8.47 | 5.81 | 6.38 | 13.2 | 1.05 | 0.517 | 0.301 | 0.912 | 0.928 | 0.592 | ||
| CLM4.5 | [-] | 8.18 | 14.7 | 2.25 | 8.47 | 5.81 | 6.62 | 13.6 | 1.10 | 0.527 | 0.288 | 0.904 | 0.925 | 0.586 | ||
| CLM5 | [-] | 7.94 | 14.3 | 2.14 | 8.47 | 5.81 | 6.22 | 13.5 | 1.06 | 0.545 | 0.238 | 0.928 | 0.933 | 0.576 |
Download Data |
Period Mean (original grids) [W/m2] |
Model Period Mean (intersection) [W/m2] |
Model Period Mean (complement) [W/m2] |
Benchmark Period Mean (intersection) [W/m2] |
Benchmark Period Mean (complement) [W/m2] |
Bias [W/m2] |
RMSE [W/m2] |
Phase Shift [months] |
Bias Score [1] |
RMSE Score [1] |
Seasonal Cycle Score [1] |
Spatial Distribution Score [1] |
Overall Score [1] |
|||
|---|---|---|---|---|---|---|---|---|---|---|---|---|---|---|---|---|
| Benchmark | [-] | 14.0 | ||||||||||||||
| CLM4 | [-] | 10.8 | 11.1 | 5.47 | 14.0 | 1.27 | -3.11 | 12.5 | 0.159 | 0.733 | 0.582 | 1.01 | 0.851 | 0.750 | ||
| CLM4.5 | [-] | 13.2 | 13.6 | 6.21 | 14.0 | 1.27 | -0.820 | 11.3 | 0.215 | 0.807 | 0.602 | 1.00 | 0.887 | 0.780 | ||
| CLM5 | [-] | 13.8 | 14.2 | 5.57 | 14.0 | 1.27 | -0.298 | 12.0 | 0.243 | 0.804 | 0.565 | 0.995 | 0.926 | 0.771 |
Download Data |
Period Mean (original grids) [W/m2] |
Model Period Mean (intersection) [W/m2] |
Model Period Mean (complement) [W/m2] |
Benchmark Period Mean (intersection) [W/m2] |
Benchmark Period Mean (complement) [W/m2] |
Bias [W/m2] |
RMSE [W/m2] |
Phase Shift [months] |
Bias Score [1] |
RMSE Score [1] |
Seasonal Cycle Score [1] |
Spatial Distribution Score [1] |
Overall Score [1] |
|||
|---|---|---|---|---|---|---|---|---|---|---|---|---|---|---|---|---|
| Benchmark | [-] | 50.4 | ||||||||||||||
| CLM4 | [-] | 63.6 | 62.5 | 75.7 | 50.9 | 20.2 | 15.6 | 29.7 | 0.914 | 0.412 | 0.262 | 0.882 | 0.873 | 0.538 | ||
| CLM4.5 | [-] | 64.0 | 63.0 | 75.1 | 50.9 | 20.2 | 16.0 | 31.8 | 0.900 | 0.381 | 0.225 | 0.886 | 0.853 | 0.514 | ||
| CLM5 | [-] | 62.0 | 60.9 | 73.8 | 50.9 | 20.2 | 13.9 | 27.3 | 0.907 | 0.416 | 0.299 | 0.885 | 0.863 | 0.552 |
Download Data |
Period Mean (original grids) [W/m2] |
Model Period Mean (intersection) [W/m2] |
Model Period Mean (complement) [W/m2] |
Benchmark Period Mean (intersection) [W/m2] |
Benchmark Period Mean (complement) [W/m2] |
Bias [W/m2] |
RMSE [W/m2] |
Phase Shift [months] |
Bias Score [1] |
RMSE Score [1] |
Seasonal Cycle Score [1] |
Spatial Distribution Score [1] |
Overall Score [1] |
|||
|---|---|---|---|---|---|---|---|---|---|---|---|---|---|---|---|---|
| Benchmark | [-] | 49.7 | ||||||||||||||
| CLM4 | [-] | 65.7 | 65.6 | 77.9 | 49.8 | 19.0 | 16.4 | 26.4 | 0.581 | 0.637 | 0.561 | 0.957 | 0.981 | 0.740 | ||
| CLM4.5 | [-] | 63.4 | 63.4 | 72.4 | 49.8 | 19.0 | 14.3 | 23.5 | 0.559 | 0.671 | 0.594 | 0.960 | 0.979 | 0.760 | ||
| CLM5 | [-] | 56.4 | 56.4 | 65.6 | 49.8 | 19.0 | 7.17 | 19.9 | 0.578 | 0.801 | 0.614 | 0.959 | 0.980 | 0.793 |
Download Data |
Period Mean (original grids) [W/m2] |
Model Period Mean (intersection) [W/m2] |
Model Period Mean (complement) [W/m2] |
Benchmark Period Mean (intersection) [W/m2] |
Benchmark Period Mean (complement) [W/m2] |
Bias [W/m2] |
RMSE [W/m2] |
Phase Shift [months] |
Bias Score [1] |
RMSE Score [1] |
Seasonal Cycle Score [1] |
Spatial Distribution Score [1] |
Overall Score [1] |
|||
|---|---|---|---|---|---|---|---|---|---|---|---|---|---|---|---|---|
| Benchmark | [-] | 25.2 | ||||||||||||||
| CLM4 | [-] | 29.3 | 29.2 | 42.0 | 25.4 | 10.7 | 3.96 | 12.4 | 0.143 | 0.803 | 0.677 | 0.991 | 0.868 | 0.803 | ||
| CLM4.5 | [-] | 33.3 | 33.4 | 36.5 | 25.4 | 10.7 | 8.02 | 15.8 | 0.148 | 0.743 | 0.597 | 0.991 | 0.977 | 0.781 | ||
| CLM5 | [-] | 34.5 | 34.6 | 35.3 | 25.4 | 10.7 | 9.12 | 18.1 | 0.323 | 0.713 | 0.552 | 0.979 | 0.975 | 0.754 |
Download Data |
Period Mean (original grids) [W/m2] |
Model Period Mean (intersection) [W/m2] |
Model Period Mean (complement) [W/m2] |
Benchmark Period Mean (intersection) [W/m2] |
Benchmark Period Mean (complement) [W/m2] |
Bias [W/m2] |
RMSE [W/m2] |
Phase Shift [months] |
Bias Score [1] |
RMSE Score [1] |
Seasonal Cycle Score [1] |
Spatial Distribution Score [1] |
Overall Score [1] |
|||
|---|---|---|---|---|---|---|---|---|---|---|---|---|---|---|---|---|
| Benchmark | [-] | 27.2 | ||||||||||||||
| CLM4 | [-] | 28.5 | 28.9 | 39.0 | 27.2 | 14.3 | 1.88 | 12.7 | 0.723 | 0.755 | 0.531 | 0.929 | 0.981 | 0.745 | ||
| CLM4.5 | [-] | 28.5 | 29.0 | 37.2 | 27.2 | 14.3 | 1.93 | 13.9 | 0.844 | 0.746 | 0.494 | 0.913 | 0.973 | 0.724 | ||
| CLM5 | [-] | 25.7 | 26.1 | 37.1 | 27.2 | 14.3 | -0.950 | 12.9 | 0.710 | 0.741 | 0.543 | 0.940 | 0.979 | 0.749 |
Download Data |
Period Mean (original grids) [W/m2] |
Model Period Mean (intersection) [W/m2] |
Model Period Mean (complement) [W/m2] |
Benchmark Period Mean (intersection) [W/m2] |
Benchmark Period Mean (complement) [W/m2] |
Bias [W/m2] |
RMSE [W/m2] |
Phase Shift [months] |
Bias Score [1] |
RMSE Score [1] |
Seasonal Cycle Score [1] |
Spatial Distribution Score [1] |
Overall Score [1] |
|||
|---|---|---|---|---|---|---|---|---|---|---|---|---|---|---|---|---|
| Benchmark | [-] | 90.0 | ||||||||||||||
| CLM4 | [-] | 128. | 128. | 114. | 90.2 | 27.7 | 36.8 | 43.4 | 1.76 | 0.0557 | 0.103 | 0.752 | 0.814 | 0.366 | ||
| CLM4.5 | [-] | 107. | 107. | 110. | 90.2 | 27.7 | 17.1 | 27.3 | 2.19 | 0.185 | 0.108 | 0.662 | 0.985 | 0.409 | ||
| CLM5 | [-] | 114. | 114. | 112. | 90.2 | 27.7 | 23.7 | 30.3 | 2.08 | 0.0925 | 0.121 | 0.688 | 0.965 | 0.397 |
Download Data |
Period Mean (original grids) [W/m2] |
Model Period Mean (intersection) [W/m2] |
Model Period Mean (complement) [W/m2] |
Benchmark Period Mean (intersection) [W/m2] |
Benchmark Period Mean (complement) [W/m2] |
Bias [W/m2] |
RMSE [W/m2] |
Phase Shift [months] |
Bias Score [1] |
RMSE Score [1] |
Seasonal Cycle Score [1] |
Spatial Distribution Score [1] |
Overall Score [1] |
|||
|---|---|---|---|---|---|---|---|---|---|---|---|---|---|---|---|---|
| Benchmark | [-] | 69.7 | ||||||||||||||
| CLM4 | [-] | 82.8 | 82.3 | 83.6 | 69.8 | 17.5 | 12.7 | 31.4 | 0.967 | 0.445 | 0.356 | 0.882 | 0.760 | 0.560 | ||
| CLM4.5 | [-] | 76.9 | 76.3 | 83.6 | 69.8 | 17.5 | 6.72 | 27.1 | 0.876 | 0.547 | 0.383 | 0.896 | 0.893 | 0.621 | ||
| CLM5 | [-] | 74.2 | 73.7 | 82.3 | 69.8 | 17.5 | 4.18 | 24.7 | 0.843 | 0.520 | 0.429 | 0.911 | 0.835 | 0.625 |
Download Data |
Period Mean (original grids) [W/m2] |
Model Period Mean (intersection) [W/m2] |
Model Period Mean (complement) [W/m2] |
Benchmark Period Mean (intersection) [W/m2] |
Benchmark Period Mean (complement) [W/m2] |
Bias [W/m2] |
RMSE [W/m2] |
Phase Shift [months] |
Bias Score [1] |
RMSE Score [1] |
Seasonal Cycle Score [1] |
Spatial Distribution Score [1] |
Overall Score [1] |
|||
|---|---|---|---|---|---|---|---|---|---|---|---|---|---|---|---|---|
| Benchmark | [-] | 22.7 | ||||||||||||||
| CLM4 | [-] | 26.6 | 27.1 | 17.6 | 23.0 | 8.02 | 4.77 | 16.8 | 1.06 | 0.479 | 0.337 | 0.901 | 0.866 | 0.584 | ||
| CLM4.5 | [-] | 26.2 | 26.5 | 17.3 | 23.0 | 8.02 | 4.07 | 16.6 | 1.16 | 0.487 | 0.341 | 0.881 | 0.919 | 0.594 | ||
| CLM5 | [-] | 25.0 | 25.2 | 17.3 | 23.0 | 8.02 | 3.14 | 15.7 | 0.807 | 0.466 | 0.371 | 0.936 | 0.892 | 0.607 |
Temporally integrated period mean