Mean State
Download Data |
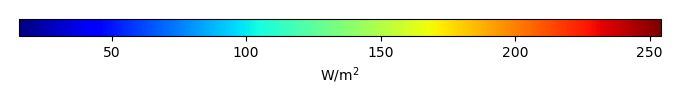
Period Mean (original grids) [W/m2] |
Model Period Mean (intersection) [W/m2] |
Model Period Mean (complement) [W/m2] |
Benchmark Period Mean (intersection) [W/m2] |
Benchmark Period Mean (complement) [W/m2] |
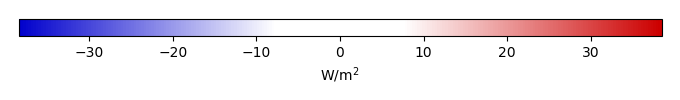
Bias [W/m2] |
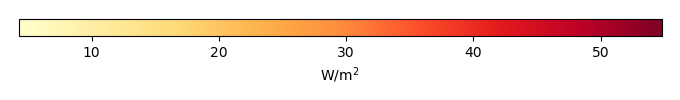
RMSE [W/m2] |
Phase Shift [months] |
Bias Score [1] |
RMSE Score [1] |
Seasonal Cycle Score [1] |
Spatial Distribution Score [1] |
Interannual Variability Score [1] |
Overall Score [1] |
|||
|---|---|---|---|---|---|---|---|---|---|---|---|---|---|---|---|---|---|
| Benchmark | [-] | 187. | |||||||||||||||
| CLM4 | [-] | 191. | 191. | 186. | 206. | 4.79 | 16.5 | 1.16 | 0.629 | 0.486 | 0.849 | 0.947 | 0.480 | 0.646 | |||
| CLM4.5 | [-] | 192. | 191. | 186. | 206. | 5.03 | 16.6 | 1.18 | 0.623 | 0.486 | 0.846 | 0.964 | 0.481 | 0.648 | |||
| CLM5 | [-] | 192. | 192. | 186. | 206. | 5.24 | 16.6 | 1.20 | 0.628 | 0.484 | 0.844 | 0.971 | 0.483 | 0.649 |
Download Data |
Period Mean (original grids) [W/m2] |
Model Period Mean (intersection) [W/m2] |
Model Period Mean (complement) [W/m2] |
Benchmark Period Mean (intersection) [W/m2] |
Benchmark Period Mean (complement) [W/m2] |
Bias [W/m2] |
RMSE [W/m2] |
Phase Shift [months] |
Bias Score [1] |
RMSE Score [1] |
Seasonal Cycle Score [1] |
Spatial Distribution Score [1] |
Interannual Variability Score [1] |
Overall Score [1] |
|||
|---|---|---|---|---|---|---|---|---|---|---|---|---|---|---|---|---|---|
| Benchmark | [-] | 198. | |||||||||||||||
| CLM4 | [-] | 196. | 196. | 198. | 214. | -1.20 | 18.5 | 1.30 | 0.570 | 0.479 | 0.825 | 0.934 | 0.743 | 0.671 | |||
| CLM4.5 | [-] | 198. | 198. | 198. | 214. | -0.128 | 18.9 | 1.26 | 0.564 | 0.471 | 0.831 | 0.938 | 0.745 | 0.670 | |||
| CLM5 | [-] | 198. | 198. | 198. | 214. | 0.401 | 18.8 | 1.49 | 0.568 | 0.466 | 0.781 | 0.946 | 0.742 | 0.661 |
Download Data |
Period Mean (original grids) [W/m2] |
Model Period Mean (intersection) [W/m2] |
Model Period Mean (complement) [W/m2] |
Benchmark Period Mean (intersection) [W/m2] |
Benchmark Period Mean (complement) [W/m2] |
Bias [W/m2] |
RMSE [W/m2] |
Phase Shift [months] |
Bias Score [1] |
RMSE Score [1] |
Seasonal Cycle Score [1] |
Spatial Distribution Score [1] |
Interannual Variability Score [1] |
Overall Score [1] |
|||
|---|---|---|---|---|---|---|---|---|---|---|---|---|---|---|---|---|---|
| Benchmark | [-] | 199. | |||||||||||||||
| CLM4 | [-] | 194. | 194. | 198. | 219. | -4.18 | 17.6 | 1.15 | 0.702 | 0.554 | 0.834 | 0.853 | 0.538 | 0.673 | |||
| CLM4.5 | [-] | 195. | 195. | 198. | 219. | -3.73 | 17.5 | 1.16 | 0.705 | 0.554 | 0.830 | 0.844 | 0.542 | 0.672 | |||
| CLM5 | [-] | 195. | 195. | 198. | 219. | -3.72 | 17.4 | 1.18 | 0.705 | 0.553 | 0.828 | 0.866 | 0.535 | 0.673 |
Download Data |
Period Mean (original grids) [W/m2] |
Model Period Mean (intersection) [W/m2] |
Model Period Mean (complement) [W/m2] |
Benchmark Period Mean (intersection) [W/m2] |
Benchmark Period Mean (complement) [W/m2] |
Bias [W/m2] |
RMSE [W/m2] |
Phase Shift [months] |
Bias Score [1] |
RMSE Score [1] |
Seasonal Cycle Score [1] |
Spatial Distribution Score [1] |
Interannual Variability Score [1] |
Overall Score [1] |
|||
|---|---|---|---|---|---|---|---|---|---|---|---|---|---|---|---|---|---|
| Benchmark | [-] | 70.7 | |||||||||||||||
| CLM4 | [-] | 67.3 | 67.4 | 70.5 | 72.8 | -3.59 | 24.0 | 0.468 | 0.898 | 0.708 | 0.968 | 0.995 | 0.729 | 0.835 | |||
| CLM4.5 | [-] | 73.2 | 73.3 | 70.5 | 72.8 | 1.13 | 21.6 | 0.417 | 0.889 | 0.745 | 0.972 | 0.953 | 0.694 | 0.833 | |||
| CLM5 | [-] | 75.8 | 75.9 | 70.5 | 72.8 | 3.73 | 21.2 | 0.340 | 0.867 | 0.756 | 0.977 | 0.971 | 0.680 | 0.835 |
Download Data |
Period Mean (original grids) [W/m2] |
Model Period Mean (intersection) [W/m2] |
Model Period Mean (complement) [W/m2] |
Benchmark Period Mean (intersection) [W/m2] |
Benchmark Period Mean (complement) [W/m2] |
Bias [W/m2] |
RMSE [W/m2] |
Phase Shift [months] |
Bias Score [1] |
RMSE Score [1] |
Seasonal Cycle Score [1] |
Spatial Distribution Score [1] |
Interannual Variability Score [1] |
Overall Score [1] |
|||
|---|---|---|---|---|---|---|---|---|---|---|---|---|---|---|---|---|---|
| Benchmark | [-] | 194. | |||||||||||||||
| CLM4 | [-] | 187. | 186. | 190. | 207. | -1.23 | 18.1 | 1.45 | 0.609 | 0.443 | 0.777 | 0.840 | 0.521 | 0.605 | |||
| CLM4.5 | [-] | 187. | 186. | 190. | 207. | -1.29 | 18.1 | 1.48 | 0.608 | 0.443 | 0.772 | 0.837 | 0.520 | 0.604 | |||
| CLM5 | [-] | 186. | 186. | 190. | 207. | -1.72 | 18.0 | 1.47 | 0.613 | 0.444 | 0.776 | 0.845 | 0.518 | 0.607 |
Download Data |
Period Mean (original grids) [W/m2] |
Model Period Mean (intersection) [W/m2] |
Model Period Mean (complement) [W/m2] |
Benchmark Period Mean (intersection) [W/m2] |
Benchmark Period Mean (complement) [W/m2] |
Bias [W/m2] |
RMSE [W/m2] |
Phase Shift [months] |
Bias Score [1] |
RMSE Score [1] |
Seasonal Cycle Score [1] |
Spatial Distribution Score [1] |
Interannual Variability Score [1] |
Overall Score [1] |
|||
|---|---|---|---|---|---|---|---|---|---|---|---|---|---|---|---|---|---|
| Benchmark | [-] | 97.8 | |||||||||||||||
| CLM4 | [-] | 108. | 108. | 97.6 | 118. | 10.3 | 21.4 | 0.265 | 0.846 | 0.788 | 0.982 | 0.978 | 0.733 | 0.852 | |||
| CLM4.5 | [-] | 106. | 106. | 97.6 | 118. | 8.50 | 23.0 | 0.274 | 0.843 | 0.769 | 0.982 | 0.950 | 0.736 | 0.842 | |||
| CLM5 | [-] | 108. | 108. | 97.6 | 118. | 11.0 | 20.9 | 0.266 | 0.846 | 0.793 | 0.982 | 0.998 | 0.724 | 0.856 |
Download Data |
Period Mean (original grids) [W/m2] |
Model Period Mean (intersection) [W/m2] |
Model Period Mean (complement) [W/m2] |
Benchmark Period Mean (intersection) [W/m2] |
Benchmark Period Mean (complement) [W/m2] |
Bias [W/m2] |
RMSE [W/m2] |
Phase Shift [months] |
Bias Score [1] |
RMSE Score [1] |
Seasonal Cycle Score [1] |
Spatial Distribution Score [1] |
Interannual Variability Score [1] |
Overall Score [1] |
|||
|---|---|---|---|---|---|---|---|---|---|---|---|---|---|---|---|---|---|
| Benchmark | [-] | 139. | |||||||||||||||
| CLM4 | [-] | 148. | 148. | 138. | 149. | 9.50 | 23.4 | 0.439 | 0.752 | 0.750 | 0.962 | 0.970 | 0.718 | 0.817 | |||
| CLM4.5 | [-] | 147. | 147. | 138. | 149. | 8.85 | 23.2 | 0.441 | 0.758 | 0.748 | 0.962 | 0.975 | 0.716 | 0.818 | |||
| CLM5 | [-] | 149. | 149. | 138. | 149. | 10.6 | 23.3 | 0.448 | 0.759 | 0.746 | 0.961 | 0.974 | 0.717 | 0.817 |
Download Data |
Period Mean (original grids) [W/m2] |
Model Period Mean (intersection) [W/m2] |
Model Period Mean (complement) [W/m2] |
Benchmark Period Mean (intersection) [W/m2] |
Benchmark Period Mean (complement) [W/m2] |
Bias [W/m2] |
RMSE [W/m2] |
Phase Shift [months] |
Bias Score [1] |
RMSE Score [1] |
Seasonal Cycle Score [1] |
Spatial Distribution Score [1] |
Interannual Variability Score [1] |
Overall Score [1] |
|||
|---|---|---|---|---|---|---|---|---|---|---|---|---|---|---|---|---|---|
| Benchmark | [-] | 181. | |||||||||||||||
| CLM4 | [-] | 192. | 192. | 179. | 205. | 12.5 | 25.1 | 0.341 | 0.589 | 0.582 | 0.973 | 0.987 | 0.661 | 0.729 | |||
| CLM4.5 | [-] | 192. | 193. | 179. | 205. | 13.1 | 25.4 | 0.343 | 0.580 | 0.582 | 0.973 | 0.980 | 0.656 | 0.726 | |||
| CLM5 | [-] | 193. | 193. | 179. | 205. | 13.7 | 25.4 | 0.335 | 0.581 | 0.587 | 0.973 | 0.961 | 0.653 | 0.724 |
Download Data |
Period Mean (original grids) [W/m2] |
Model Period Mean (intersection) [W/m2] |
Model Period Mean (complement) [W/m2] |
Benchmark Period Mean (intersection) [W/m2] |
Benchmark Period Mean (complement) [W/m2] |
Bias [W/m2] |
RMSE [W/m2] |
Phase Shift [months] |
Bias Score [1] |
RMSE Score [1] |
Seasonal Cycle Score [1] |
Spatial Distribution Score [1] |
Interannual Variability Score [1] |
Overall Score [1] |
|||
|---|---|---|---|---|---|---|---|---|---|---|---|---|---|---|---|---|---|
| Benchmark | [-] | 62.8 | |||||||||||||||
| CLM4 | [-] | 62.2 | 62.7 | 63.2 | 54.4 | -1.41 | 22.5 | 0.380 | 0.914 | 0.714 | 0.975 | 0.970 | 0.770 | 0.843 | |||
| CLM4.5 | [-] | 63.9 | 64.4 | 63.2 | 54.4 | -0.159 | 22.7 | 0.360 | 0.886 | 0.723 | 0.976 | 0.902 | 0.739 | 0.825 | |||
| CLM5 | [-] | 68.8 | 69.2 | 63.2 | 54.4 | 4.51 | 19.9 | 0.302 | 0.885 | 0.758 | 0.980 | 0.945 | 0.718 | 0.841 |
Download Data |
Period Mean (original grids) [W/m2] |
Model Period Mean (intersection) [W/m2] |
Model Period Mean (complement) [W/m2] |
Benchmark Period Mean (intersection) [W/m2] |
Benchmark Period Mean (complement) [W/m2] |
Bias [W/m2] |
RMSE [W/m2] |
Phase Shift [months] |
Bias Score [1] |
RMSE Score [1] |
Seasonal Cycle Score [1] |
Spatial Distribution Score [1] |
Interannual Variability Score [1] |
Overall Score [1] |
|||
|---|---|---|---|---|---|---|---|---|---|---|---|---|---|---|---|---|---|
| Benchmark | [-] | 198. | |||||||||||||||
| CLM4 | [-] | 195. | 195. | 198. | 197. | -5.04 | 14.6 | 0.502 | 0.844 | 0.777 | 0.966 | 0.974 | 0.666 | 0.834 | |||
| CLM4.5 | [-] | 195. | 195. | 198. | 197. | -5.00 | 14.7 | 0.491 | 0.841 | 0.777 | 0.967 | 0.968 | 0.668 | 0.833 | |||
| CLM5 | [-] | 196. | 196. | 198. | 197. | -4.02 | 14.4 | 0.511 | 0.855 | 0.775 | 0.965 | 0.977 | 0.660 | 0.834 |
Download Data |
Period Mean (original grids) [W/m2] |
Model Period Mean (intersection) [W/m2] |
Model Period Mean (complement) [W/m2] |
Benchmark Period Mean (intersection) [W/m2] |
Benchmark Period Mean (complement) [W/m2] |
Bias [W/m2] |
RMSE [W/m2] |
Phase Shift [months] |
Bias Score [1] |
RMSE Score [1] |
Seasonal Cycle Score [1] |
Spatial Distribution Score [1] |
Interannual Variability Score [1] |
Overall Score [1] |
|||
|---|---|---|---|---|---|---|---|---|---|---|---|---|---|---|---|---|---|
| Benchmark | [-] | 120. | |||||||||||||||
| CLM4 | [-] | 131. | 131. | 118. | 145. | 13.8 | 25.1 | 0.251 | 0.775 | 0.793 | 0.983 | 0.996 | 0.752 | 0.849 | |||
| CLM4.5 | [-] | 132. | 132. | 118. | 145. | 14.6 | 24.6 | 0.221 | 0.772 | 0.796 | 0.985 | 0.994 | 0.745 | 0.848 | |||
| CLM5 | [-] | 132. | 132. | 118. | 145. | 14.6 | 24.3 | 0.228 | 0.771 | 0.802 | 0.985 | 0.992 | 0.729 | 0.847 |
Download Data |
Period Mean (original grids) [W/m2] |
Model Period Mean (intersection) [W/m2] |
Model Period Mean (complement) [W/m2] |
Benchmark Period Mean (intersection) [W/m2] |
Benchmark Period Mean (complement) [W/m2] |
Bias [W/m2] |
RMSE [W/m2] |
Phase Shift [months] |
Bias Score [1] |
RMSE Score [1] |
Seasonal Cycle Score [1] |
Spatial Distribution Score [1] |
Interannual Variability Score [1] |
Overall Score [1] |
|||
|---|---|---|---|---|---|---|---|---|---|---|---|---|---|---|---|---|---|
| Benchmark | [-] | 163. | |||||||||||||||
| CLM4 | [-] | 142. | 142. | 142. | 173. | 0.466 | 20.2 | 0.572 | 0.742 | 0.682 | 0.936 | 0.994 | 0.622 | 0.776 | |||
| CLM4.5 | [-] | 142. | 142. | 142. | 173. | 0.983 | 19.8 | 0.577 | 0.747 | 0.688 | 0.935 | 0.995 | 0.617 | 0.778 | |||
| CLM5 | [-] | 144. | 144. | 142. | 173. | 1.68 | 19.7 | 0.586 | 0.746 | 0.686 | 0.933 | 0.995 | 0.614 | 0.777 |
Download Data |
Period Mean (original grids) [W/m2] |
Model Period Mean (intersection) [W/m2] |
Model Period Mean (complement) [W/m2] |
Benchmark Period Mean (intersection) [W/m2] |
Benchmark Period Mean (complement) [W/m2] |
Bias [W/m2] |
RMSE [W/m2] |
Phase Shift [months] |
Bias Score [1] |
RMSE Score [1] |
Seasonal Cycle Score [1] |
Spatial Distribution Score [1] |
Interannual Variability Score [1] |
Overall Score [1] |
|||
|---|---|---|---|---|---|---|---|---|---|---|---|---|---|---|---|---|---|
| Benchmark | [-] | 177. | |||||||||||||||
| CLM4 | [-] | 166. | 166. | 175. | 217. | -8.23 | 18.4 | 0.379 | 0.709 | 0.753 | 0.970 | 0.984 | 0.693 | 0.810 | |||
| CLM4.5 | [-] | 167. | 167. | 175. | 217. | -7.55 | 18.1 | 0.384 | 0.713 | 0.755 | 0.969 | 0.984 | 0.694 | 0.812 | |||
| CLM5 | [-] | 168. | 168. | 175. | 217. | -6.31 | 17.8 | 0.410 | 0.721 | 0.750 | 0.963 | 0.983 | 0.709 | 0.813 |
Download Data |
Period Mean (original grids) [W/m2] |
Model Period Mean (intersection) [W/m2] |
Model Period Mean (complement) [W/m2] |
Benchmark Period Mean (intersection) [W/m2] |
Benchmark Period Mean (complement) [W/m2] |
Bias [W/m2] |
RMSE [W/m2] |
Phase Shift [months] |
Bias Score [1] |
RMSE Score [1] |
Seasonal Cycle Score [1] |
Spatial Distribution Score [1] |
Interannual Variability Score [1] |
Overall Score [1] |
|||
|---|---|---|---|---|---|---|---|---|---|---|---|---|---|---|---|---|---|
| Benchmark | [-] | 69.7 | |||||||||||||||
| CLM4 | [-] | 72.5 | 72.3 | 69.6 | 71.1 | 0.799 | 21.6 | 0.165 | 0.884 | 0.745 | 0.989 | 0.907 | 0.638 | 0.818 | |||
| CLM4.5 | [-] | 74.4 | 74.2 | 69.6 | 71.1 | 2.35 | 21.1 | 0.159 | 0.878 | 0.751 | 0.989 | 0.898 | 0.608 | 0.813 | |||
| CLM5 | [-] | 75.4 | 75.2 | 69.6 | 71.1 | 3.21 | 20.9 | 0.131 | 0.879 | 0.755 | 0.991 | 0.911 | 0.614 | 0.818 |
Download Data |
Period Mean (original grids) [W/m2] |
Model Period Mean (intersection) [W/m2] |
Model Period Mean (complement) [W/m2] |
Benchmark Period Mean (intersection) [W/m2] |
Benchmark Period Mean (complement) [W/m2] |
Bias [W/m2] |
RMSE [W/m2] |
Phase Shift [months] |
Bias Score [1] |
RMSE Score [1] |
Seasonal Cycle Score [1] |
Spatial Distribution Score [1] |
Interannual Variability Score [1] |
Overall Score [1] |
|||
|---|---|---|---|---|---|---|---|---|---|---|---|---|---|---|---|---|---|
| Benchmark | [-] | 204. | |||||||||||||||
| CLM4 | [-] | 190. | 190. | 201. | 219. | -8.56 | 24.5 | 1.00 | 0.603 | 0.640 | 0.890 | 0.867 | 0.670 | 0.718 | |||
| CLM4.5 | [-] | 189. | 190. | 201. | 219. | -9.27 | 24.3 | 1.02 | 0.606 | 0.639 | 0.888 | 0.811 | 0.673 | 0.709 | |||
| CLM5 | [-] | 190. | 190. | 201. | 219. | -9.17 | 24.0 | 0.944 | 0.610 | 0.642 | 0.906 | 0.791 | 0.668 | 0.710 |
Download Data |
Period Mean (original grids) [W/m2] |
Model Period Mean (intersection) [W/m2] |
Model Period Mean (complement) [W/m2] |
Benchmark Period Mean (intersection) [W/m2] |
Benchmark Period Mean (complement) [W/m2] |
Bias [W/m2] |
RMSE [W/m2] |
Phase Shift [months] |
Bias Score [1] |
RMSE Score [1] |
Seasonal Cycle Score [1] |
Spatial Distribution Score [1] |
Interannual Variability Score [1] |
Overall Score [1] |
|||
|---|---|---|---|---|---|---|---|---|---|---|---|---|---|---|---|---|---|
| Benchmark | [-] | 150. | |||||||||||||||
| CLM4 | [-] | 156. | 156. | 148. | 192. | 9.04 | 18.9 | 0.404 | 0.817 | 0.786 | 0.973 | 0.978 | 0.577 | 0.820 | |||
| CLM4.5 | [-] | 155. | 156. | 148. | 192. | 8.28 | 18.4 | 0.397 | 0.831 | 0.781 | 0.974 | 0.982 | 0.586 | 0.823 | |||
| CLM5 | [-] | 155. | 155. | 148. | 192. | 7.59 | 17.9 | 0.415 | 0.842 | 0.782 | 0.973 | 0.982 | 0.576 | 0.823 |
Download Data |
Period Mean (original grids) [W/m2] |
Model Period Mean (intersection) [W/m2] |
Model Period Mean (complement) [W/m2] |
Benchmark Period Mean (intersection) [W/m2] |
Benchmark Period Mean (complement) [W/m2] |
Bias [W/m2] |
RMSE [W/m2] |
Phase Shift [months] |
Bias Score [1] |
RMSE Score [1] |
Seasonal Cycle Score [1] |
Spatial Distribution Score [1] |
Interannual Variability Score [1] |
Overall Score [1] |
|||
|---|---|---|---|---|---|---|---|---|---|---|---|---|---|---|---|---|---|
| Benchmark | [-] | 110. | |||||||||||||||
| CLM4 | [-] | 122. | 122. | 110. | 117. | 12.0 | 22.1 | 0.254 | 0.826 | 0.800 | 0.983 | 0.915 | 0.574 | 0.817 | |||
| CLM4.5 | [-] | 123. | 123. | 110. | 117. | 12.9 | 21.9 | 0.256 | 0.822 | 0.804 | 0.983 | 0.953 | 0.546 | 0.819 | |||
| CLM5 | [-] | 122. | 123. | 110. | 117. | 12.7 | 21.6 | 0.262 | 0.827 | 0.803 | 0.983 | 0.975 | 0.557 | 0.825 |
Download Data |
Period Mean (original grids) [W/m2] |
Model Period Mean (intersection) [W/m2] |
Model Period Mean (complement) [W/m2] |
Benchmark Period Mean (intersection) [W/m2] |
Benchmark Period Mean (complement) [W/m2] |
Bias [W/m2] |
RMSE [W/m2] |
Phase Shift [months] |
Bias Score [1] |
RMSE Score [1] |
Seasonal Cycle Score [1] |
Spatial Distribution Score [1] |
Interannual Variability Score [1] |
Overall Score [1] |
|||
|---|---|---|---|---|---|---|---|---|---|---|---|---|---|---|---|---|---|
| Benchmark | [-] | 161. | |||||||||||||||
| CLM4 | [-] | 152. | 153. | 161. | 163. | -8.24 | 18.6 | 0.236 | 0.862 | 0.801 | 0.984 | 0.947 | 0.622 | 0.836 | |||
| CLM4.5 | [-] | 151. | 151. | 161. | 163. | -9.35 | 18.6 | 0.229 | 0.852 | 0.806 | 0.984 | 0.962 | 0.623 | 0.839 | |||
| CLM5 | [-] | 154. | 154. | 161. | 163. | -6.92 | 17.1 | 0.227 | 0.880 | 0.811 | 0.984 | 0.951 | 0.614 | 0.842 |
Download Data |
Period Mean (original grids) [W/m2] |
Model Period Mean (intersection) [W/m2] |
Model Period Mean (complement) [W/m2] |
Benchmark Period Mean (intersection) [W/m2] |
Benchmark Period Mean (complement) [W/m2] |
Bias [W/m2] |
RMSE [W/m2] |
Phase Shift [months] |
Bias Score [1] |
RMSE Score [1] |
Seasonal Cycle Score [1] |
Spatial Distribution Score [1] |
Interannual Variability Score [1] |
Overall Score [1] |
|||
|---|---|---|---|---|---|---|---|---|---|---|---|---|---|---|---|---|---|
| Benchmark | [-] | 179. | |||||||||||||||
| CLM4 | [-] | 182. | 182. | 178. | 218. | 5.38 | 17.1 | 1.46 | 0.611 | 0.453 | 0.782 | 0.837 | 0.581 | 0.619 | |||
| CLM4.5 | [-] | 183. | 183. | 178. | 218. | 5.38 | 17.1 | 1.46 | 0.607 | 0.453 | 0.782 | 0.823 | 0.581 | 0.617 | |||
| CLM5 | [-] | 182. | 182. | 178. | 218. | 5.20 | 17.0 | 1.48 | 0.611 | 0.453 | 0.778 | 0.816 | 0.579 | 0.615 |
Download Data |
Period Mean (original grids) [W/m2] |
Model Period Mean (intersection) [W/m2] |
Model Period Mean (complement) [W/m2] |
Benchmark Period Mean (intersection) [W/m2] |
Benchmark Period Mean (complement) [W/m2] |
Bias [W/m2] |
RMSE [W/m2] |
Phase Shift [months] |
Bias Score [1] |
RMSE Score [1] |
Seasonal Cycle Score [1] |
Spatial Distribution Score [1] |
Interannual Variability Score [1] |
Overall Score [1] |
|||
|---|---|---|---|---|---|---|---|---|---|---|---|---|---|---|---|---|---|
| Benchmark | [-] | 185. | |||||||||||||||
| CLM4 | [-] | 186. | 187. | 184. | 202. | 2.31 | 20.7 | 0.980 | 0.683 | 0.612 | 0.885 | 0.818 | 0.547 | 0.693 | |||
| CLM4.5 | [-] | 186. | 186. | 184. | 202. | 2.21 | 20.7 | 0.977 | 0.681 | 0.612 | 0.882 | 0.829 | 0.549 | 0.694 | |||
| CLM5 | [-] | 186. | 186. | 184. | 202. | 1.52 | 20.3 | 0.964 | 0.685 | 0.616 | 0.885 | 0.846 | 0.536 | 0.697 |
Download Data |
Period Mean (original grids) [W/m2] |
Model Period Mean (intersection) [W/m2] |
Model Period Mean (complement) [W/m2] |
Benchmark Period Mean (intersection) [W/m2] |
Benchmark Period Mean (complement) [W/m2] |
Bias [W/m2] |
RMSE [W/m2] |
Phase Shift [months] |
Bias Score [1] |
RMSE Score [1] |
Seasonal Cycle Score [1] |
Spatial Distribution Score [1] |
Interannual Variability Score [1] |
Overall Score [1] |
|||
|---|---|---|---|---|---|---|---|---|---|---|---|---|---|---|---|---|---|
| Benchmark | [-] | 178. | |||||||||||||||
| CLM4 | [-] | 176. | 176. | 179. | 169. | -6.09 | 27.7 | 0.558 | 0.681 | 0.689 | 0.944 | 0.820 | 0.637 | 0.743 | |||
| CLM4.5 | [-] | 177. | 176. | 179. | 169. | -5.62 | 27.6 | 0.535 | 0.680 | 0.689 | 0.947 | 0.811 | 0.644 | 0.743 | |||
| CLM5 | [-] | 178. | 178. | 179. | 169. | -4.32 | 27.3 | 0.588 | 0.684 | 0.689 | 0.942 | 0.801 | 0.637 | 0.740 |
Temporally integrated period mean