Mean State
Download Data |
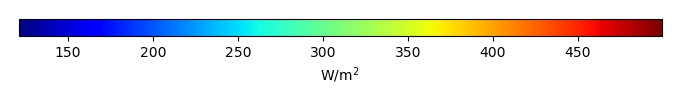
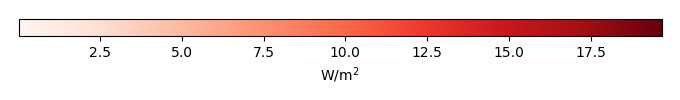
Period Mean (original grids) [W/m2] |
Model Period Mean (intersection) [W/m2] |
Model Period Mean (complement) [W/m2] |
Benchmark Period Mean (intersection) [W/m2] |
Benchmark Period Mean (complement) [W/m2] |
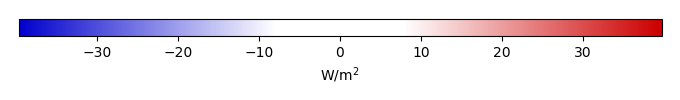
Bias [W/m2] |
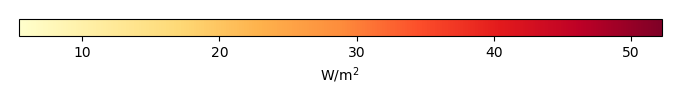
RMSE [W/m2] |
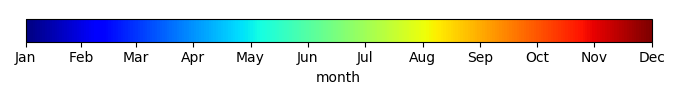
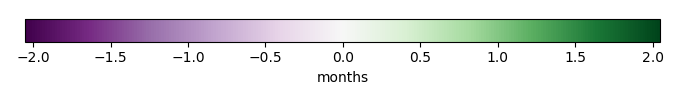
Phase Shift [months] |
Bias Score [1] |
RMSE Score [1] |
Seasonal Cycle Score [1] |
Spatial Distribution Score [1] |
Interannual Variability Score [1] |
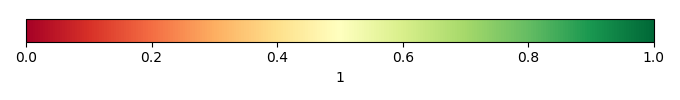
Overall Score [1] |
|||
|---|---|---|---|---|---|---|---|---|---|---|---|---|---|---|---|---|---|
| Benchmark | [-] | 457. | |||||||||||||||
| CLM4 | [-] | 458. | 458. | 456. | 465. | 3.03 | 16.8 | 1.30 | 0.420 | 0.375 | 0.813 | 0.805 | 0.627 | 0.569 | |||
| CLM4.5 | [-] | 462. | 462. | 456. | 465. | 6.98 | 18.2 | 1.33 | 0.381 | 0.371 | 0.806 | 0.828 | 0.627 | 0.564 | |||
| CLM5 | [-] | 464. | 464. | 456. | 465. | 8.32 | 17.6 | 1.41 | 0.418 | 0.377 | 0.802 | 0.875 | 0.618 | 0.578 |
Download Data |
Period Mean (original grids) [W/m2] |
Model Period Mean (intersection) [W/m2] |
Model Period Mean (complement) [W/m2] |
Benchmark Period Mean (intersection) [W/m2] |
Benchmark Period Mean (complement) [W/m2] |
Bias [W/m2] |
RMSE [W/m2] |
Phase Shift [months] |
Bias Score [1] |
RMSE Score [1] |
Seasonal Cycle Score [1] |
Spatial Distribution Score [1] |
Interannual Variability Score [1] |
Overall Score [1] |
|||
|---|---|---|---|---|---|---|---|---|---|---|---|---|---|---|---|---|---|
| Benchmark | [-] | 466. | |||||||||||||||
| CLM4 | [-] | 480. | 480. | 467. | 458. | 13.8 | 22.7 | 0.636 | 0.507 | 0.482 | 0.946 | 0.977 | 0.672 | 0.678 | |||
| CLM4.5 | [-] | 485. | 485. | 467. | 458. | 18.7 | 25.1 | 0.646 | 0.429 | 0.489 | 0.941 | 0.999 | 0.662 | 0.668 | |||
| CLM5 | [-] | 487. | 487. | 467. | 458. | 20.4 | 26.5 | 0.743 | 0.408 | 0.483 | 0.931 | 1.00 | 0.639 | 0.658 |
Download Data |
Period Mean (original grids) [W/m2] |
Model Period Mean (intersection) [W/m2] |
Model Period Mean (complement) [W/m2] |
Benchmark Period Mean (intersection) [W/m2] |
Benchmark Period Mean (complement) [W/m2] |
Bias [W/m2] |
RMSE [W/m2] |
Phase Shift [months] |
Bias Score [1] |
RMSE Score [1] |
Seasonal Cycle Score [1] |
Spatial Distribution Score [1] |
Interannual Variability Score [1] |
Overall Score [1] |
|||
|---|---|---|---|---|---|---|---|---|---|---|---|---|---|---|---|---|---|
| Benchmark | [-] | 443. | |||||||||||||||
| CLM4 | [-] | 446. | 446. | 443. | 446. | 4.22 | 18.5 | 1.00 | 0.556 | 0.494 | 0.872 | 0.969 | 0.657 | 0.673 | |||
| CLM4.5 | [-] | 452. | 452. | 443. | 446. | 9.23 | 19.1 | 1.06 | 0.544 | 0.487 | 0.868 | 0.980 | 0.668 | 0.672 | |||
| CLM5 | [-] | 450. | 450. | 443. | 446. | 7.78 | 19.3 | 1.24 | 0.555 | 0.474 | 0.846 | 0.990 | 0.625 | 0.661 |
Download Data |
Period Mean (original grids) [W/m2] |
Model Period Mean (intersection) [W/m2] |
Model Period Mean (complement) [W/m2] |
Benchmark Period Mean (intersection) [W/m2] |
Benchmark Period Mean (complement) [W/m2] |
Bias [W/m2] |
RMSE [W/m2] |
Phase Shift [months] |
Bias Score [1] |
RMSE Score [1] |
Seasonal Cycle Score [1] |
Spatial Distribution Score [1] |
Interannual Variability Score [1] |
Overall Score [1] |
|||
|---|---|---|---|---|---|---|---|---|---|---|---|---|---|---|---|---|---|
| Benchmark | [-] | 279. | |||||||||||||||
| CLM4 | [-] | 260. | 260. | 278. | 296. | -15.8 | 23.6 | 0.135 | 0.784 | 0.768 | 0.989 | 0.993 | 0.744 | 0.841 | |||
| CLM4.5 | [-] | 262. | 262. | 278. | 296. | -14.5 | 21.5 | 0.132 | 0.798 | 0.785 | 0.990 | 0.991 | 0.721 | 0.845 | |||
| CLM5 | [-] | 268. | 268. | 278. | 296. | -8.32 | 17.5 | 0.132 | 0.864 | 0.798 | 0.990 | 0.996 | 0.712 | 0.860 |
Download Data |
Period Mean (original grids) [W/m2] |
Model Period Mean (intersection) [W/m2] |
Model Period Mean (complement) [W/m2] |
Benchmark Period Mean (intersection) [W/m2] |
Benchmark Period Mean (complement) [W/m2] |
Bias [W/m2] |
RMSE [W/m2] |
Phase Shift [months] |
Bias Score [1] |
RMSE Score [1] |
Seasonal Cycle Score [1] |
Spatial Distribution Score [1] |
Interannual Variability Score [1] |
Overall Score [1] |
|||
|---|---|---|---|---|---|---|---|---|---|---|---|---|---|---|---|---|---|
| Benchmark | [-] | 457. | |||||||||||||||
| CLM4 | [-] | 450. | 450. | 454. | 467. | -1.91 | 13.4 | 1.90 | 0.372 | 0.372 | 0.704 | 0.899 | 0.550 | 0.545 | |||
| CLM4.5 | [-] | 452. | 452. | 454. | 467. | -0.886 | 13.6 | 1.88 | 0.350 | 0.376 | 0.709 | 0.891 | 0.545 | 0.541 | |||
| CLM5 | [-] | 457. | 457. | 454. | 467. | 3.95 | 14.6 | 1.88 | 0.299 | 0.374 | 0.709 | 0.916 | 0.540 | 0.535 |
Download Data |
Period Mean (original grids) [W/m2] |
Model Period Mean (intersection) [W/m2] |
Model Period Mean (complement) [W/m2] |
Benchmark Period Mean (intersection) [W/m2] |
Benchmark Period Mean (complement) [W/m2] |
Bias [W/m2] |
RMSE [W/m2] |
Phase Shift [months] |
Bias Score [1] |
RMSE Score [1] |
Seasonal Cycle Score [1] |
Spatial Distribution Score [1] |
Interannual Variability Score [1] |
Overall Score [1] |
|||
|---|---|---|---|---|---|---|---|---|---|---|---|---|---|---|---|---|---|
| Benchmark | [-] | 312. | |||||||||||||||
| CLM4 | [-] | 304. | 304. | 311. | 334. | -7.50 | 12.3 | 0.0422 | 0.892 | 0.869 | 0.997 | 0.995 | 0.863 | 0.914 | |||
| CLM4.5 | [-] | 304. | 304. | 311. | 334. | -7.01 | 12.3 | 0.0406 | 0.896 | 0.868 | 0.997 | 0.996 | 0.864 | 0.915 | |||
| CLM5 | [-] | 311. | 310. | 311. | 334. | -0.679 | 9.44 | 0.0515 | 0.942 | 0.887 | 0.997 | 0.995 | 0.858 | 0.928 |
Download Data |
Period Mean (original grids) [W/m2] |
Model Period Mean (intersection) [W/m2] |
Model Period Mean (complement) [W/m2] |
Benchmark Period Mean (intersection) [W/m2] |
Benchmark Period Mean (complement) [W/m2] |
Bias [W/m2] |
RMSE [W/m2] |
Phase Shift [months] |
Bias Score [1] |
RMSE Score [1] |
Seasonal Cycle Score [1] |
Spatial Distribution Score [1] |
Interannual Variability Score [1] |
Overall Score [1] |
|||
|---|---|---|---|---|---|---|---|---|---|---|---|---|---|---|---|---|---|
| Benchmark | [-] | 364. | |||||||||||||||
| CLM4 | [-] | 357. | 357. | 363. | 399. | -4.21 | 14.3 | 0.128 | 0.851 | 0.820 | 0.990 | 0.999 | 0.815 | 0.882 | |||
| CLM4.5 | [-] | 358. | 357. | 363. | 399. | -3.48 | 14.3 | 0.116 | 0.852 | 0.819 | 0.991 | 1.00 | 0.815 | 0.883 | |||
| CLM5 | [-] | 363. | 362. | 363. | 399. | 0.922 | 14.0 | 0.225 | 0.861 | 0.822 | 0.982 | 0.999 | 0.799 | 0.881 |
Download Data |
Period Mean (original grids) [W/m2] |
Model Period Mean (intersection) [W/m2] |
Model Period Mean (complement) [W/m2] |
Benchmark Period Mean (intersection) [W/m2] |
Benchmark Period Mean (complement) [W/m2] |
Bias [W/m2] |
RMSE [W/m2] |
Phase Shift [months] |
Bias Score [1] |
RMSE Score [1] |
Seasonal Cycle Score [1] |
Spatial Distribution Score [1] |
Interannual Variability Score [1] |
Overall Score [1] |
|||
|---|---|---|---|---|---|---|---|---|---|---|---|---|---|---|---|---|---|
| Benchmark | [-] | 448. | |||||||||||||||
| CLM4 | [-] | 453. | 453. | 446. | 467. | 8.82 | 19.0 | 0.579 | 0.574 | 0.568 | 0.947 | 0.998 | 0.707 | 0.727 | |||
| CLM4.5 | [-] | 457. | 457. | 446. | 467. | 12.5 | 20.9 | 0.590 | 0.525 | 0.567 | 0.945 | 0.999 | 0.705 | 0.718 | |||
| CLM5 | [-] | 459. | 459. | 446. | 467. | 14.4 | 21.7 | 0.742 | 0.511 | 0.565 | 0.925 | 0.999 | 0.673 | 0.706 |
Download Data |
Period Mean (original grids) [W/m2] |
Model Period Mean (intersection) [W/m2] |
Model Period Mean (complement) [W/m2] |
Benchmark Period Mean (intersection) [W/m2] |
Benchmark Period Mean (complement) [W/m2] |
Bias [W/m2] |
RMSE [W/m2] |
Phase Shift [months] |
Bias Score [1] |
RMSE Score [1] |
Seasonal Cycle Score [1] |
Spatial Distribution Score [1] |
Interannual Variability Score [1] |
Overall Score [1] |
|||
|---|---|---|---|---|---|---|---|---|---|---|---|---|---|---|---|---|---|
| Benchmark | [-] | 281. | |||||||||||||||
| CLM4 | [-] | 268. | 268. | 281. | 288. | -12.4 | 21.7 | 0.0955 | 0.817 | 0.744 | 0.992 | 0.982 | 0.795 | 0.846 | |||
| CLM4.5 | [-] | 268. | 268. | 281. | 288. | -12.4 | 19.4 | 0.136 | 0.816 | 0.775 | 0.989 | 0.982 | 0.772 | 0.852 | |||
| CLM5 | [-] | 275. | 276. | 281. | 288. | -4.81 | 13.7 | 0.101 | 0.908 | 0.810 | 0.992 | 0.990 | 0.775 | 0.881 |
Download Data |
Period Mean (original grids) [W/m2] |
Model Period Mean (intersection) [W/m2] |
Model Period Mean (complement) [W/m2] |
Benchmark Period Mean (intersection) [W/m2] |
Benchmark Period Mean (complement) [W/m2] |
Bias [W/m2] |
RMSE [W/m2] |
Phase Shift [months] |
Bias Score [1] |
RMSE Score [1] |
Seasonal Cycle Score [1] |
Spatial Distribution Score [1] |
Interannual Variability Score [1] |
Overall Score [1] |
|||
|---|---|---|---|---|---|---|---|---|---|---|---|---|---|---|---|---|---|
| Benchmark | [-] | 441. | |||||||||||||||
| CLM4 | [-] | 447. | 447. | 443. | 426. | 1.56 | 13.2 | 0.363 | 0.787 | 0.700 | 0.968 | 0.971 | 0.831 | 0.826 | |||
| CLM4.5 | [-] | 447. | 447. | 443. | 426. | 1.85 | 13.5 | 0.356 | 0.778 | 0.696 | 0.969 | 0.969 | 0.826 | 0.822 | |||
| CLM5 | [-] | 449. | 449. | 443. | 426. | 3.69 | 13.5 | 0.384 | 0.781 | 0.695 | 0.968 | 0.978 | 0.802 | 0.820 |
Download Data |
Period Mean (original grids) [W/m2] |
Model Period Mean (intersection) [W/m2] |
Model Period Mean (complement) [W/m2] |
Benchmark Period Mean (intersection) [W/m2] |
Benchmark Period Mean (complement) [W/m2] |
Bias [W/m2] |
RMSE [W/m2] |
Phase Shift [months] |
Bias Score [1] |
RMSE Score [1] |
Seasonal Cycle Score [1] |
Spatial Distribution Score [1] |
Interannual Variability Score [1] |
Overall Score [1] |
|||
|---|---|---|---|---|---|---|---|---|---|---|---|---|---|---|---|---|---|
| Benchmark | [-] | 368. | |||||||||||||||
| CLM4 | [-] | 358. | 358. | 366. | 389. | -4.71 | 13.8 | 0.275 | 0.814 | 0.749 | 0.982 | 0.989 | 0.820 | 0.850 | |||
| CLM4.5 | [-] | 358. | 358. | 366. | 389. | -5.26 | 13.3 | 0.253 | 0.807 | 0.761 | 0.983 | 0.993 | 0.820 | 0.854 | |||
| CLM5 | [-] | 362. | 363. | 366. | 389. | -0.870 | 12.0 | 0.447 | 0.850 | 0.768 | 0.970 | 0.998 | 0.797 | 0.859 |
Download Data |
Period Mean (original grids) [W/m2] |
Model Period Mean (intersection) [W/m2] |
Model Period Mean (complement) [W/m2] |
Benchmark Period Mean (intersection) [W/m2] |
Benchmark Period Mean (complement) [W/m2] |
Bias [W/m2] |
RMSE [W/m2] |
Phase Shift [months] |
Bias Score [1] |
RMSE Score [1] |
Seasonal Cycle Score [1] |
Spatial Distribution Score [1] |
Interannual Variability Score [1] |
Overall Score [1] |
|||
|---|---|---|---|---|---|---|---|---|---|---|---|---|---|---|---|---|---|
| Benchmark | [-] | 399. | |||||||||||||||
| CLM4 | [-] | 373. | 373. | 376. | 409. | -1.28 | 16.7 | 0.501 | 0.705 | 0.668 | 0.944 | 0.996 | 0.707 | 0.781 | |||
| CLM4.5 | [-] | 375. | 375. | 376. | 409. | -0.0436 | 17.0 | 0.506 | 0.694 | 0.666 | 0.944 | 0.995 | 0.705 | 0.778 | |||
| CLM5 | [-] | 378. | 378. | 376. | 409. | 3.26 | 16.3 | 0.561 | 0.710 | 0.671 | 0.939 | 0.996 | 0.688 | 0.779 |
Download Data |
Period Mean (original grids) [W/m2] |
Model Period Mean (intersection) [W/m2] |
Model Period Mean (complement) [W/m2] |
Benchmark Period Mean (intersection) [W/m2] |
Benchmark Period Mean (complement) [W/m2] |
Bias [W/m2] |
RMSE [W/m2] |
Phase Shift [months] |
Bias Score [1] |
RMSE Score [1] |
Seasonal Cycle Score [1] |
Spatial Distribution Score [1] |
Interannual Variability Score [1] |
Overall Score [1] |
|||
|---|---|---|---|---|---|---|---|---|---|---|---|---|---|---|---|---|---|
| Benchmark | [-] | 450. | |||||||||||||||
| CLM4 | [-] | 455. | 455. | 450. | 446. | 5.46 | 16.3 | 0.342 | 0.814 | 0.762 | 0.973 | 0.988 | 0.725 | 0.837 | |||
| CLM4.5 | [-] | 455. | 455. | 450. | 446. | 5.39 | 16.4 | 0.340 | 0.814 | 0.760 | 0.974 | 0.989 | 0.722 | 0.836 | |||
| CLM5 | [-] | 457. | 457. | 450. | 446. | 6.78 | 16.8 | 0.377 | 0.805 | 0.758 | 0.971 | 0.993 | 0.705 | 0.832 |
Download Data |
Period Mean (original grids) [W/m2] |
Model Period Mean (intersection) [W/m2] |
Model Period Mean (complement) [W/m2] |
Benchmark Period Mean (intersection) [W/m2] |
Benchmark Period Mean (complement) [W/m2] |
Bias [W/m2] |
RMSE [W/m2] |
Phase Shift [months] |
Bias Score [1] |
RMSE Score [1] |
Seasonal Cycle Score [1] |
Spatial Distribution Score [1] |
Interannual Variability Score [1] |
Overall Score [1] |
|||
|---|---|---|---|---|---|---|---|---|---|---|---|---|---|---|---|---|---|
| Benchmark | [-] | 281. | |||||||||||||||
| CLM4 | [-] | 271. | 271. | 281. | 293. | -10.3 | 18.2 | 0.200 | 0.835 | 0.784 | 0.984 | 0.984 | 0.711 | 0.847 | |||
| CLM4.5 | [-] | 272. | 272. | 281. | 293. | -9.92 | 17.8 | 0.194 | 0.839 | 0.788 | 0.984 | 0.984 | 0.705 | 0.848 | |||
| CLM5 | [-] | 278. | 278. | 281. | 293. | -3.57 | 15.7 | 0.202 | 0.897 | 0.790 | 0.984 | 0.987 | 0.708 | 0.860 |
Download Data |
Period Mean (original grids) [W/m2] |
Model Period Mean (intersection) [W/m2] |
Model Period Mean (complement) [W/m2] |
Benchmark Period Mean (intersection) [W/m2] |
Benchmark Period Mean (complement) [W/m2] |
Bias [W/m2] |
RMSE [W/m2] |
Phase Shift [months] |
Bias Score [1] |
RMSE Score [1] |
Seasonal Cycle Score [1] |
Spatial Distribution Score [1] |
Interannual Variability Score [1] |
Overall Score [1] |
|||
|---|---|---|---|---|---|---|---|---|---|---|---|---|---|---|---|---|---|
| Benchmark | [-] | 442. | |||||||||||||||
| CLM4 | [-] | 446. | 445. | 439. | 459. | 11.0 | 19.8 | 0.839 | 0.501 | 0.529 | 0.893 | 0.992 | 0.725 | 0.695 | |||
| CLM4.5 | [-] | 444. | 444. | 439. | 459. | 9.15 | 18.6 | 0.833 | 0.526 | 0.535 | 0.891 | 0.999 | 0.724 | 0.702 | |||
| CLM5 | [-] | 446. | 446. | 439. | 459. | 11.3 | 19.0 | 0.815 | 0.506 | 0.547 | 0.900 | 0.996 | 0.695 | 0.699 |
Download Data |
Period Mean (original grids) [W/m2] |
Model Period Mean (intersection) [W/m2] |
Model Period Mean (complement) [W/m2] |
Benchmark Period Mean (intersection) [W/m2] |
Benchmark Period Mean (complement) [W/m2] |
Bias [W/m2] |
RMSE [W/m2] |
Phase Shift [months] |
Bias Score [1] |
RMSE Score [1] |
Seasonal Cycle Score [1] |
Spatial Distribution Score [1] |
Interannual Variability Score [1] |
Overall Score [1] |
|||
|---|---|---|---|---|---|---|---|---|---|---|---|---|---|---|---|---|---|
| Benchmark | [-] | 386. | |||||||||||||||
| CLM4 | [-] | 381. | 381. | 384. | 429. | -0.942 | 9.59 | 0.124 | 0.893 | 0.847 | 0.991 | 0.987 | 0.887 | 0.909 | |||
| CLM4.5 | [-] | 382. | 382. | 384. | 429. | 0.154 | 10.0 | 0.112 | 0.893 | 0.842 | 0.992 | 0.989 | 0.887 | 0.907 | |||
| CLM5 | [-] | 388. | 388. | 384. | 429. | 6.07 | 11.6 | 0.309 | 0.860 | 0.847 | 0.979 | 0.988 | 0.872 | 0.899 |
Download Data |
Period Mean (original grids) [W/m2] |
Model Period Mean (intersection) [W/m2] |
Model Period Mean (complement) [W/m2] |
Benchmark Period Mean (intersection) [W/m2] |
Benchmark Period Mean (complement) [W/m2] |
Bias [W/m2] |
RMSE [W/m2] |
Phase Shift [months] |
Bias Score [1] |
RMSE Score [1] |
Seasonal Cycle Score [1] |
Spatial Distribution Score [1] |
Interannual Variability Score [1] |
Overall Score [1] |
|||
|---|---|---|---|---|---|---|---|---|---|---|---|---|---|---|---|---|---|
| Benchmark | [-] | 324. | |||||||||||||||
| CLM4 | [-] | 315. | 316. | 323. | 347. | -6.68 | 11.5 | 0.0546 | 0.871 | 0.845 | 0.996 | 0.997 | 0.795 | 0.891 | |||
| CLM4.5 | [-] | 316. | 316. | 323. | 347. | -5.85 | 11.4 | 0.0600 | 0.878 | 0.842 | 0.996 | 0.999 | 0.786 | 0.891 | |||
| CLM5 | [-] | 323. | 323. | 323. | 347. | 0.502 | 10.9 | 0.135 | 0.914 | 0.839 | 0.991 | 0.989 | 0.783 | 0.892 |
Download Data |
Period Mean (original grids) [W/m2] |
Model Period Mean (intersection) [W/m2] |
Model Period Mean (complement) [W/m2] |
Benchmark Period Mean (intersection) [W/m2] |
Benchmark Period Mean (complement) [W/m2] |
Bias [W/m2] |
RMSE [W/m2] |
Phase Shift [months] |
Bias Score [1] |
RMSE Score [1] |
Seasonal Cycle Score [1] |
Spatial Distribution Score [1] |
Interannual Variability Score [1] |
Overall Score [1] |
|||
|---|---|---|---|---|---|---|---|---|---|---|---|---|---|---|---|---|---|
| Benchmark | [-] | 377. | |||||||||||||||
| CLM4 | [-] | 373. | 374. | 377. | 378. | -2.73 | 14.9 | 0.0869 | 0.823 | 0.811 | 0.994 | 0.964 | 0.825 | 0.871 | |||
| CLM4.5 | [-] | 374. | 375. | 377. | 378. | -2.11 | 15.1 | 0.0899 | 0.822 | 0.807 | 0.994 | 0.968 | 0.836 | 0.872 | |||
| CLM5 | [-] | 378. | 379. | 377. | 378. | 2.18 | 14.4 | 0.110 | 0.837 | 0.809 | 0.993 | 0.983 | 0.796 | 0.871 |
Download Data |
Period Mean (original grids) [W/m2] |
Model Period Mean (intersection) [W/m2] |
Model Period Mean (complement) [W/m2] |
Benchmark Period Mean (intersection) [W/m2] |
Benchmark Period Mean (complement) [W/m2] |
Bias [W/m2] |
RMSE [W/m2] |
Phase Shift [months] |
Bias Score [1] |
RMSE Score [1] |
Seasonal Cycle Score [1] |
Spatial Distribution Score [1] |
Interannual Variability Score [1] |
Overall Score [1] |
|||
|---|---|---|---|---|---|---|---|---|---|---|---|---|---|---|---|---|---|
| Benchmark | [-] | 449. | |||||||||||||||
| CLM4 | [-] | 453. | 453. | 449. | 463. | 4.25 | 13.2 | 1.08 | 0.414 | 0.403 | 0.859 | 0.887 | 0.684 | 0.608 | |||
| CLM4.5 | [-] | 455. | 455. | 449. | 463. | 6.56 | 14.3 | 1.07 | 0.359 | 0.399 | 0.860 | 0.888 | 0.688 | 0.599 | |||
| CLM5 | [-] | 456. | 456. | 449. | 463. | 7.54 | 14.0 | 1.07 | 0.347 | 0.406 | 0.861 | 0.951 | 0.666 | 0.606 |
Download Data |
Period Mean (original grids) [W/m2] |
Model Period Mean (intersection) [W/m2] |
Model Period Mean (complement) [W/m2] |
Benchmark Period Mean (intersection) [W/m2] |
Benchmark Period Mean (complement) [W/m2] |
Bias [W/m2] |
RMSE [W/m2] |
Phase Shift [months] |
Bias Score [1] |
RMSE Score [1] |
Seasonal Cycle Score [1] |
Spatial Distribution Score [1] |
Interannual Variability Score [1] |
Overall Score [1] |
|||
|---|---|---|---|---|---|---|---|---|---|---|---|---|---|---|---|---|---|
| Benchmark | [-] | 443. | |||||||||||||||
| CLM4 | [-] | 445. | 444. | 443. | 434. | 0.796 | 15.0 | 0.770 | 0.666 | 0.563 | 0.890 | 0.971 | 0.731 | 0.731 | |||
| CLM4.5 | [-] | 447. | 447. | 443. | 434. | 3.31 | 15.4 | 0.843 | 0.648 | 0.560 | 0.880 | 0.961 | 0.739 | 0.725 | |||
| CLM5 | [-] | 449. | 449. | 443. | 434. | 4.97 | 13.9 | 0.865 | 0.701 | 0.569 | 0.878 | 0.995 | 0.694 | 0.734 |
Download Data |
Period Mean (original grids) [W/m2] |
Model Period Mean (intersection) [W/m2] |
Model Period Mean (complement) [W/m2] |
Benchmark Period Mean (intersection) [W/m2] |
Benchmark Period Mean (complement) [W/m2] |
Bias [W/m2] |
RMSE [W/m2] |
Phase Shift [months] |
Bias Score [1] |
RMSE Score [1] |
Seasonal Cycle Score [1] |
Spatial Distribution Score [1] |
Interannual Variability Score [1] |
Overall Score [1] |
|||
|---|---|---|---|---|---|---|---|---|---|---|---|---|---|---|---|---|---|
| Benchmark | [-] | 383. | |||||||||||||||
| CLM4 | [-] | 380. | 378. | 381. | 396. | -1.53 | 21.1 | 0.906 | 0.615 | 0.560 | 0.887 | 0.995 | 0.664 | 0.714 | |||
| CLM4.5 | [-] | 382. | 381. | 381. | 396. | 0.459 | 21.0 | 0.916 | 0.621 | 0.558 | 0.886 | 0.996 | 0.670 | 0.715 | |||
| CLM5 | [-] | 383. | 383. | 381. | 396. | 2.21 | 20.5 | 0.925 | 0.629 | 0.567 | 0.883 | 0.999 | 0.649 | 0.716 |
Temporally integrated period mean