Mean State
Download Data |
Period Mean (original grids) [Pg yr-1] |
Model Period Mean (intersection) [Pg yr-1] |
Model Period Mean (complement) [Pg yr-1] |
Benchmark Period Mean (intersection) [Pg yr-1] |
Benchmark Period Mean (complement) [Pg yr-1] |
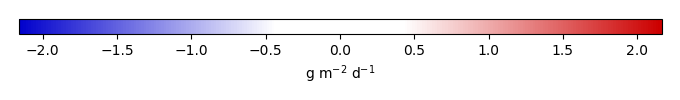
Bias [g m-2 d-1] |
RMSE [g m-2 d-1] |
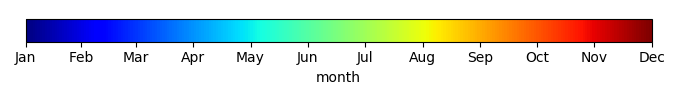
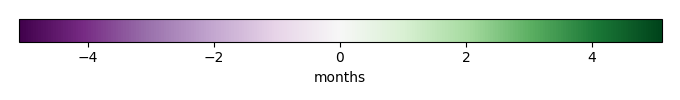
Phase Shift [months] |
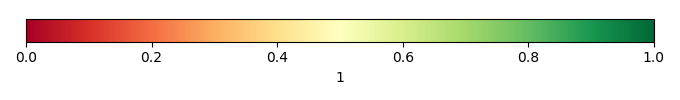
Bias Score [1] |
RMSE Score [1] |
Seasonal Cycle Score [1] |
Spatial Distribution Score [1] |
Overall Score [1] |
|||
|---|---|---|---|---|---|---|---|---|---|---|---|---|---|---|---|---|
| Benchmark | [-] | 8.19 | ||||||||||||||
| CRUNCEPv7 | [-] | 7.91 | 8.09 | 0.242 | 8.18 | 0.00755 | 0.0945 | 1.74 | 2.11 | 0.337 | 0.236 | 0.583 | 0.983 | 0.475 | ||
| GSWP3v1 | [-] | 8.09 | 8.27 | 0.255 | 8.18 | 0.00755 | 0.208 | 1.54 | 2.16 | 0.353 | 0.275 | 0.598 | 0.985 | 0.497 | ||
| WFDEI | [-] | 8.45 | 8.66 | 0.236 | 8.18 | 0.00755 | 0.447 | 1.38 | 2.17 | 0.329 | 0.355 | 0.597 | 0.988 | 0.525 |
Download Data |
Period Mean (original grids) [Pg yr-1] |
Model Period Mean (intersection) [Pg yr-1] |
Model Period Mean (complement) [Pg yr-1] |
Benchmark Period Mean (intersection) [Pg yr-1] |
Benchmark Period Mean (complement) [Pg yr-1] |
Bias [g m-2 d-1] |
RMSE [g m-2 d-1] |
Phase Shift [months] |
Bias Score [1] |
RMSE Score [1] |
Seasonal Cycle Score [1] |
Spatial Distribution Score [1] |
Overall Score [1] |
|||
|---|---|---|---|---|---|---|---|---|---|---|---|---|---|---|---|---|
| Benchmark | [-] | 5.55 | ||||||||||||||
| CRUNCEPv7 | [-] | 8.74 | 8.32 | 0.0344 | 5.55 | 0.00508 | 1.14 | 2.16 | 0.756 | 0.462 | 0.341 | 0.891 | 0.929 | 0.593 | ||
| GSWP3v1 | [-] | 9.34 | 8.89 | 0.0339 | 5.55 | 0.00508 | 1.37 | 2.10 | 0.781 | 0.419 | 0.400 | 0.889 | 0.920 | 0.606 | ||
| WFDEI | [-] | 8.85 | 8.40 | 0.0311 | 5.55 | 0.00508 | 1.17 | 1.88 | 0.787 | 0.466 | 0.438 | 0.870 | 0.933 | 0.629 |
Download Data |
Period Mean (original grids) [Pg yr-1] |
Model Period Mean (intersection) [Pg yr-1] |
Model Period Mean (complement) [Pg yr-1] |
Benchmark Period Mean (intersection) [Pg yr-1] |
Benchmark Period Mean (complement) [Pg yr-1] |
Bias [g m-2 d-1] |
RMSE [g m-2 d-1] |
Phase Shift [months] |
Bias Score [1] |
RMSE Score [1] |
Seasonal Cycle Score [1] |
Spatial Distribution Score [1] |
Overall Score [1] |
|||
|---|---|---|---|---|---|---|---|---|---|---|---|---|---|---|---|---|
| Benchmark | [-] | 9.94 | ||||||||||||||
| CRUNCEPv7 | [-] | 11.8 | 11.3 | 0.393 | 9.92 | 0.0215 | 0.578 | 1.77 | 0.684 | 0.553 | 0.409 | 0.933 | 0.908 | 0.642 | ||
| GSWP3v1 | [-] | 12.2 | 11.7 | 0.395 | 9.92 | 0.0215 | 0.704 | 1.67 | 0.853 | 0.534 | 0.439 | 0.888 | 0.933 | 0.647 | ||
| WFDEI | [-] | 12.2 | 11.7 | 0.397 | 9.92 | 0.0215 | 0.704 | 1.65 | 0.914 | 0.519 | 0.476 | 0.881 | 0.905 | 0.651 |
Download Data |
Period Mean (original grids) [Pg yr-1] |
Model Period Mean (intersection) [Pg yr-1] |
Model Period Mean (complement) [Pg yr-1] |
Benchmark Period Mean (intersection) [Pg yr-1] |
Benchmark Period Mean (complement) [Pg yr-1] |
Bias [g m-2 d-1] |
RMSE [g m-2 d-1] |
Phase Shift [months] |
Bias Score [1] |
RMSE Score [1] |
Seasonal Cycle Score [1] |
Spatial Distribution Score [1] |
Overall Score [1] |
|||
|---|---|---|---|---|---|---|---|---|---|---|---|---|---|---|---|---|
| Benchmark | [-] | 1.03 | ||||||||||||||
| CRUNCEPv7 | [-] | 1.23 | 1.20 | 0.0379 | 1.03 | 0.00296 | 0.220 | 0.969 | 0.0891 | 0.827 | 0.519 | 0.995 | 0.978 | 0.767 | ||
| GSWP3v1 | [-] | 1.16 | 1.12 | 0.0373 | 1.03 | 0.00296 | 0.156 | 0.799 | 0.130 | 0.849 | 0.582 | 0.991 | 0.964 | 0.794 | ||
| WFDEI | [-] | 0.998 | 0.971 | 0.0320 | 1.03 | 0.00296 | 0.0180 | 0.715 | 0.0593 | 0.855 | 0.609 | 0.997 | 0.968 | 0.808 |
Download Data |
Period Mean (original grids) [Pg yr-1] |
Model Period Mean (intersection) [Pg yr-1] |
Model Period Mean (complement) [Pg yr-1] |
Benchmark Period Mean (intersection) [Pg yr-1] |
Benchmark Period Mean (complement) [Pg yr-1] |
Bias [g m-2 d-1] |
RMSE [g m-2 d-1] |
Phase Shift [months] |
Bias Score [1] |
RMSE Score [1] |
Seasonal Cycle Score [1] |
Spatial Distribution Score [1] |
Overall Score [1] |
|||
|---|---|---|---|---|---|---|---|---|---|---|---|---|---|---|---|---|
| Benchmark | [-] | 7.13 | ||||||||||||||
| CRUNCEPv7 | [-] | 8.11 | 6.84 | 1.23 | 6.94 | 0.197 | 2.06 | 2.34 | 1.74 | 0.232 | 0.303 | 0.784 | 0.535 | 0.431 | ||
| GSWP3v1 | [-] | 7.22 | 6.06 | 1.12 | 6.94 | 0.197 | 1.11 | 2.09 | 2.40 | 0.184 | 0.263 | 0.637 | 0.458 | 0.361 | ||
| WFDEI | [-] | 7.53 | 6.34 | 1.15 | 6.94 | 0.197 | 1.44 | 2.16 | 2.10 | 0.190 | 0.265 | 0.702 | 0.532 | 0.391 |
Download Data |
Period Mean (original grids) [Pg yr-1] |
Model Period Mean (intersection) [Pg yr-1] |
Model Period Mean (complement) [Pg yr-1] |
Benchmark Period Mean (intersection) [Pg yr-1] |
Benchmark Period Mean (complement) [Pg yr-1] |
Bias [g m-2 d-1] |
RMSE [g m-2 d-1] |
Phase Shift [months] |
Bias Score [1] |
RMSE Score [1] |
Seasonal Cycle Score [1] |
Spatial Distribution Score [1] |
Overall Score [1] |
|||
|---|---|---|---|---|---|---|---|---|---|---|---|---|---|---|---|---|
| Benchmark | [-] | 6.86 | ||||||||||||||
| CRUNCEPv7 | [-] | 7.79 | 7.54 | 0.0700 | 6.85 | 0.00296 | 0.240 | 1.36 | 0.609 | 0.848 | 0.627 | 0.955 | 0.986 | 0.809 | ||
| GSWP3v1 | [-] | 7.14 | 6.91 | 0.0652 | 6.85 | 0.00296 | 0.0432 | 1.10 | 0.607 | 0.873 | 0.685 | 0.958 | 0.962 | 0.833 | ||
| WFDEI | [-] | 7.30 | 7.06 | 0.0623 | 6.85 | 0.00296 | 0.0904 | 1.09 | 0.528 | 0.868 | 0.687 | 0.963 | 0.894 | 0.820 |
Download Data |
Period Mean (original grids) [Pg yr-1] |
Model Period Mean (intersection) [Pg yr-1] |
Model Period Mean (complement) [Pg yr-1] |
Benchmark Period Mean (intersection) [Pg yr-1] |
Benchmark Period Mean (complement) [Pg yr-1] |
Bias [g m-2 d-1] |
RMSE [g m-2 d-1] |
Phase Shift [months] |
Bias Score [1] |
RMSE Score [1] |
Seasonal Cycle Score [1] |
Spatial Distribution Score [1] |
Overall Score [1] |
|||
|---|---|---|---|---|---|---|---|---|---|---|---|---|---|---|---|---|
| Benchmark | [-] | 10.1 | ||||||||||||||
| CRUNCEPv7 | [-] | 9.09 | 8.89 | 0.318 | 10.0 | 0.0375 | -0.0956 | 0.736 | 0.692 | 0.764 | 0.682 | 0.977 | 0.970 | 0.815 | ||
| GSWP3v1 | [-] | 8.54 | 8.35 | 0.290 | 10.0 | 0.0375 | -0.186 | 0.743 | 0.725 | 0.726 | 0.688 | 0.973 | 0.946 | 0.804 | ||
| WFDEI | [-] | 9.08 | 8.88 | 0.298 | 10.0 | 0.0375 | -0.103 | 0.733 | 0.707 | 0.748 | 0.690 | 0.974 | 0.951 | 0.811 |
Download Data |
Period Mean (original grids) [Pg yr-1] |
Model Period Mean (intersection) [Pg yr-1] |
Model Period Mean (complement) [Pg yr-1] |
Benchmark Period Mean (intersection) [Pg yr-1] |
Benchmark Period Mean (complement) [Pg yr-1] |
Bias [g m-2 d-1] |
RMSE [g m-2 d-1] |
Phase Shift [months] |
Bias Score [1] |
RMSE Score [1] |
Seasonal Cycle Score [1] |
Spatial Distribution Score [1] |
Overall Score [1] |
|||
|---|---|---|---|---|---|---|---|---|---|---|---|---|---|---|---|---|
| Benchmark | [-] | 8.37 | ||||||||||||||
| CRUNCEPv7 | [-] | 9.42 | 8.73 | 0.570 | 8.32 | 0.0454 | 0.692 | 1.71 | 1.03 | 0.487 | 0.464 | 0.882 | 0.932 | 0.646 | ||
| GSWP3v1 | [-] | 9.14 | 8.49 | 0.535 | 8.32 | 0.0454 | 0.561 | 1.48 | 1.19 | 0.549 | 0.493 | 0.847 | 0.955 | 0.667 | ||
| WFDEI | [-] | 9.30 | 8.65 | 0.534 | 8.32 | 0.0454 | 0.619 | 1.46 | 1.28 | 0.565 | 0.477 | 0.824 | 0.965 | 0.662 |
Download Data |
Period Mean (original grids) [Pg yr-1] |
Model Period Mean (intersection) [Pg yr-1] |
Model Period Mean (complement) [Pg yr-1] |
Benchmark Period Mean (intersection) [Pg yr-1] |
Benchmark Period Mean (complement) [Pg yr-1] |
Bias [g m-2 d-1] |
RMSE [g m-2 d-1] |
Phase Shift [months] |
Bias Score [1] |
RMSE Score [1] |
Seasonal Cycle Score [1] |
Spatial Distribution Score [1] |
Overall Score [1] |
|||
|---|---|---|---|---|---|---|---|---|---|---|---|---|---|---|---|---|
| Benchmark | [-] | 1.28 | ||||||||||||||
| CRUNCEPv7 | [-] | 1.38 | 1.40 | 0.0223 | 1.28 | 0.00137 | 0.126 | 0.966 | 0.120 | 0.852 | 0.556 | 0.996 | 0.981 | 0.788 | ||
| GSWP3v1 | [-] | 1.28 | 1.30 | 0.0214 | 1.28 | 0.00137 | 0.0458 | 0.789 | 0.0908 | 0.873 | 0.620 | 0.996 | 0.968 | 0.816 | ||
| WFDEI | [-] | 1.04 | 1.06 | 0.0165 | 1.28 | 0.00137 | -0.151 | 0.752 | 0.0789 | 0.839 | 0.632 | 0.998 | 0.947 | 0.810 |
Download Data |
Period Mean (original grids) [Pg yr-1] |
Model Period Mean (intersection) [Pg yr-1] |
Model Period Mean (complement) [Pg yr-1] |
Benchmark Period Mean (intersection) [Pg yr-1] |
Benchmark Period Mean (complement) [Pg yr-1] |
Bias [g m-2 d-1] |
RMSE [g m-2 d-1] |
Phase Shift [months] |
Bias Score [1] |
RMSE Score [1] |
Seasonal Cycle Score [1] |
Spatial Distribution Score [1] |
Overall Score [1] |
|||
|---|---|---|---|---|---|---|---|---|---|---|---|---|---|---|---|---|
| Benchmark | [-] | 3.53 | ||||||||||||||
| CRUNCEPv7 | [-] | 4.86 | 4.36 | 0.471 | 3.49 | 0.0402 | 0.538 | 0.979 | 1.27 | 0.476 | 0.352 | 0.900 | 0.796 | 0.576 | ||
| GSWP3v1 | [-] | 4.85 | 4.34 | 0.469 | 3.49 | 0.0402 | 0.534 | 0.929 | 1.42 | 0.475 | 0.386 | 0.886 | 0.803 | 0.587 | ||
| WFDEI | [-] | 4.95 | 4.45 | 0.460 | 3.49 | 0.0402 | 0.565 | 0.949 | 1.35 | 0.480 | 0.366 | 0.892 | 0.810 | 0.583 |
Download Data |
Period Mean (original grids) [Pg yr-1] |
Model Period Mean (intersection) [Pg yr-1] |
Model Period Mean (complement) [Pg yr-1] |
Benchmark Period Mean (intersection) [Pg yr-1] |
Benchmark Period Mean (complement) [Pg yr-1] |
Bias [g m-2 d-1] |
RMSE [g m-2 d-1] |
Phase Shift [months] |
Bias Score [1] |
RMSE Score [1] |
Seasonal Cycle Score [1] |
Spatial Distribution Score [1] |
Overall Score [1] |
|||
|---|---|---|---|---|---|---|---|---|---|---|---|---|---|---|---|---|
| Benchmark | [-] | 5.29 | ||||||||||||||
| CRUNCEPv7 | [-] | 4.99 | 4.71 | 0.213 | 5.26 | 0.0312 | 0.0744 | 1.33 | 0.304 | 0.778 | 0.653 | 0.980 | 0.874 | 0.787 | ||
| GSWP3v1 | [-] | 4.58 | 4.33 | 0.199 | 5.26 | 0.0312 | -0.138 | 1.20 | 0.250 | 0.762 | 0.693 | 0.984 | 0.836 | 0.794 | ||
| WFDEI | [-] | 4.55 | 4.30 | 0.195 | 5.26 | 0.0312 | -0.161 | 1.16 | 0.226 | 0.770 | 0.703 | 0.986 | 0.832 | 0.799 |
Download Data |
Period Mean (original grids) [Pg yr-1] |
Model Period Mean (intersection) [Pg yr-1] |
Model Period Mean (complement) [Pg yr-1] |
Benchmark Period Mean (intersection) [Pg yr-1] |
Benchmark Period Mean (complement) [Pg yr-1] |
Bias [g m-2 d-1] |
RMSE [g m-2 d-1] |
Phase Shift [months] |
Bias Score [1] |
RMSE Score [1] |
Seasonal Cycle Score [1] |
Spatial Distribution Score [1] |
Overall Score [1] |
|||
|---|---|---|---|---|---|---|---|---|---|---|---|---|---|---|---|---|
| Benchmark | [-] | 119. | ||||||||||||||
| CRUNCEPv7 | [-] | 130. | 124. | 5.70 | 118. | 0.802 | 0.340 | 1.28 | 0.950 | 0.523 | 0.443 | 0.835 | 0.959 | 0.641 | ||
| GSWP3v1 | [-] | 125. | 120. | 5.44 | 118. | 0.802 | 0.234 | 1.18 | 1.01 | 0.494 | 0.462 | 0.811 | 0.966 | 0.639 | ||
| WFDEI | [-] | 127. | 122. | 5.39 | 118. | 0.802 | 0.284 | 1.13 | 0.989 | 0.518 | 0.491 | 0.825 | 0.968 | 0.659 |
Download Data |
Period Mean (original grids) [Pg yr-1] |
Model Period Mean (intersection) [Pg yr-1] |
Model Period Mean (complement) [Pg yr-1] |
Benchmark Period Mean (intersection) [Pg yr-1] |
Benchmark Period Mean (complement) [Pg yr-1] |
Bias [g m-2 d-1] |
RMSE [g m-2 d-1] |
Phase Shift [months] |
Bias Score [1] |
RMSE Score [1] |
Seasonal Cycle Score [1] |
Spatial Distribution Score [1] |
Overall Score [1] |
|||
|---|---|---|---|---|---|---|---|---|---|---|---|---|---|---|---|---|
| Benchmark | [-] | 0.864 | ||||||||||||||
| CRUNCEPv7 | [-] | 0.881 | 0.843 | 0.0483 | 0.859 | 0.00579 | 0.0351 | 0.274 | 2.20 | 0.567 | 0.448 | 0.886 | 0.899 | 0.650 | ||
| GSWP3v1 | [-] | 0.865 | 0.827 | 0.0515 | 0.859 | 0.00579 | 0.0346 | 0.260 | 2.14 | 0.570 | 0.486 | 0.898 | 0.907 | 0.669 | ||
| WFDEI | [-] | 1.11 | 1.06 | 0.0653 | 0.859 | 0.00579 | 0.112 | 0.315 | 2.23 | 0.573 | 0.438 | 0.891 | 0.917 | 0.651 |
Download Data |
Period Mean (original grids) [Pg yr-1] |
Model Period Mean (intersection) [Pg yr-1] |
Model Period Mean (complement) [Pg yr-1] |
Benchmark Period Mean (intersection) [Pg yr-1] |
Benchmark Period Mean (complement) [Pg yr-1] |
Bias [g m-2 d-1] |
RMSE [g m-2 d-1] |
Phase Shift [months] |
Bias Score [1] |
RMSE Score [1] |
Seasonal Cycle Score [1] |
Spatial Distribution Score [1] |
Overall Score [1] |
|||
|---|---|---|---|---|---|---|---|---|---|---|---|---|---|---|---|---|
| Benchmark | [-] | 1.56 | ||||||||||||||
| CRUNCEPv7 | [-] | 1.77 | 1.70 | 0.0458 | 1.55 | 0.00323 | 0.111 | 0.681 | 0.333 | 0.791 | 0.508 | 0.984 | 0.933 | 0.745 | ||
| GSWP3v1 | [-] | 1.65 | 1.59 | 0.0446 | 1.55 | 0.00323 | 0.0591 | 0.531 | 0.266 | 0.829 | 0.590 | 0.988 | 0.964 | 0.792 | ||
| WFDEI | [-] | 1.50 | 1.45 | 0.0374 | 1.55 | 0.00323 | -0.00312 | 0.550 | 0.322 | 0.812 | 0.572 | 0.988 | 0.968 | 0.782 |
Download Data |
Period Mean (original grids) [Pg yr-1] |
Model Period Mean (intersection) [Pg yr-1] |
Model Period Mean (complement) [Pg yr-1] |
Benchmark Period Mean (intersection) [Pg yr-1] |
Benchmark Period Mean (complement) [Pg yr-1] |
Bias [g m-2 d-1] |
RMSE [g m-2 d-1] |
Phase Shift [months] |
Bias Score [1] |
RMSE Score [1] |
Seasonal Cycle Score [1] |
Spatial Distribution Score [1] |
Overall Score [1] |
|||
|---|---|---|---|---|---|---|---|---|---|---|---|---|---|---|---|---|
| Benchmark | [-] | 3.62 | ||||||||||||||
| CRUNCEPv7 | [-] | 4.13 | 3.54 | 0.506 | 3.60 | 0.0267 | 0.926 | 2.04 | 0.849 | 0.335 | 0.384 | 0.891 | 0.873 | 0.573 | ||
| GSWP3v1 | [-] | 4.02 | 3.45 | 0.494 | 3.60 | 0.0267 | 0.786 | 1.76 | 0.951 | 0.414 | 0.408 | 0.870 | 0.923 | 0.605 | ||
| WFDEI | [-] | 4.02 | 3.46 | 0.474 | 3.60 | 0.0267 | 0.804 | 1.72 | 0.875 | 0.450 | 0.398 | 0.882 | 0.928 | 0.611 |
Download Data |
Period Mean (original grids) [Pg yr-1] |
Model Period Mean (intersection) [Pg yr-1] |
Model Period Mean (complement) [Pg yr-1] |
Benchmark Period Mean (intersection) [Pg yr-1] |
Benchmark Period Mean (complement) [Pg yr-1] |
Bias [g m-2 d-1] |
RMSE [g m-2 d-1] |
Phase Shift [months] |
Bias Score [1] |
RMSE Score [1] |
Seasonal Cycle Score [1] |
Spatial Distribution Score [1] |
Overall Score [1] |
|||
|---|---|---|---|---|---|---|---|---|---|---|---|---|---|---|---|---|
| Benchmark | [-] | 5.09 | ||||||||||||||
| CRUNCEPv7 | [-] | 5.03 | 4.81 | 0.137 | 5.09 | 0.00487 | -0.0287 | 1.23 | 0.365 | 0.836 | 0.693 | 0.974 | 0.973 | 0.834 | ||
| GSWP3v1 | [-] | 4.74 | 4.53 | 0.129 | 5.09 | 0.00487 | -0.229 | 1.15 | 0.337 | 0.823 | 0.729 | 0.974 | 0.985 | 0.848 | ||
| WFDEI | [-] | 4.87 | 4.66 | 0.129 | 5.09 | 0.00487 | -0.143 | 1.16 | 0.329 | 0.837 | 0.711 | 0.975 | 0.985 | 0.844 |
Download Data |
Period Mean (original grids) [Pg yr-1] |
Model Period Mean (intersection) [Pg yr-1] |
Model Period Mean (complement) [Pg yr-1] |
Benchmark Period Mean (intersection) [Pg yr-1] |
Benchmark Period Mean (complement) [Pg yr-1] |
Bias [g m-2 d-1] |
RMSE [g m-2 d-1] |
Phase Shift [months] |
Bias Score [1] |
RMSE Score [1] |
Seasonal Cycle Score [1] |
Spatial Distribution Score [1] |
Overall Score [1] |
|||
|---|---|---|---|---|---|---|---|---|---|---|---|---|---|---|---|---|
| Benchmark | [-] | 3.36 | ||||||||||||||
| CRUNCEPv7 | [-] | 4.16 | 4.12 | 0.0617 | 3.34 | 0.0222 | 0.515 | 1.26 | 0.193 | 0.726 | 0.589 | 0.986 | 0.935 | 0.765 | ||
| GSWP3v1 | [-] | 3.71 | 3.68 | 0.0555 | 3.34 | 0.0222 | 0.273 | 0.991 | 0.115 | 0.777 | 0.657 | 0.992 | 0.960 | 0.809 | ||
| WFDEI | [-] | 3.75 | 3.71 | 0.0543 | 3.34 | 0.0222 | 0.288 | 1.05 | 0.107 | 0.781 | 0.637 | 0.993 | 0.974 | 0.804 |
Download Data |
Period Mean (original grids) [Pg yr-1] |
Model Period Mean (intersection) [Pg yr-1] |
Model Period Mean (complement) [Pg yr-1] |
Benchmark Period Mean (intersection) [Pg yr-1] |
Benchmark Period Mean (complement) [Pg yr-1] |
Bias [g m-2 d-1] |
RMSE [g m-2 d-1] |
Phase Shift [months] |
Bias Score [1] |
RMSE Score [1] |
Seasonal Cycle Score [1] |
Spatial Distribution Score [1] |
Overall Score [1] |
|||
|---|---|---|---|---|---|---|---|---|---|---|---|---|---|---|---|---|
| Benchmark | [-] | 1.79 | ||||||||||||||
| CRUNCEPv7 | [-] | 1.44 | 1.52 | 0.0125 | 1.79 | 0.00506 | -0.139 | 0.690 | 0.632 | 0.647 | 0.580 | 0.940 | 0.947 | 0.739 | ||
| GSWP3v1 | [-] | 1.47 | 1.55 | 0.0115 | 1.79 | 0.00506 | -0.114 | 0.690 | 0.663 | 0.645 | 0.584 | 0.939 | 0.943 | 0.739 | ||
| WFDEI | [-] | 1.56 | 1.64 | 0.0106 | 1.79 | 0.00506 | -0.0594 | 0.680 | 0.652 | 0.670 | 0.587 | 0.947 | 0.928 | 0.744 |
Download Data |
Period Mean (original grids) [Pg yr-1] |
Model Period Mean (intersection) [Pg yr-1] |
Model Period Mean (complement) [Pg yr-1] |
Benchmark Period Mean (intersection) [Pg yr-1] |
Benchmark Period Mean (complement) [Pg yr-1] |
Bias [g m-2 d-1] |
RMSE [g m-2 d-1] |
Phase Shift [months] |
Bias Score [1] |
RMSE Score [1] |
Seasonal Cycle Score [1] |
Spatial Distribution Score [1] |
Overall Score [1] |
|||
|---|---|---|---|---|---|---|---|---|---|---|---|---|---|---|---|---|
| Benchmark | [-] | 23.2 | ||||||||||||||
| CRUNCEPv7 | [-] | 23.9 | 23.5 | 0.189 | 23.2 | 0.0226 | 0.338 | 1.60 | 2.45 | 0.334 | 0.297 | 0.585 | 0.949 | 0.492 | ||
| GSWP3v1 | [-] | 21.8 | 21.5 | 0.185 | 23.2 | 0.0226 | -0.346 | 1.82 | 2.72 | 0.163 | 0.259 | 0.542 | 0.884 | 0.421 | ||
| WFDEI | [-] | 22.8 | 22.5 | 0.175 | 23.2 | 0.0226 | -0.00714 | 1.42 | 2.44 | 0.246 | 0.368 | 0.600 | 0.862 | 0.489 |
Download Data |
Period Mean (original grids) [Pg yr-1] |
Model Period Mean (intersection) [Pg yr-1] |
Model Period Mean (complement) [Pg yr-1] |
Benchmark Period Mean (intersection) [Pg yr-1] |
Benchmark Period Mean (complement) [Pg yr-1] |
Bias [g m-2 d-1] |
RMSE [g m-2 d-1] |
Phase Shift [months] |
Bias Score [1] |
RMSE Score [1] |
Seasonal Cycle Score [1] |
Spatial Distribution Score [1] |
Overall Score [1] |
|||
|---|---|---|---|---|---|---|---|---|---|---|---|---|---|---|---|---|
| Benchmark | [-] | 10.4 | ||||||||||||||
| CRUNCEPv7 | [-] | 11.5 | 11.3 | 0.332 | 10.4 | 0.00314 | 0.512 | 2.19 | 0.663 | 0.481 | 0.467 | 0.930 | 0.759 | 0.621 | ||
| GSWP3v1 | [-] | 11.6 | 11.5 | 0.317 | 10.4 | 0.00314 | 0.582 | 1.93 | 0.741 | 0.518 | 0.523 | 0.917 | 0.805 | 0.657 | ||
| WFDEI | [-] | 11.9 | 11.8 | 0.313 | 10.4 | 0.00314 | 0.707 | 1.81 | 0.679 | 0.555 | 0.528 | 0.927 | 0.881 | 0.684 |
Download Data |
Period Mean (original grids) [Pg yr-1] |
Model Period Mean (intersection) [Pg yr-1] |
Model Period Mean (complement) [Pg yr-1] |
Benchmark Period Mean (intersection) [Pg yr-1] |
Benchmark Period Mean (complement) [Pg yr-1] |
Bias [g m-2 d-1] |
RMSE [g m-2 d-1] |
Phase Shift [months] |
Bias Score [1] |
RMSE Score [1] |
Seasonal Cycle Score [1] |
Spatial Distribution Score [1] |
Overall Score [1] |
|||
|---|---|---|---|---|---|---|---|---|---|---|---|---|---|---|---|---|
| Benchmark | [-] | 1.16 | ||||||||||||||
| CRUNCEPv7 | [-] | 1.02 | 0.935 | 0.0480 | 1.14 | 0.0148 | -0.00948 | 0.733 | 1.20 | 0.453 | 0.410 | 0.910 | 0.917 | 0.620 | ||
| GSWP3v1 | [-] | 1.08 | 0.998 | 0.0459 | 1.14 | 0.0148 | 0.0351 | 0.660 | 1.29 | 0.480 | 0.463 | 0.870 | 0.931 | 0.642 | ||
| WFDEI | [-] | 1.01 | 0.934 | 0.0428 | 1.14 | 0.0148 | -0.0384 | 0.674 | 1.26 | 0.466 | 0.461 | 0.880 | 0.912 | 0.636 |
Temporally integrated period mean