Mean State
Download Data |
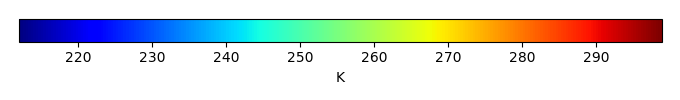
Period Mean (original grids) [K] |
Model Period Mean (intersection) [K] |
Model Period Mean (complement) [K] |
Benchmark Period Mean (intersection) [K] |
Benchmark Period Mean (complement) [K] |
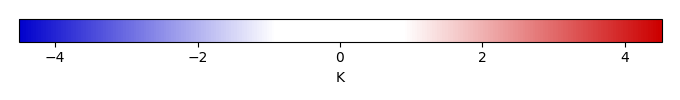
Bias [K] |
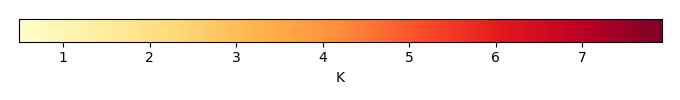
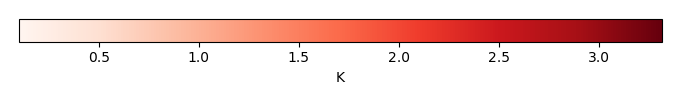
RMSE [K] |
Phase Shift [months] |
Bias Score [1] |
RMSE Score [1] |
Seasonal Cycle Score [1] |
Spatial Distribution Score [1] |
Interannual Variability Score [1] |
Overall Score [1] |
|||
|---|---|---|---|---|---|---|---|---|---|---|---|---|---|---|---|---|---|
| Benchmark | [-] | 293. | |||||||||||||||
| CRUNCEPv7 | [-] | 295. | 295. | 298. | 293. | 296. | 2.08 | 2.28 | 0.884 | 0.196 | 0.502 | 0.893 | 0.999 | 0.799 | 0.648 | ||
| GSWP3v1 | [-] | 293. | 293. | 297. | 293. | 296. | 0.833 | 1.28 | 0.623 | 0.462 | 0.492 | 0.928 | 0.998 | 0.767 | 0.690 |
Download Data |
Period Mean (original grids) [K] |
Model Period Mean (intersection) [K] |
Model Period Mean (complement) [K] |
Benchmark Period Mean (intersection) [K] |
Benchmark Period Mean (complement) [K] |
Bias [K] |
RMSE [K] |
Phase Shift [months] |
Bias Score [1] |
RMSE Score [1] |
Seasonal Cycle Score [1] |
Spatial Distribution Score [1] |
Interannual Variability Score [1] |
Overall Score [1] |
|||
|---|---|---|---|---|---|---|---|---|---|---|---|---|---|---|---|---|---|
| Benchmark | [-] | 293. | |||||||||||||||
| CRUNCEPv7 | [-] | 295. | 295. | 297. | 293. | 294. | 1.87 | 2.50 | 0.334 | 0.503 | 0.633 | 0.968 | 0.959 | 0.889 | 0.764 | ||
| GSWP3v1 | [-] | 294. | 294. | 296. | 293. | 294. | 1.08 | 1.45 | 0.183 | 0.641 | 0.746 | 0.984 | 0.985 | 0.859 | 0.827 |
Download Data |
Period Mean (original grids) [K] |
Model Period Mean (intersection) [K] |
Model Period Mean (complement) [K] |
Benchmark Period Mean (intersection) [K] |
Benchmark Period Mean (complement) [K] |
Bias [K] |
RMSE [K] |
Phase Shift [months] |
Bias Score [1] |
RMSE Score [1] |
Seasonal Cycle Score [1] |
Spatial Distribution Score [1] |
Interannual Variability Score [1] |
Overall Score [1] |
|||
|---|---|---|---|---|---|---|---|---|---|---|---|---|---|---|---|---|---|
| Benchmark | [-] | 288. | |||||||||||||||
| CRUNCEPv7 | [-] | 291. | 291. | 294. | 288. | 293. | 2.46 | 2.65 | 0.692 | 0.448 | 0.747 | 0.915 | 0.999 | 0.827 | 0.780 | ||
| GSWP3v1 | [-] | 289. | 289. | 293. | 288. | 293. | 0.967 | 1.33 | 0.517 | 0.673 | 0.786 | 0.938 | 1.00 | 0.843 | 0.838 |
Download Data |
Period Mean (original grids) [K] |
Model Period Mean (intersection) [K] |
Model Period Mean (complement) [K] |
Benchmark Period Mean (intersection) [K] |
Benchmark Period Mean (complement) [K] |
Bias [K] |
RMSE [K] |
Phase Shift [months] |
Bias Score [1] |
RMSE Score [1] |
Seasonal Cycle Score [1] |
Spatial Distribution Score [1] |
Interannual Variability Score [1] |
Overall Score [1] |
|||
|---|---|---|---|---|---|---|---|---|---|---|---|---|---|---|---|---|---|
| Benchmark | [-] | 256. | |||||||||||||||
| CRUNCEPv7 | [-] | 257. | 257. | 261. | 256. | 261. | 0.683 | 1.93 | 0.0676 | 0.931 | 0.907 | 0.995 | 0.998 | 0.886 | 0.937 | ||
| GSWP3v1 | [-] | 256. | 256. | 264. | 256. | 261. | 0.444 | 1.75 | 0.0394 | 0.932 | 0.918 | 0.997 | 0.999 | 0.908 | 0.945 |
Download Data |
Period Mean (original grids) [K] |
Model Period Mean (intersection) [K] |
Model Period Mean (complement) [K] |
Benchmark Period Mean (intersection) [K] |
Benchmark Period Mean (complement) [K] |
Bias [K] |
RMSE [K] |
Phase Shift [months] |
Bias Score [1] |
RMSE Score [1] |
Seasonal Cycle Score [1] |
Spatial Distribution Score [1] |
Interannual Variability Score [1] |
Overall Score [1] |
|||
|---|---|---|---|---|---|---|---|---|---|---|---|---|---|---|---|---|---|
| Benchmark | [-] | 294. | |||||||||||||||
| CRUNCEPv7 | [-] | 297. | 297. | 298. | 294. | 295. | 3.14 | 3.28 | 1.65 | 0.0594 | 0.481 | 0.746 | 0.921 | 0.743 | 0.572 | ||
| GSWP3v1 | [-] | 295. | 295. | 297. | 294. | 295. | 1.18 | 1.64 | 1.26 | 0.294 | 0.504 | 0.813 | 0.958 | 0.820 | 0.649 |
Download Data |
Period Mean (original grids) [K] |
Model Period Mean (intersection) [K] |
Model Period Mean (complement) [K] |
Benchmark Period Mean (intersection) [K] |
Benchmark Period Mean (complement) [K] |
Bias [K] |
RMSE [K] |
Phase Shift [months] |
Bias Score [1] |
RMSE Score [1] |
Seasonal Cycle Score [1] |
Spatial Distribution Score [1] |
Interannual Variability Score [1] |
Overall Score [1] |
|||
|---|---|---|---|---|---|---|---|---|---|---|---|---|---|---|---|---|---|
| Benchmark | [-] | 265. | |||||||||||||||
| CRUNCEPv7 | [-] | 266. | 266. | 272. | 265. | 269. | 0.573 | 1.46 | 0.0284 | 0.937 | 0.931 | 0.998 | 0.993 | 0.971 | 0.960 | ||
| GSWP3v1 | [-] | 265. | 265. | 272. | 265. | 269. | -0.203 | 1.13 | 0.0201 | 0.946 | 0.944 | 0.999 | 0.998 | 0.964 | 0.966 |
Download Data |
Period Mean (original grids) [K] |
Model Period Mean (intersection) [K] |
Model Period Mean (complement) [K] |
Benchmark Period Mean (intersection) [K] |
Benchmark Period Mean (complement) [K] |
Bias [K] |
RMSE [K] |
Phase Shift [months] |
Bias Score [1] |
RMSE Score [1] |
Seasonal Cycle Score [1] |
Spatial Distribution Score [1] |
Interannual Variability Score [1] |
Overall Score [1] |
|||
|---|---|---|---|---|---|---|---|---|---|---|---|---|---|---|---|---|---|
| Benchmark | [-] | 274. | |||||||||||||||
| CRUNCEPv7 | [-] | 275. | 275. | 285. | 274. | 280. | 1.34 | 2.23 | 0.0239 | 0.841 | 0.887 | 0.998 | 0.998 | 0.924 | 0.923 | ||
| GSWP3v1 | [-] | 275. | 274. | 285. | 274. | 280. | 0.788 | 1.57 | 0.0129 | 0.876 | 0.925 | 0.999 | 0.999 | 0.927 | 0.942 |
Download Data |
Period Mean (original grids) [K] |
Model Period Mean (intersection) [K] |
Model Period Mean (complement) [K] |
Benchmark Period Mean (intersection) [K] |
Benchmark Period Mean (complement) [K] |
Bias [K] |
RMSE [K] |
Phase Shift [months] |
Bias Score [1] |
RMSE Score [1] |
Seasonal Cycle Score [1] |
Spatial Distribution Score [1] |
Interannual Variability Score [1] |
Overall Score [1] |
|||
|---|---|---|---|---|---|---|---|---|---|---|---|---|---|---|---|---|---|
| Benchmark | [-] | 291. | |||||||||||||||
| CRUNCEPv7 | [-] | 292. | 292. | 298. | 291. | 296. | 1.15 | 2.14 | 0.321 | 0.630 | 0.795 | 0.975 | 0.991 | 0.858 | 0.841 | ||
| GSWP3v1 | [-] | 291. | 291. | 297. | 291. | 296. | 0.700 | 1.49 | 0.227 | 0.721 | 0.846 | 0.981 | 0.999 | 0.928 | 0.887 |
Download Data |
Period Mean (original grids) [K] |
Model Period Mean (intersection) [K] |
Model Period Mean (complement) [K] |
Benchmark Period Mean (intersection) [K] |
Benchmark Period Mean (complement) [K] |
Bias [K] |
RMSE [K] |
Phase Shift [months] |
Bias Score [1] |
RMSE Score [1] |
Seasonal Cycle Score [1] |
Spatial Distribution Score [1] |
Interannual Variability Score [1] |
Overall Score [1] |
|||
|---|---|---|---|---|---|---|---|---|---|---|---|---|---|---|---|---|---|
| Benchmark | [-] | 259. | |||||||||||||||
| CRUNCEPv7 | [-] | 259. | 259. | 261. | 259. | 260. | -0.000922 | 1.58 | 0.0247 | 0.961 | 0.911 | 0.998 | 0.999 | 0.911 | 0.949 | ||
| GSWP3v1 | [-] | 259. | 259. | 263. | 259. | 260. | -0.185 | 1.46 | 0.0250 | 0.956 | 0.923 | 0.998 | 1.00 | 0.920 | 0.953 |
Download Data |
Period Mean (original grids) [K] |
Model Period Mean (intersection) [K] |
Model Period Mean (complement) [K] |
Benchmark Period Mean (intersection) [K] |
Benchmark Period Mean (complement) [K] |
Bias [K] |
RMSE [K] |
Phase Shift [months] |
Bias Score [1] |
RMSE Score [1] |
Seasonal Cycle Score [1] |
Spatial Distribution Score [1] |
Interannual Variability Score [1] |
Overall Score [1] |
|||
|---|---|---|---|---|---|---|---|---|---|---|---|---|---|---|---|---|---|
| Benchmark | [-] | 287. | |||||||||||||||
| CRUNCEPv7 | [-] | 290. | 290. | 291. | 287. | 289. | 2.63 | 2.78 | 0.197 | 0.578 | 0.838 | 0.986 | 0.995 | 0.907 | 0.857 | ||
| GSWP3v1 | [-] | 289. | 289. | 290. | 287. | 289. | 1.23 | 1.39 | 0.123 | 0.761 | 0.893 | 0.992 | 1.00 | 0.945 | 0.914 |
Download Data |
Period Mean (original grids) [K] |
Model Period Mean (intersection) [K] |
Model Period Mean (complement) [K] |
Benchmark Period Mean (intersection) [K] |
Benchmark Period Mean (complement) [K] |
Bias [K] |
RMSE [K] |
Phase Shift [months] |
Bias Score [1] |
RMSE Score [1] |
Seasonal Cycle Score [1] |
Spatial Distribution Score [1] |
Interannual Variability Score [1] |
Overall Score [1] |
|||
|---|---|---|---|---|---|---|---|---|---|---|---|---|---|---|---|---|---|
| Benchmark | [-] | 277. | |||||||||||||||
| CRUNCEPv7 | [-] | 278. | 278. | 281. | 277. | 281. | 0.964 | 1.59 | 0.125 | 0.806 | 0.874 | 0.992 | 0.993 | 0.921 | 0.910 | ||
| GSWP3v1 | [-] | 277. | 277. | 280. | 277. | 281. | 0.142 | 1.12 | 0.120 | 0.861 | 0.908 | 0.992 | 0.994 | 0.943 | 0.934 |
Download Data |
Period Mean (original grids) [K] |
Model Period Mean (intersection) [K] |
Model Period Mean (complement) [K] |
Benchmark Period Mean (intersection) [K] |
Benchmark Period Mean (complement) [K] |
Bias [K] |
RMSE [K] |
Phase Shift [months] |
Bias Score [1] |
RMSE Score [1] |
Seasonal Cycle Score [1] |
Spatial Distribution Score [1] |
Interannual Variability Score [1] |
Overall Score [1] |
|||
|---|---|---|---|---|---|---|---|---|---|---|---|---|---|---|---|---|---|
| Benchmark | [-] | 281. | |||||||||||||||
| CRUNCEPv7 | [-] | 277. | 282. | 241. | 280. | 287. | 1.51 | 2.27 | 0.380 | 0.654 | 0.797 | 0.952 | 0.999 | 0.896 | 0.849 | ||
| GSWP3v1 | [-] | 277. | 281. | 244. | 280. | 287. | 0.726 | 1.47 | 0.250 | 0.760 | 0.835 | 0.970 | 0.999 | 0.909 | 0.885 |
Download Data |
Period Mean (original grids) [K] |
Model Period Mean (intersection) [K] |
Model Period Mean (complement) [K] |
Benchmark Period Mean (intersection) [K] |
Benchmark Period Mean (complement) [K] |
Bias [K] |
RMSE [K] |
Phase Shift [months] |
Bias Score [1] |
RMSE Score [1] |
Seasonal Cycle Score [1] |
Spatial Distribution Score [1] |
Interannual Variability Score [1] |
Overall Score [1] |
|||
|---|---|---|---|---|---|---|---|---|---|---|---|---|---|---|---|---|---|
| Benchmark | [-] | 289. | |||||||||||||||
| CRUNCEPv7 | [-] | 289. | 289. | 292. | 288. | 292. | 0.626 | 1.90 | 0.298 | 0.789 | 0.838 | 0.977 | 0.995 | 0.909 | 0.891 | ||
| GSWP3v1 | [-] | 289. | 289. | 292. | 288. | 292. | 0.668 | 1.30 | 0.222 | 0.850 | 0.883 | 0.983 | 1.00 | 0.909 | 0.918 |
Download Data |
Period Mean (original grids) [K] |
Model Period Mean (intersection) [K] |
Model Period Mean (complement) [K] |
Benchmark Period Mean (intersection) [K] |
Benchmark Period Mean (complement) [K] |
Bias [K] |
RMSE [K] |
Phase Shift [months] |
Bias Score [1] |
RMSE Score [1] |
Seasonal Cycle Score [1] |
Spatial Distribution Score [1] |
Interannual Variability Score [1] |
Overall Score [1] |
|||
|---|---|---|---|---|---|---|---|---|---|---|---|---|---|---|---|---|---|
| Benchmark | [-] | 260. | |||||||||||||||
| CRUNCEPv7 | [-] | 260. | 260. | 259. | 260. | 262. | 0.273 | 1.66 | 0.0664 | 0.935 | 0.905 | 0.996 | 0.983 | 0.896 | 0.937 | ||
| GSWP3v1 | [-] | 260. | 260. | 262. | 260. | 262. | 0.473 | 1.54 | 0.0471 | 0.937 | 0.914 | 0.997 | 0.997 | 0.920 | 0.946 |
Download Data |
Period Mean (original grids) [K] |
Model Period Mean (intersection) [K] |
Model Period Mean (complement) [K] |
Benchmark Period Mean (intersection) [K] |
Benchmark Period Mean (complement) [K] |
Bias [K] |
RMSE [K] |
Phase Shift [months] |
Bias Score [1] |
RMSE Score [1] |
Seasonal Cycle Score [1] |
Spatial Distribution Score [1] |
Interannual Variability Score [1] |
Overall Score [1] |
|||
|---|---|---|---|---|---|---|---|---|---|---|---|---|---|---|---|---|---|
| Benchmark | [-] | 289. | |||||||||||||||
| CRUNCEPv7 | [-] | 291. | 291. | 295. | 289. | 293. | 2.99 | 3.43 | 0.543 | 0.380 | 0.707 | 0.947 | 0.992 | 0.872 | 0.768 | ||
| GSWP3v1 | [-] | 289. | 289. | 294. | 289. | 293. | 1.38 | 2.00 | 0.342 | 0.569 | 0.766 | 0.965 | 0.999 | 0.902 | 0.828 |
Download Data |
Period Mean (original grids) [K] |
Model Period Mean (intersection) [K] |
Model Period Mean (complement) [K] |
Benchmark Period Mean (intersection) [K] |
Benchmark Period Mean (complement) [K] |
Bias [K] |
RMSE [K] |
Phase Shift [months] |
Bias Score [1] |
RMSE Score [1] |
Seasonal Cycle Score [1] |
Spatial Distribution Score [1] |
Interannual Variability Score [1] |
Overall Score [1] |
|||
|---|---|---|---|---|---|---|---|---|---|---|---|---|---|---|---|---|---|
| Benchmark | [-] | 280. | |||||||||||||||
| CRUNCEPv7 | [-] | 282. | 282. | 291. | 280. | 287. | 2.04 | 2.23 | 0.0503 | 0.782 | 0.912 | 0.997 | 0.993 | 0.948 | 0.924 | ||
| GSWP3v1 | [-] | 281. | 281. | 290. | 280. | 287. | 1.10 | 1.32 | 0.0253 | 0.872 | 0.934 | 0.998 | 1.00 | 0.971 | 0.951 |
Download Data |
Period Mean (original grids) [K] |
Model Period Mean (intersection) [K] |
Model Period Mean (complement) [K] |
Benchmark Period Mean (intersection) [K] |
Benchmark Period Mean (complement) [K] |
Bias [K] |
RMSE [K] |
Phase Shift [months] |
Bias Score [1] |
RMSE Score [1] |
Seasonal Cycle Score [1] |
Spatial Distribution Score [1] |
Interannual Variability Score [1] |
Overall Score [1] |
|||
|---|---|---|---|---|---|---|---|---|---|---|---|---|---|---|---|---|---|
| Benchmark | [-] | 268. | |||||||||||||||
| CRUNCEPv7 | [-] | 269. | 269. | 274. | 268. | 274. | 1.09 | 1.64 | 0.0359 | 0.885 | 0.908 | 0.998 | 0.997 | 0.946 | 0.940 | ||
| GSWP3v1 | [-] | 269. | 269. | 274. | 268. | 274. | 0.585 | 1.21 | 0.0363 | 0.918 | 0.922 | 0.998 | 0.998 | 0.948 | 0.951 |
Download Data |
Period Mean (original grids) [K] |
Model Period Mean (intersection) [K] |
Model Period Mean (complement) [K] |
Benchmark Period Mean (intersection) [K] |
Benchmark Period Mean (complement) [K] |
Bias [K] |
RMSE [K] |
Phase Shift [months] |
Bias Score [1] |
RMSE Score [1] |
Seasonal Cycle Score [1] |
Spatial Distribution Score [1] |
Interannual Variability Score [1] |
Overall Score [1] |
|||
|---|---|---|---|---|---|---|---|---|---|---|---|---|---|---|---|---|---|
| Benchmark | [-] | 276. | |||||||||||||||
| CRUNCEPv7 | [-] | 277. | 277. | 283. | 276. | 280. | 1.82 | 2.53 | 0.0322 | 0.758 | 0.838 | 0.997 | 0.999 | 0.897 | 0.888 | ||
| GSWP3v1 | [-] | 277. | 277. | 283. | 276. | 280. | 1.58 | 2.03 | 0.0332 | 0.783 | 0.892 | 0.998 | 0.998 | 0.941 | 0.917 |
Download Data |
Period Mean (original grids) [K] |
Model Period Mean (intersection) [K] |
Model Period Mean (complement) [K] |
Benchmark Period Mean (intersection) [K] |
Benchmark Period Mean (complement) [K] |
Bias [K] |
RMSE [K] |
Phase Shift [months] |
Bias Score [1] |
RMSE Score [1] |
Seasonal Cycle Score [1] |
Spatial Distribution Score [1] |
Interannual Variability Score [1] |
Overall Score [1] |
|||
|---|---|---|---|---|---|---|---|---|---|---|---|---|---|---|---|---|---|
| Benchmark | [-] | 294. | |||||||||||||||
| CRUNCEPv7 | [-] | 296. | 296. | 298. | 294. | 294. | 2.24 | 2.51 | 1.97 | 0.138 | 0.530 | 0.689 | 1.00 | 0.881 | 0.628 | ||
| GSWP3v1 | [-] | 294. | 294. | 297. | 294. | 294. | 0.878 | 1.34 | 1.08 | 0.417 | 0.551 | 0.837 | 0.994 | 0.877 | 0.705 |
Download Data |
Period Mean (original grids) [K] |
Model Period Mean (intersection) [K] |
Model Period Mean (complement) [K] |
Benchmark Period Mean (intersection) [K] |
Benchmark Period Mean (complement) [K] |
Bias [K] |
RMSE [K] |
Phase Shift [months] |
Bias Score [1] |
RMSE Score [1] |
Seasonal Cycle Score [1] |
Spatial Distribution Score [1] |
Interannual Variability Score [1] |
Overall Score [1] |
|||
|---|---|---|---|---|---|---|---|---|---|---|---|---|---|---|---|---|---|
| Benchmark | [-] | 290. | |||||||||||||||
| CRUNCEPv7 | [-] | 292. | 292. | 294. | 290. | 288. | 2.56 | 2.70 | 0.678 | 0.390 | 0.750 | 0.907 | 0.999 | 0.922 | 0.786 | ||
| GSWP3v1 | [-] | 291. | 291. | 293. | 290. | 288. | 1.13 | 1.35 | 0.470 | 0.631 | 0.800 | 0.937 | 1.00 | 0.936 | 0.851 |
Download Data |
Period Mean (original grids) [K] |
Model Period Mean (intersection) [K] |
Model Period Mean (complement) [K] |
Benchmark Period Mean (intersection) [K] |
Benchmark Period Mean (complement) [K] |
Bias [K] |
RMSE [K] |
Phase Shift [months] |
Bias Score [1] |
RMSE Score [1] |
Seasonal Cycle Score [1] |
Spatial Distribution Score [1] |
Interannual Variability Score [1] |
Overall Score [1] |
|||
|---|---|---|---|---|---|---|---|---|---|---|---|---|---|---|---|---|---|
| Benchmark | [-] | 278. | |||||||||||||||
| CRUNCEPv7 | [-] | 280. | 280. | 285. | 278. | 281. | 2.73 | 3.31 | 0.255 | 0.444 | 0.750 | 0.972 | 1.00 | 0.921 | 0.806 | ||
| GSWP3v1 | [-] | 279. | 279. | 284. | 278. | 281. | 1.40 | 2.27 | 0.106 | 0.580 | 0.795 | 0.990 | 1.00 | 0.921 | 0.847 |
Temporally integrated period mean