Mean State
Download Data |
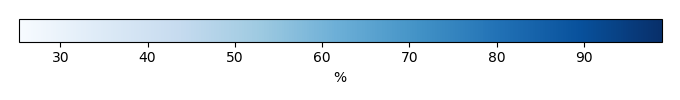
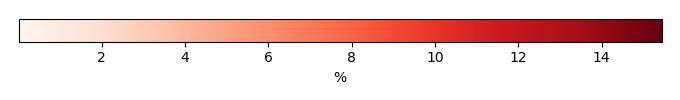
Period Mean (original grids) [%] |
Model Period Mean (intersection) [%] |
Model Period Mean (complement) [%] |
Benchmark Period Mean (intersection) [%] |
Benchmark Period Mean (complement) [%] |
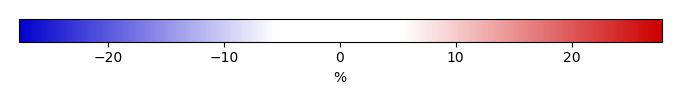
Bias [%] |
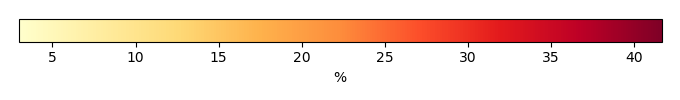
RMSE [%] |
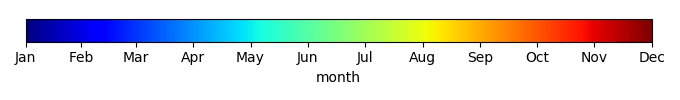
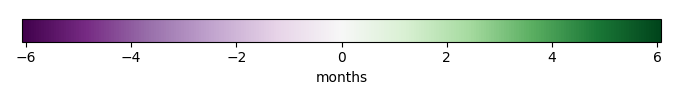
Phase Shift [months] |
Bias Score [1] |
RMSE Score [1] |
Seasonal Cycle Score [1] |
Spatial Distribution Score [1] |
Interannual Variability Score [1] |
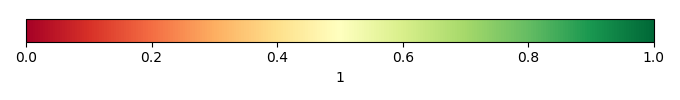
Overall Score [1] |
|||
|---|---|---|---|---|---|---|---|---|---|---|---|---|---|---|---|---|---|
| Benchmark | [-] | 77.9 | |||||||||||||||
| CRUNCEPv7 | [-] | 72.2 | 72.1 | 77.8 | 80.3 | -5.35 | 9.88 | 1.69 | 0.325 | 0.450 | 0.758 | 0.894 | 0.591 | 0.578 | |||
| GSWP3v1 | [-] | 68.8 | 69.0 | 77.8 | 80.3 | -8.18 | 14.1 | 1.93 | 0.336 | 0.233 | 0.720 | 0.997 | 0.485 | 0.501 | |||
| WFDEI | [-] | 79.7 | 79.8 | 77.8 | 80.3 | 1.91 | 6.29 | 1.01 | 0.670 | 0.453 | 0.862 | 0.999 | 0.806 | 0.707 |
Download Data |
Period Mean (original grids) [%] |
Model Period Mean (intersection) [%] |
Model Period Mean (complement) [%] |
Benchmark Period Mean (intersection) [%] |
Benchmark Period Mean (complement) [%] |
Bias [%] |
RMSE [%] |
Phase Shift [months] |
Bias Score [1] |
RMSE Score [1] |
Seasonal Cycle Score [1] |
Spatial Distribution Score [1] |
Interannual Variability Score [1] |
Overall Score [1] |
|||
|---|---|---|---|---|---|---|---|---|---|---|---|---|---|---|---|---|---|
| Benchmark | [-] | 53.6 | |||||||||||||||
| CRUNCEPv7 | [-] | 51.1 | 50.6 | 53.2 | 77.5 | -2.43 | 10.3 | 0.252 | 0.734 | 0.648 | 0.962 | 0.940 | 0.550 | 0.747 | |||
| GSWP3v1 | [-] | 51.4 | 50.8 | 53.2 | 77.5 | -2.18 | 11.8 | 0.546 | 0.740 | 0.590 | 0.930 | 0.973 | 0.837 | 0.777 | |||
| WFDEI | [-] | 56.7 | 56.1 | 53.2 | 77.5 | 2.83 | 9.37 | 0.337 | 0.803 | 0.641 | 0.952 | 0.998 | 0.875 | 0.818 |
Download Data |
Period Mean (original grids) [%] |
Model Period Mean (intersection) [%] |
Model Period Mean (complement) [%] |
Benchmark Period Mean (intersection) [%] |
Benchmark Period Mean (complement) [%] |
Bias [%] |
RMSE [%] |
Phase Shift [months] |
Bias Score [1] |
RMSE Score [1] |
Seasonal Cycle Score [1] |
Spatial Distribution Score [1] |
Interannual Variability Score [1] |
Overall Score [1] |
|||
|---|---|---|---|---|---|---|---|---|---|---|---|---|---|---|---|---|---|
| Benchmark | [-] | 64.2 | |||||||||||||||
| CRUNCEPv7 | [-] | 61.3 | 61.2 | 63.5 | 77.8 | -0.992 | 9.54 | 0.948 | 0.628 | 0.514 | 0.870 | 0.942 | 0.537 | 0.668 | |||
| GSWP3v1 | [-] | 61.4 | 61.4 | 63.5 | 77.8 | -0.864 | 11.3 | 1.13 | 0.605 | 0.437 | 0.843 | 0.970 | 0.757 | 0.675 | |||
| WFDEI | [-] | 61.3 | 61.2 | 63.5 | 77.8 | -1.44 | 7.91 | 0.681 | 0.729 | 0.522 | 0.910 | 0.998 | 0.836 | 0.753 |
Download Data |
Period Mean (original grids) [%] |
Model Period Mean (intersection) [%] |
Model Period Mean (complement) [%] |
Benchmark Period Mean (intersection) [%] |
Benchmark Period Mean (complement) [%] |
Bias [%] |
RMSE [%] |
Phase Shift [months] |
Bias Score [1] |
RMSE Score [1] |
Seasonal Cycle Score [1] |
Spatial Distribution Score [1] |
Interannual Variability Score [1] |
Overall Score [1] |
|||
|---|---|---|---|---|---|---|---|---|---|---|---|---|---|---|---|---|---|
| Benchmark | [-] | 77.6 | |||||||||||||||
| CRUNCEPv7 | [-] | 74.5 | 74.4 | 77.1 | 83.4 | -0.533 | 17.6 | 3.20 | 0.276 | 0.0915 | 0.455 | 0.420 | 0.242 | 0.263 | |||
| GSWP3v1 | [-] | 88.5 | 88.4 | 77.1 | 83.4 | 11.6 | 17.8 | 4.53 | 0.114 | 0.0762 | 0.215 | 0.746 | 0.565 | 0.299 | |||
| WFDEI | [-] | 88.1 | 88.1 | 77.1 | 83.4 | 10.9 | 13.2 | 2.93 | 0.152 | 0.237 | 0.525 | 0.866 | 0.782 | 0.467 |
Download Data |
Period Mean (original grids) [%] |
Model Period Mean (intersection) [%] |
Model Period Mean (complement) [%] |
Benchmark Period Mean (intersection) [%] |
Benchmark Period Mean (complement) [%] |
Bias [%] |
RMSE [%] |
Phase Shift [months] |
Bias Score [1] |
RMSE Score [1] |
Seasonal Cycle Score [1] |
Spatial Distribution Score [1] |
Interannual Variability Score [1] |
Overall Score [1] |
|||
|---|---|---|---|---|---|---|---|---|---|---|---|---|---|---|---|---|---|
| Benchmark | [-] | 84.2 | |||||||||||||||
| CRUNCEPv7 | [-] | 83.1 | 83.1 | 85.0 | 81.2 | -1.77 | 5.23 | 1.99 | 0.451 | 0.402 | 0.693 | 0.900 | 0.568 | 0.570 | |||
| GSWP3v1 | [-] | 85.4 | 85.5 | 85.0 | 81.2 | -0.483 | 5.21 | 1.54 | 0.594 | 0.236 | 0.778 | 0.999 | 0.518 | 0.560 | |||
| WFDEI | [-] | 88.4 | 88.5 | 85.0 | 81.2 | 2.71 | 4.99 | 1.03 | 0.463 | 0.346 | 0.855 | 0.984 | 0.742 | 0.623 |
Download Data |
Period Mean (original grids) [%] |
Model Period Mean (intersection) [%] |
Model Period Mean (complement) [%] |
Benchmark Period Mean (intersection) [%] |
Benchmark Period Mean (complement) [%] |
Bias [%] |
RMSE [%] |
Phase Shift [months] |
Bias Score [1] |
RMSE Score [1] |
Seasonal Cycle Score [1] |
Spatial Distribution Score [1] |
Interannual Variability Score [1] |
Overall Score [1] |
|||
|---|---|---|---|---|---|---|---|---|---|---|---|---|---|---|---|---|---|
| Benchmark | [-] | 72.3 | |||||||||||||||
| CRUNCEPv7 | [-] | 75.1 | 75.1 | 72.2 | 78.9 | 3.06 | 11.1 | 1.86 | 0.491 | 0.399 | 0.734 | 0.590 | 0.625 | 0.540 | |||
| GSWP3v1 | [-] | 82.2 | 82.3 | 72.2 | 78.9 | 10.1 | 17.7 | 1.89 | 0.331 | 0.201 | 0.729 | 0.980 | 0.571 | 0.502 | |||
| WFDEI | [-] | 81.2 | 81.3 | 72.2 | 78.9 | 8.98 | 11.1 | 1.74 | 0.366 | 0.480 | 0.757 | 0.943 | 0.849 | 0.646 |
Download Data |
Period Mean (original grids) [%] |
Model Period Mean (intersection) [%] |
Model Period Mean (complement) [%] |
Benchmark Period Mean (intersection) [%] |
Benchmark Period Mean (complement) [%] |
Bias [%] |
RMSE [%] |
Phase Shift [months] |
Bias Score [1] |
RMSE Score [1] |
Seasonal Cycle Score [1] |
Spatial Distribution Score [1] |
Interannual Variability Score [1] |
Overall Score [1] |
|||
|---|---|---|---|---|---|---|---|---|---|---|---|---|---|---|---|---|---|
| Benchmark | [-] | 61.3 | |||||||||||||||
| CRUNCEPv7 | [-] | 55.5 | 55.6 | 61.0 | 71.3 | -4.13 | 13.6 | 1.44 | 0.530 | 0.517 | 0.801 | 0.888 | 0.816 | 0.678 | |||
| GSWP3v1 | [-] | 64.6 | 64.8 | 61.0 | 71.3 | 4.46 | 16.1 | 1.95 | 0.549 | 0.321 | 0.706 | 0.995 | 0.757 | 0.608 | |||
| WFDEI | [-] | 65.3 | 65.5 | 61.0 | 71.3 | 5.08 | 9.41 | 0.951 | 0.617 | 0.497 | 0.870 | 0.997 | 0.860 | 0.723 |
Download Data |
Period Mean (original grids) [%] |
Model Period Mean (intersection) [%] |
Model Period Mean (complement) [%] |
Benchmark Period Mean (intersection) [%] |
Benchmark Period Mean (complement) [%] |
Bias [%] |
RMSE [%] |
Phase Shift [months] |
Bias Score [1] |
RMSE Score [1] |
Seasonal Cycle Score [1] |
Spatial Distribution Score [1] |
Interannual Variability Score [1] |
Overall Score [1] |
|||
|---|---|---|---|---|---|---|---|---|---|---|---|---|---|---|---|---|---|
| Benchmark | [-] | 69.0 | |||||||||||||||
| CRUNCEPv7 | [-] | 60.5 | 60.6 | 68.3 | 79.0 | -5.32 | 10.2 | 0.773 | 0.558 | 0.535 | 0.897 | 0.984 | 0.645 | 0.692 | |||
| GSWP3v1 | [-] | 62.3 | 62.0 | 68.3 | 79.0 | -3.91 | 11.5 | 0.951 | 0.615 | 0.390 | 0.870 | 0.944 | 0.658 | 0.644 | |||
| WFDEI | [-] | 67.5 | 67.4 | 68.3 | 79.0 | 0.596 | 7.74 | 0.513 | 0.700 | 0.485 | 0.924 | 0.994 | 0.847 | 0.739 |
Download Data |
Period Mean (original grids) [%] |
Model Period Mean (intersection) [%] |
Model Period Mean (complement) [%] |
Benchmark Period Mean (intersection) [%] |
Benchmark Period Mean (complement) [%] |
Bias [%] |
RMSE [%] |
Phase Shift [months] |
Bias Score [1] |
RMSE Score [1] |
Seasonal Cycle Score [1] |
Spatial Distribution Score [1] |
Interannual Variability Score [1] |
Overall Score [1] |
|||
|---|---|---|---|---|---|---|---|---|---|---|---|---|---|---|---|---|---|
| Benchmark | [-] | 78.8 | |||||||||||||||
| CRUNCEPv7 | [-] | 81.2 | 81.2 | 78.5 | 84.9 | 3.46 | 13.6 | 2.76 | 0.323 | 0.153 | 0.529 | 0.599 | 0.361 | 0.353 | |||
| GSWP3v1 | [-] | 88.9 | 88.9 | 78.5 | 84.9 | 10.5 | 16.4 | 4.18 | 0.150 | 0.0987 | 0.282 | 0.851 | 0.527 | 0.335 | |||
| WFDEI | [-] | 89.5 | 89.4 | 78.5 | 84.9 | 11.0 | 12.8 | 3.62 | 0.144 | 0.280 | 0.373 | 0.861 | 0.744 | 0.447 |
Download Data |
Period Mean (original grids) [%] |
Model Period Mean (intersection) [%] |
Model Period Mean (complement) [%] |
Benchmark Period Mean (intersection) [%] |
Benchmark Period Mean (complement) [%] |
Bias [%] |
RMSE [%] |
Phase Shift [months] |
Bias Score [1] |
RMSE Score [1] |
Seasonal Cycle Score [1] |
Spatial Distribution Score [1] |
Interannual Variability Score [1] |
Overall Score [1] |
|||
|---|---|---|---|---|---|---|---|---|---|---|---|---|---|---|---|---|---|
| Benchmark | [-] | 53.1 | |||||||||||||||
| CRUNCEPv7 | [-] | 51.0 | 50.9 | 51.3 | 74.6 | 1.93 | 8.88 | 0.504 | 0.595 | 0.516 | 0.912 | 0.942 | 0.582 | 0.677 | |||
| GSWP3v1 | [-] | 49.9 | 49.8 | 51.3 | 74.6 | 1.11 | 6.92 | 0.503 | 0.746 | 0.518 | 0.915 | 0.996 | 0.801 | 0.749 | |||
| WFDEI | [-] | 50.5 | 50.5 | 51.3 | 74.6 | 1.26 | 9.51 | 0.435 | 0.681 | 0.437 | 0.928 | 0.981 | 0.876 | 0.723 |
Download Data |
Period Mean (original grids) [%] |
Model Period Mean (intersection) [%] |
Model Period Mean (complement) [%] |
Benchmark Period Mean (intersection) [%] |
Benchmark Period Mean (complement) [%] |
Bias [%] |
RMSE [%] |
Phase Shift [months] |
Bias Score [1] |
RMSE Score [1] |
Seasonal Cycle Score [1] |
Spatial Distribution Score [1] |
Interannual Variability Score [1] |
Overall Score [1] |
|||
|---|---|---|---|---|---|---|---|---|---|---|---|---|---|---|---|---|---|
| Benchmark | [-] | 76.7 | |||||||||||||||
| CRUNCEPv7 | [-] | 76.5 | 76.4 | 76.6 | 78.3 | 0.572 | 5.78 | 1.25 | 0.651 | 0.512 | 0.836 | 0.831 | 0.817 | 0.693 | |||
| GSWP3v1 | [-] | 77.3 | 77.3 | 76.6 | 78.3 | 0.678 | 9.21 | 0.925 | 0.604 | 0.312 | 0.873 | 0.768 | 0.628 | 0.583 | |||
| WFDEI | [-] | 79.6 | 79.6 | 76.6 | 78.3 | 2.77 | 6.64 | 1.03 | 0.624 | 0.453 | 0.873 | 0.941 | 0.854 | 0.700 |
Download Data |
Period Mean (original grids) [%] |
Model Period Mean (intersection) [%] |
Model Period Mean (complement) [%] |
Benchmark Period Mean (intersection) [%] |
Benchmark Period Mean (complement) [%] |
Bias [%] |
RMSE [%] |
Phase Shift [months] |
Bias Score [1] |
RMSE Score [1] |
Seasonal Cycle Score [1] |
Spatial Distribution Score [1] |
Interannual Variability Score [1] |
Overall Score [1] |
|||
|---|---|---|---|---|---|---|---|---|---|---|---|---|---|---|---|---|---|
| Benchmark | [-] | 74.9 | |||||||||||||||
| CRUNCEPv7 | [-] | 65.2 | 65.2 | 65.3 | 79.6 | 1.63 | 12.0 | 1.48 | 0.466 | 0.411 | 0.764 | 0.944 | 0.598 | 0.599 | |||
| GSWP3v1 | [-] | 69.5 | 69.5 | 65.3 | 79.6 | 5.34 | 14.0 | 1.58 | 0.415 | 0.299 | 0.748 | 0.945 | 0.646 | 0.559 | |||
| WFDEI | [-] | 70.0 | 70.0 | 65.3 | 79.6 | 5.55 | 10.3 | 1.28 | 0.500 | 0.419 | 0.792 | 0.948 | 0.816 | 0.649 |
Download Data |
Period Mean (original grids) [%] |
Model Period Mean (intersection) [%] |
Model Period Mean (complement) [%] |
Benchmark Period Mean (intersection) [%] |
Benchmark Period Mean (complement) [%] |
Bias [%] |
RMSE [%] |
Phase Shift [months] |
Bias Score [1] |
RMSE Score [1] |
Seasonal Cycle Score [1] |
Spatial Distribution Score [1] |
Interannual Variability Score [1] |
Overall Score [1] |
|||
|---|---|---|---|---|---|---|---|---|---|---|---|---|---|---|---|---|---|
| Benchmark | [-] | 37.9 | |||||||||||||||
| CRUNCEPv7 | [-] | 42.8 | 42.8 | 36.6 | 70.8 | 7.69 | 12.9 | 0.891 | 0.424 | 0.500 | 0.852 | 0.957 | 0.623 | 0.643 | |||
| GSWP3v1 | [-] | 41.3 | 41.3 | 36.6 | 70.8 | 6.32 | 12.2 | 0.582 | 0.493 | 0.432 | 0.897 | 0.918 | 0.745 | 0.653 | |||
| WFDEI | [-] | 38.4 | 38.5 | 36.6 | 70.8 | 3.14 | 8.90 | 0.605 | 0.596 | 0.471 | 0.889 | 0.985 | 0.822 | 0.705 |
Download Data |
Period Mean (original grids) [%] |
Model Period Mean (intersection) [%] |
Model Period Mean (complement) [%] |
Benchmark Period Mean (intersection) [%] |
Benchmark Period Mean (complement) [%] |
Bias [%] |
RMSE [%] |
Phase Shift [months] |
Bias Score [1] |
RMSE Score [1] |
Seasonal Cycle Score [1] |
Spatial Distribution Score [1] |
Interannual Variability Score [1] |
Overall Score [1] |
|||
|---|---|---|---|---|---|---|---|---|---|---|---|---|---|---|---|---|---|
| Benchmark | [-] | 77.9 | |||||||||||||||
| CRUNCEPv7 | [-] | 82.8 | 82.7 | 77.6 | 82.9 | 6.30 | 14.3 | 2.85 | 0.288 | 0.179 | 0.538 | 0.455 | 0.431 | 0.345 | |||
| GSWP3v1 | [-] | 88.4 | 88.4 | 77.6 | 82.9 | 11.3 | 17.1 | 2.65 | 0.153 | 0.116 | 0.589 | 0.997 | 0.623 | 0.432 | |||
| WFDEI | [-] | 87.6 | 87.7 | 77.6 | 82.9 | 10.2 | 12.9 | 2.67 | 0.194 | 0.259 | 0.585 | 0.999 | 0.718 | 0.502 |
Download Data |
Period Mean (original grids) [%] |
Model Period Mean (intersection) [%] |
Model Period Mean (complement) [%] |
Benchmark Period Mean (intersection) [%] |
Benchmark Period Mean (complement) [%] |
Bias [%] |
RMSE [%] |
Phase Shift [months] |
Bias Score [1] |
RMSE Score [1] |
Seasonal Cycle Score [1] |
Spatial Distribution Score [1] |
Interannual Variability Score [1] |
Overall Score [1] |
|||
|---|---|---|---|---|---|---|---|---|---|---|---|---|---|---|---|---|---|
| Benchmark | [-] | 69.8 | |||||||||||||||
| CRUNCEPv7 | [-] | 62.4 | 62.5 | 68.1 | 78.3 | -2.34 | 8.46 | 1.34 | 0.491 | 0.444 | 0.793 | 0.996 | 0.676 | 0.641 | |||
| GSWP3v1 | [-] | 66.8 | 66.9 | 68.1 | 78.3 | 0.911 | 9.47 | 1.61 | 0.491 | 0.333 | 0.753 | 0.988 | 0.642 | 0.590 | |||
| WFDEI | [-] | 67.5 | 67.5 | 68.1 | 78.3 | 1.01 | 8.47 | 0.990 | 0.531 | 0.391 | 0.848 | 0.995 | 0.803 | 0.660 |
Download Data |
Period Mean (original grids) [%] |
Model Period Mean (intersection) [%] |
Model Period Mean (complement) [%] |
Benchmark Period Mean (intersection) [%] |
Benchmark Period Mean (complement) [%] |
Bias [%] |
RMSE [%] |
Phase Shift [months] |
Bias Score [1] |
RMSE Score [1] |
Seasonal Cycle Score [1] |
Spatial Distribution Score [1] |
Interannual Variability Score [1] |
Overall Score [1] |
|||
|---|---|---|---|---|---|---|---|---|---|---|---|---|---|---|---|---|---|
| Benchmark | [-] | 69.7 | |||||||||||||||
| CRUNCEPv7 | [-] | 71.3 | 71.4 | 69.4 | 76.3 | 2.43 | 5.67 | 1.78 | 0.650 | 0.470 | 0.731 | 0.989 | 0.786 | 0.683 | |||
| GSWP3v1 | [-] | 76.1 | 76.1 | 69.4 | 76.3 | 6.68 | 11.5 | 2.51 | 0.362 | 0.252 | 0.612 | 0.999 | 0.685 | 0.527 | |||
| WFDEI | [-] | 72.5 | 72.6 | 69.4 | 76.3 | 3.26 | 7.97 | 1.67 | 0.553 | 0.340 | 0.757 | 0.989 | 0.914 | 0.649 |
Download Data |
Period Mean (original grids) [%] |
Model Period Mean (intersection) [%] |
Model Period Mean (complement) [%] |
Benchmark Period Mean (intersection) [%] |
Benchmark Period Mean (complement) [%] |
Bias [%] |
RMSE [%] |
Phase Shift [months] |
Bias Score [1] |
RMSE Score [1] |
Seasonal Cycle Score [1] |
Spatial Distribution Score [1] |
Interannual Variability Score [1] |
Overall Score [1] |
|||
|---|---|---|---|---|---|---|---|---|---|---|---|---|---|---|---|---|---|
| Benchmark | [-] | 72.4 | |||||||||||||||
| CRUNCEPv7 | [-] | 77.7 | 77.7 | 72.0 | 81.9 | 6.05 | 9.86 | 1.64 | 0.471 | 0.392 | 0.787 | 0.974 | 0.848 | 0.644 | |||
| GSWP3v1 | [-] | 81.5 | 81.5 | 72.0 | 81.9 | 9.60 | 14.8 | 1.47 | 0.306 | 0.242 | 0.815 | 0.972 | 0.690 | 0.545 | |||
| WFDEI | [-] | 79.0 | 78.9 | 72.0 | 81.9 | 6.99 | 10.1 | 1.23 | 0.428 | 0.407 | 0.861 | 0.970 | 0.809 | 0.647 |
Download Data |
Period Mean (original grids) [%] |
Model Period Mean (intersection) [%] |
Model Period Mean (complement) [%] |
Benchmark Period Mean (intersection) [%] |
Benchmark Period Mean (complement) [%] |
Bias [%] |
RMSE [%] |
Phase Shift [months] |
Bias Score [1] |
RMSE Score [1] |
Seasonal Cycle Score [1] |
Spatial Distribution Score [1] |
Interannual Variability Score [1] |
Overall Score [1] |
|||
|---|---|---|---|---|---|---|---|---|---|---|---|---|---|---|---|---|---|
| Benchmark | [-] | 53.7 | |||||||||||||||
| CRUNCEPv7 | [-] | 53.4 | 53.6 | 53.2 | 81.4 | 0.918 | 8.60 | 0.779 | 0.723 | 0.545 | 0.907 | 0.978 | 0.757 | 0.742 | |||
| GSWP3v1 | [-] | 63.6 | 63.7 | 53.2 | 81.4 | 10.7 | 15.3 | 1.02 | 0.421 | 0.430 | 0.881 | 0.986 | 0.792 | 0.656 | |||
| WFDEI | [-] | 59.2 | 59.3 | 53.2 | 81.4 | 6.39 | 11.5 | 0.641 | 0.593 | 0.468 | 0.922 | 0.985 | 0.917 | 0.726 |
Download Data |
Period Mean (original grids) [%] |
Model Period Mean (intersection) [%] |
Model Period Mean (complement) [%] |
Benchmark Period Mean (intersection) [%] |
Benchmark Period Mean (complement) [%] |
Bias [%] |
RMSE [%] |
Phase Shift [months] |
Bias Score [1] |
RMSE Score [1] |
Seasonal Cycle Score [1] |
Spatial Distribution Score [1] |
Interannual Variability Score [1] |
Overall Score [1] |
|||
|---|---|---|---|---|---|---|---|---|---|---|---|---|---|---|---|---|---|
| Benchmark | [-] | 84.9 | |||||||||||||||
| CRUNCEPv7 | [-] | 81.8 | 81.8 | 85.0 | 81.5 | -3.16 | 6.79 | 0.859 | 0.510 | 0.453 | 0.894 | 0.999 | 0.607 | 0.653 | |||
| GSWP3v1 | [-] | 80.3 | 80.3 | 85.0 | 81.5 | -4.59 | 10.8 | 1.30 | 0.438 | 0.253 | 0.830 | 0.903 | 0.522 | 0.533 | |||
| WFDEI | [-] | 86.6 | 86.6 | 85.0 | 81.5 | 1.58 | 5.12 | 0.658 | 0.703 | 0.466 | 0.929 | 0.998 | 0.813 | 0.729 |
Download Data |
Period Mean (original grids) [%] |
Model Period Mean (intersection) [%] |
Model Period Mean (complement) [%] |
Benchmark Period Mean (intersection) [%] |
Benchmark Period Mean (complement) [%] |
Bias [%] |
RMSE [%] |
Phase Shift [months] |
Bias Score [1] |
RMSE Score [1] |
Seasonal Cycle Score [1] |
Spatial Distribution Score [1] |
Interannual Variability Score [1] |
Overall Score [1] |
|||
|---|---|---|---|---|---|---|---|---|---|---|---|---|---|---|---|---|---|
| Benchmark | [-] | 70.7 | |||||||||||||||
| CRUNCEPv7 | [-] | 69.5 | 69.3 | 70.4 | 79.2 | -0.566 | 6.60 | 0.922 | 0.728 | 0.520 | 0.881 | 0.974 | 0.581 | 0.701 | |||
| GSWP3v1 | [-] | 71.6 | 71.4 | 70.4 | 79.2 | 1.46 | 13.0 | 1.33 | 0.466 | 0.319 | 0.826 | 0.737 | 0.718 | 0.564 | |||
| WFDEI | [-] | 71.7 | 71.7 | 70.4 | 79.2 | 1.55 | 7.29 | 0.625 | 0.744 | 0.452 | 0.924 | 0.996 | 0.889 | 0.743 |
Download Data |
Period Mean (original grids) [%] |
Model Period Mean (intersection) [%] |
Model Period Mean (complement) [%] |
Benchmark Period Mean (intersection) [%] |
Benchmark Period Mean (complement) [%] |
Bias [%] |
RMSE [%] |
Phase Shift [months] |
Bias Score [1] |
RMSE Score [1] |
Seasonal Cycle Score [1] |
Spatial Distribution Score [1] |
Interannual Variability Score [1] |
Overall Score [1] |
|||
|---|---|---|---|---|---|---|---|---|---|---|---|---|---|---|---|---|---|
| Benchmark | [-] | 65.5 | |||||||||||||||
| CRUNCEPv7 | [-] | 52.6 | 52.7 | 63.7 | 81.7 | -8.08 | 15.0 | 1.04 | 0.345 | 0.417 | 0.858 | 0.971 | 0.684 | 0.615 | |||
| GSWP3v1 | [-] | 62.7 | 62.9 | 63.7 | 81.7 | 0.765 | 12.3 | 0.946 | 0.482 | 0.372 | 0.865 | 0.967 | 0.631 | 0.615 | |||
| WFDEI | [-] | 65.4 | 65.4 | 63.7 | 81.7 | 2.54 | 10.0 | 0.543 | 0.502 | 0.467 | 0.927 | 0.975 | 0.783 | 0.687 |
Temporally integrated period mean